A Look at the Model Shadow Stock Portfolio’s True Risk
by James B. Cloonan
A The stock market has come roaring back and now is at pre-recession levels. However, the economy does not appear to be back—particularly employment.
It is hoped that the second-worst market drop in a century is over and we will have some normal markets for awhile. So far this year, the Model Shadow Stock Portfolio is up 10.6%, compared to 6.6% for the S&P 500 index as measured by the Vanguard 500 Index fund (VFINX). The results for 2012 and other periods can be seen in Figure 1 and Table 3.
Comparing Risk Levels
While the Model Shadow Stock Portfolio was hit harder percentage-wise during the downturn than the overall market (as can be seen in the cumulative return chart in Figure 1), it took much less time to recover. Looking at the yellow line, which is the Vanguard 500 Index fund, and the purple line, which is the Model Shadow Stock Portfolio, what would you say about the comparative risk? I am referring to risk in the real sense of the word—the chance of loss. The Vanguard 500 Index fund fell less than the Model Shadow Stock Portfolio from its high, but has taken almost twice as long to recover. It has the lowest standard deviation, but does it have the lowest risk?

A major factor determining true risk lies in the processes of the investor. If an investor was long term and disciplined with a horizon of four to six years, there was little risk with any of the portfolios. If, on the other hand, the investor panicked and sold near the bottom, or had invested money needed in less than four years, then there was probably a loss. The best time to examine your risk tolerance and your asset allocation is just after a market crash. If you net sold during the downturn, then you need to adjust your exposure in the future.
Despite the domestic and foreign problems that are out there, I continue to feel the market wants to go up. My long-term philosophy, however, has been to be mostly neutral with long-term allocations. I have been willing to be more aggressive when the market was below its long-term highs because it has always come back. I get more conservative when the market is setting new highs even though what is going up tends to keep going up—until, of course, it doesn’t.
| Current | 52-Week | Market | P/E | P/B | Div | |||
| Price | High | Low | Cap | Ratio | Ratio | Yield | ||
| Company (Ticker) | ($) | ($) | ($) | ($ Mil) | (X) | (X) | (%) | Notes |
| Addus Homecare Corp. (ADUS) | 8.81 | 10.00 | 3.50 | 95.3 | 14.9 | 1.05 | 0.0 | |
| Alamo Group, Inc. (ALG) | 35.78 | 36.75 | 25.51 | 428.1 | 13.4 | 1.40 | 0.8 | |
| Alpha & Omega Semicon (AOSL)* | 8.06 | 10.45 | 6.95 | 205.0 | 10.0 | 0.69 | 0.0 | qualified as of 2/28/2013 |
| CSS Industries, Inc. (CSS) | 24.01 | 27.06 | 17.86 | 227.3 | 15.5 | 0.91 | 2.5 | |
| Ducommun Incorporated (DCO) | 15.50 | 17.11 | 7.71 | 164.2 | nmf | 0.75 | 0.0 | |
| Ennis, Inc. (EBF) | 15.66 | 17.14 | 13.70 | 409.6 | 19.3 | 1.12 | 4.5 | |
| Flexsteel Industries (FLXS) | 23.00 | 24.94 | 16.61 | 162.8 | 12.2 | 1.12 | 2.6 | |
| Gilat Satellite Networks (GILT) | 5.55 | 6.20 | 2.31 | 229.2 | nmf | 0.87 | 0.0 | |
| Hardinge Inc. (HDNG) | 13.08 | 13.30 | 8.20 | 152.9 | 8.5 | 0.94 | 0.6 | |
| Hooker Furniture Corp. (HOFT) | 15.01 | 15.58 | 10.01 | 161.3 | 29.4 | 1.26 | 2.7 | |
| Key Tronic Corp. (KTCC) | 10.63 | 13.16 | 7.15 | 111.5 | 7.9 | 1.27 | 0.0 | |
| Kimball International (KBALB) | 9.21 | 13.25 | 5.87 | 274.6 | 20.0 | 0.88 | 2.2 | |
| Marlin Business Services (MRLN) | 18.95 | 23.08 | 13.33 | 241.5 | 20.8 | 1.33 | 2.1 | |
| Medical Action Industries (MDCI) | 5.92 | 6.24 | 2.25 | 97.0 | nmf | 1.03 | 0.0 | |
| Mitcham Industries (MIND) | 15.35 | 26.44 | 11.51 | 197.1 | 8.6 | 1.14 | 0.0 | |
| Olympic Steel, Inc. (ZEUS) | 20.67 | 25.86 | 14.77 | 226.2 | 98.4 | 0.79 | 0.4 | |
| PC Connection, Inc. (PCCC) | 14.34 | 14.99 | 7.34 | 371.9 | 11.6 | 1.30 | 0.0 | |
| PCM Inc. (PCMI) | 7.10 | 7.46 | 5.06 | 85.2 | 37.4 | 0.74 | 0.0 | qualified as of 2/28/2013 |
| RCM Technologies, Inc. (RCMT) | 5.66 | 6.72 | 4.89 | 69.7 | 21.8 | 0.97 | 0.0 | |
| Renewable Energy Gp (REGI) | 7.39 | 10.65 | 4.28 | 225.6 | 2.8 | 0.67 | 0.0 | |
| REX American Resources (REX) | 23.10 | 33.95 | 14.43 | 188.4 | 12.0 | 0.76 | 0.0 | qualified as of 2/28/2013 |
| Rocky Brands, Inc. (RCKY) | 13.82 | 16.00 | 10.74 | 103.7 | 15.7 | 0.84 | 0.0 | |
| Saga Communications (SGA) | 43.90 | 51.61 | 25.31 | 248.8 | 15.2 | 2.36 | 0.0 | approaching value limit |
| Salem Communications (SALM)* | 6.28 | 6.94 | 2.44 | 153.3 | 44.9 | 0.76 | 2.2 | qualified as of 2/28/2013 |
| Shoe Carnival, Inc. (SCVL) | 19.43 | 24.66 | 17.08 | 397.0 | 13.5 | 1.24 | 1.0 | |
| Standard Motor Products (SMP) | 24.73 | 25.14 | 11.94 | 564.3 | 8.6 | 1.85 | 1.8 | |
| Sterling Construction (STRL) | 11.30 | 11.79 | 7.12 | 186.4 | nmf | 0.88 | 0.0 | earnings probation (2012 Q2) |
| TravelCenters of America (TA)* | 6.88 | 7.98 | 4.18 | 203.2 | 6.2 | 0.53 | 0.0 | qualified as of 2/28/2013 |
| VOXX International (VOXX) | 9.95 | 14.25 | 5.55 | 234.0 | 10.2 | 0.54 | 0.0 | qualified as of 2/28/2013 |
| Willis Lease Finance (WLFC) | 15.01 | 15.24 | 11.31 | 133.0 | nmf | 0.62 | 0.0 | |
| *Company is new to the portfolio. Added 3/1/2013. | ||||||||
| nmf = no meaningful figure. | ||||||||
| Source: AAII’s Stock Investor Pro/Thomson Reuters. Data as of 2/28/2013. | ||||||||
Explanation of Notes
Approaching Size Limit: Stocks are sold if their market capitalization goes above three times the initial maximum criterion. The current market capitalization maximum for initial screening is $240 million. Stocks are marked “approaching size limit” if their current market cap exceeds 2½ times the initial criterion, or $600 million.
Approaching Value Limit: Stocks are sold once their price-to-book-value ratio goes above three times the initial criterion. The current initial price-to-book ceiling is 0.80. Stocks are marked “approaching value limit” if their current price-to-book-value ratio exceeds 2½ times the initial criterion, or 2.00.
Earnings Probation: If the last 12 months’ earnings from continuing operations are negative, the stock is put on probation; if a subsequent quarter has negative earnings prior to 12-month earnings becoming positive, the stock is sold. The date within the parentheses lists the fiscal quarter during which the company first reported negative trailing 12-month earnings.
Qualified as of: Stock still qualified as a buy when the screen was run with current data. Stocks that don’t currently qualify as a buy are held until they meet one of the sell rules.
Portfolio Changes
Table 1 lists the current holdings in the Model Shadow Stock Portfolio.
Capital Senior Living Corp. (CSU) and Standex International Corp. (SXI) were sold because their price-to-book ratios went above 2.40, and so they are no longer value stocks by our standards. Good luck to them in someone’s growth portfolio.
| Company | Reason |
| Buy | |
| Alpha & Omega Semicon (AOSL) | |
| Salem Communications Corp. (SALM) | |
| TravelCenters of America LLC (TA) | |
| Sell | |
| Capital Senior Living Corp. (CSU) | exceeded size & value limits |
| Standex International Corp. (SXI) | exceeded size limits |
With the proceeds from the sales, we purchased Alpha & Omega Semiconductor Ltd. (AOSL), Salem Communications Corp. (SALM) and TravelCenters of America LLC (TA) as shown in Table 2.
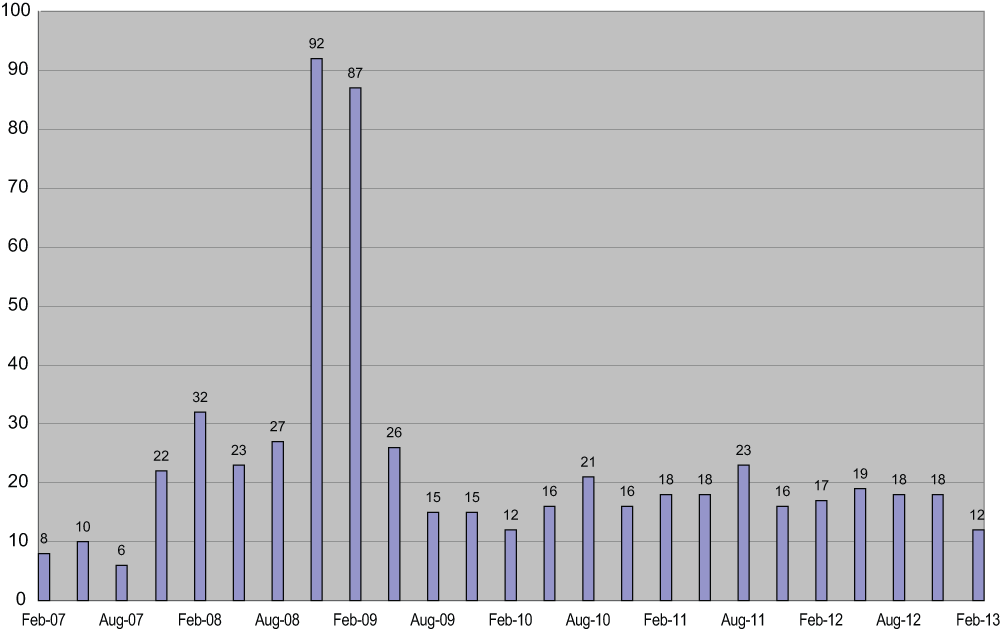
Twelve stocks qualified under our criteria. Four of these were China based and two, Olympic Steel Inc. (ZEUS) and PCM Inc. (PCMI), formerly PC Mall Inc. (MALL), were already in the portfolio. As can be seen in Figure 2, 12 qualifying stocks is toward the low end of our experience, but not at the low level that preceded the last downturn. We still don’t know whether the level of qualifiers is significant, and a quarter-to-quarter variation might be random noise. We hit 12 qualifiers in February 2010, but it bounced right back up.
Looking Ahead
At this point, 2013 is already a strong year, but of course we have a ways to go and there are a lot of scary things out there, starting with Congress and the administration.
| Average Annual Return (%) | Cumulative Value of $10,000 ($) | |||||
| Model | Vanguard | Vanguard | Model | Vanguard | Vanguard | |
| Shadow | 500 | Small Cap | Shadow | 500 | Small Cap | |
| Stock | Index | Index | Stock | Index | Index | |
| Year | Portfolio | (VFINX) | (NAESX) | Portfolio | (VFINX) | (NAESX) |
| 1993 | 32.3 | 9.9 | 18.7 | 13,230 | 10,989 | 11,870 |
| 1994 | 2.0 | 1.2 | -0.5 | 13,492 | 11,118 | 11,810 |
| 1995 | 20.7 | 37.4 | 28.7 | 16,291 | 15,282 | 15,204 |
| 1996 | 22.3 | 22.9 | 18.1 | 19,927 | 18,775 | 17,959 |
| 1997 | 44.3 | 33.2 | 24.6 | 28,756 | 25,010 | 22,375 |
| 1998 | -8.9 | 28.6 | -2.6 | 26,188 | 32,168 | 21,790 |
| 1999 | 0.0 | 21.1 | 23.1 | 26,187 | 38,945 | 26,831 |
| 2000 | -7.7 | -9.1 | -2.7 | 24,163 | 35,418 | 26,116 |
| 2001 | 21.4 | -12.0 | 3.1 | 29,325 | 31,160 | 26,926 |
| 2002 | 10.8 | -22.1 | -20.0 | 32,506 | 24,259 | 21,535 |
| 2003 | 73.1 | 28.5 | 45.6 | 56,268 | 31,174 | 31,360 |
| 2004 | 43.7 | 10.8 | 19.9 | 80,843 | 34,530 | 37,587 |
| 2005 | 17.9 | 4.8 | 7.4 | 95,353 | 36,180 | 40,376 |
| 2006 | 29.4 | 15.6 | 15.6 | 123,363 | 41,832 | 46,687 |
| 2007 | -1.8 | 5.4 | 1.2 | 121,166 | 44,083 | 47,227 |
| 2008 | -50.8 | -37.0 | -36.0 | 59,582 | 27,764 | 30,217 |
| 2009 | 72.3 | 26.5 | 36.1 | 102,665 | 35,120 | 41,130 |
| 2010 | 45.4 | 14.9 | 27.7 | 149,238 | 40,358 | 52,529 |
| 2011 | 6.3 | 2.0 | -2.8 | 158,701 | 41,155 | 51,067 |
| 2012 | 33.3 | 15.8 | 18.0 | 211,588 | 47,666 | 60,274 |
| YTD | 10.6 | 6.6 | 7.8 | 234,003 | 50,807 | 64,961 |
| Since Incep | 16.9 | 8.4 | 9.7 | 234,003 | 50,807 | 64,961 |
| Data as of 2/28/2013. | ||||||
We will review the portfolio again in the July issue of the AAII Journal and in the meantime, you may keep abreast here.
Model Shadow Stock Portfolio Rules
Purchase and Sales Rules
Stock purchases must meet these criteria:
- No bulletin board or pink sheet stocks will be purchased.
- Price-to-book-value ratio must be less than 0.80. (Figure will change gradually with changes in overall market values.)
- Market capitalization must be between $30 million and $240 million. (Figure will change gradually with changes in overall market values.)
- The firm’s last quarter and last 12 months’ earnings from continuing operations must be positive.
- No financial stocks or limited partnerships will be purchased.
- No stocks on foreign exchanges or ADRs will be purchased because of different accounting and/or withholding tax on dividends.
- The share price must be greater than $4.
- In order to reduce trading by avoiding stocks that are forever marginal, any stock that was sold within two years will not be rebought.
- Note second item under Stock Order Guidance concerning spreads when buying shares.
- Price-to-sales ratio must be less than 1.2. (Figure may change gradually with changes in overall market values.)
- Eliminate any company that failed to file a 10-Q (quarterly) report in the last six months.
Stocks are sold if any of the following occur:
- If last 12 months’ earnings from continuing operations are negative, the stock is put on probation; if a subsequent quarter has negative earnings prior to 12-month earnings from continuing operations becoming positive, the stock is sold.
- The stock’s price-to-book-value ratio goes above three times the initial criterion.
- Market capitalization goes above three times the initial maximum criterion.
Stock Order Guidance
- These rules are for general guidance. Your own experience, market conditions and the size of the position will impact your own decisions. The results in the model portfolio were obtained while sometimes paying more.
- Market orders are not used. Instead, if the quoted bid-ask spread is less than 2% (ask price minus bid price, divided by ask price), place a limit order at the ask price for a buy and at the bid price for a sell. If the bid-ask spread is more than 2%, try to place a limit order between the bid and ask prices to keep transaction costs low. If necessary, build a position gradually. With low commissions, it is often better to place partial orders than to try to establish a large position all at once. Be patient.
- The average daily dollar volume should be at least four times the amount needed for your position. This will ensure liquidity to get in and out of the position, even if you need to grow the position gradually and sell gradually. This will result in a varying number of qualifying stocks for each investor.
- For NASDAQ stocks, it appears to be better to use day orders. If the order is not filled, it is placed again with a slight adjustment. For NYSE and Amex stocks, good-till-canceled (GTC) orders are used to keep a place in line in the specialists’ books. If the market isn’t close to the desired price, the price is adjusted in a few days with a new GTC order.
- If price changes cause a stock to become ineligible (due to changes in price-to-book-value ratio or market capitalization) when only part of the order has been filled, stocks already purchased are kept but the balance of the order is canceled.
Management Rules
- Equal dollar amounts are invested in each stock initially.
- Decisions are made only at the end of each quarter. In order to react to the majority of earnings reports as soon as possible, quarterly reviews are made in February, May, August, and November.
- Best judgment is used for tenders or mergers, but all criteria must be obeyed.
- At the end of a quarter, if receipts from stocks sold exceed requirements for new purchases, the excess receipts—up to 5% of the portfolio’s value—are kept in cash until the next quarter. If the excess receipts are greater than 5% of the total portfolio value, the amount above 5% is distributed to smaller holdings that still qualify as buys. Efficient quantities are purchased: If over 10% of the portfolio is in cash, the price-to-book-value ratio can be moved up, but never over 0.90.
- At the end of a quarter, if receipts from stock sales are insufficient to buy all newly qualifying stocks, purchases are made in order of lowest bid/ask spreads.
- Note that if you are managing your own portfolio, it should consist of at least 10 stocks. If you are developing the portfolio gradually, you can do it stock by stock, but don’t put more than 10% of your funds in each additional stock. More than 20 stocks is not needed until the portfolio exceeds $1 million..