
Related

Trading Strategies
A common pitfall of examining historical data for clues of predictive value is hindsight bias.
Hindsight bias occurs when a person believes the outcome of an event was predictable in the past. In the world of investing, we commonly see this when someone claims they knew they should have bought a certain stock while it was in the early stages of a big run or when they say they knew it was time to get out of the market before a big downturn occurred.
Hindsight bias is related to the human tendency to see patterns in how events play out. Early man learned to identify various patterns as part of his survival instinct. Learning the migration habits of animals helped to hunt. Similarly, learning seasonal weather patterns allowed our ancestors to transition from being nomads to becoming farmers.
The problem with our tendency to recognize patterns is its effect on how we view both random events and events whose outcomes were not so obvious at some prior point. We naturally default to assuming a known data point, statistic or outcome can be used to analyze historical data. This assumption ignores the possibility of the data point or statistic evolving over time. It also ignores the possibility of a different outcome having occurred if the data was viewed differently at some point in the past.
A way to avoid hindsight bias is to examine data as it existed in the past. In other words, the analysis must only be limited to the information that was available to the individual at a certain point of time. In order to do this, the data must also be clear of survivorship bias. Survivorship bias occurs when components of the data universe are dropped over time. A mutual fund database would have survivorship bias if it excluded all funds that have been closed or merged into other funds at some point in the past. An analysis of a trading strategy would have survivorship bias if it excluded stocks that no longer exist. These are stocks that not only existed in the past, but that also would have been identified by the strategy on a previous date. A study without hindsight bias and survivorship bias measures what would have happened if the decision was made based on the information available to a person at a given point in time.
To show how hindsight bias can affect the outcome of analysis, I conducted two new analyses of the AAII Sentiment Survey. The first analysis determined what was an unusually high or low reading based on the historical data available on a given past date in time. The second used the measures of unusually high and low readings as we currently define them to provide a comparison. The AAII Sentiment Survey is a useful data group to use since we have been logging the weekly results ever since the poll was first conducted in July 1987.
There is also a second benefit to this analysis. Investors can see how the S&P 500 index performed when aggregate sentiment about the short-term direction of stock prices was positive (bullish), neutral or negative (bearish). In other words, this analysis looks at the historical synchrony between the AAII Sentiment Survey and the performance of the market.
The AAII Sentiment Survey asks a simple question: “I feel that the direction of the stock market over the next six months will be:
The survey is conducted weekly from Thursday, 12:00 a.m. Central Time, to Wednesday, 11:59 p.m. Central Time. AAII members participate by visiting the Sentiment Survey page (www.aaii.com/sentimentsurvey) on AAII.com and voting. The survey is open to all members, though a weekly email is sent to a rotating group of members reminding them to participate. Results of the survey are automatically tabulated by our database and published online early each Thursday morning. Prior to the year 2000, members responded by physically mailing a postcard back to the AAII offices. Response rates have varied over the years, but since the start of 2013, more than 300 AAII members take the survey on an average week.
The typical AAII member is a male in his mid-60s with a bachelor’s or graduate degree. AAII members tend to be affluent with a median portfolio size in excess of $1 million. The typical member describes himself as having a moderate level of investment knowledge and engaging primarily in fundamental analysis. This said, AAII has in excess of 170,000 members and, simply due to the sheer size of our membership, there are wide variances in wealth, investment knowledge and investing styles. We also have many female members. The AAII Sentiment Survey is unique in that it conveys the attitudes of engaged, hands-on individual investors.
A spreadsheet with the historical data of the results is available on the Sentiment Survey page (www.aaii.com/sentimentsurvey). The average readings for bullish, neutral and bearish sentiment can be found at the bottom of the spreadsheet. As of the start of May 2014, bullish sentiment averaged 38.8%, neutral sentiment averaged 30.7% and bearish sentiment averaged 30.5%. We commonly round these readings to 39.0%, 30.5% and 30.5%, respectively, when discussing the survey results. These numbers reflect all known data and, if used to determine whether the survey has historically been a contrarian indicator, would incorporate hindsight bias.
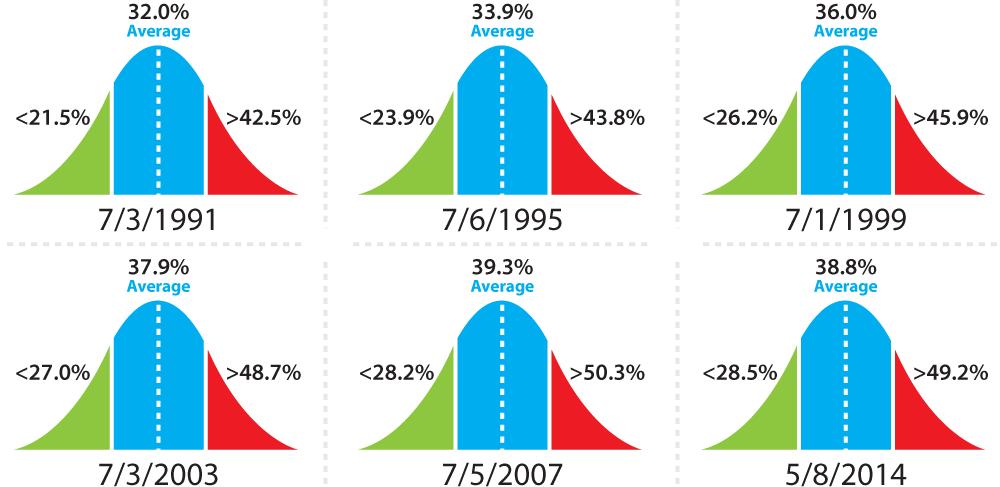
The majority of the weekly readings have fallen in a range around these averages. Approximately 68% of all bullish sentiment readings, for instance, have been between 28.5% and 49.2%. Neutral sentiment has typically ranged between 22.0% and 39.3%. Bearish sentiment has typically ranged between 20.5% and 40.5%. Statisticians refer to these ranges as normal distributions. Figure 1 shows the normal distributions for bullish sentiment over time.
Normal distribution is defined as measurements that are within one standard deviation of the average mean value. Mathematically, 68.2% of the range of observations within a set of data fall into the normal distribution. Values outside of this range are considered to be outliers, or, in statistical terms, one standard deviation or more away from the mean. The outliers are the numbers we are most interested in. An outlier in the sentiment survey implies that bullish, neutral or bearish attitudes among individual investors were at unusually high or low levels. In other words, we want to see how the market performed after the survey results gave a “signal.”
There are a two other data points included in the Sentiment Survey spreadsheet. The first is a rolling eight-week average of the bullish sentiment. The second is the current difference between bullish and bearish sentiment: the “bull-bear spread.” Both are calculated on a weekly basis. For the purposes of this analysis, I added an additional data point: a rolling eight-week average of bearish sentiment. Market returns following outlying values for all of these data points were also calculated.
To exclude the impact of hindsight bias, I had to determine what would have qualified as an outlier at a given point in the past. This is because both the average and the typical range of values have changed over time. For example, at the end of 1987, bullish sentiment had an average value of 40.6% and normal distribution of 28.9% through 52.3%. An investor looking at the data on December 31, 1987, would have no way of knowing that the normal distribution was going to narrow to 26.4% to 46.3% by the end of 1999. Eliminating hindsight bias requires conducting the analysis based solely on the data that would have been available at a given point in time.
In order to accomplish this, I created what I’ll refer to as a prevailing average. This is the average value of all historical readings since the first weekly results were recorded on July 24, 1987. It is backward looking, meaning the prevailing average does not consider any values registered after a particular point in time. It also differs from a moving average in that it has a set starting date—all data from July 1987 is always considered. In contrast, a moving average, such as the types commonly plotted on stock price charts, has a beginning date that is consistently shifted forward.
I’ll use bearish sentiment to show how the prevailing average works. On December 27, 1991, bearish sentiment had a prevailing average of 30.6%. This number is the average of all bearish sentiment readings between July 1987 and December 1991. Analysis of the survey conducted at the end of 1991 would have resulted in an average value of 30.6% being calculated. If the analysis were conducted 10 years later instead, on December 27, 2001, the average for bearish sentiment would have been calculated as 27.7%. The difference between the two values is simply the inclusion of four versus 14 years of data.
A similar methodology was used for determining what qualified as an outlier. Standard deviation, the border between what is a typical reading and what is an outlier, was calculated based on all prior data up to a specific date. The 8.7% standard deviation for neutral sentiment on June 24, 2004, for example, is based on all weekly data between July 24, 1987, (when the survey started) and June 24, 2004.
To determine whether a correlation exists between individual investor sentiment and market direction, I looked at how the S&P 500 performed following an unusually high or low reading in the AAII Sentiment Survey. Unusually high bullish sentiment, high bull-bear spread, or low bearish and low neutral readings were considered to be correct if the market fell over the following 26-week and 52-week periods. (In other words, the S&P 500 declined following a period with too much optimism, too little uncertainty or too little pessimism.) Low bullish numbers, low bull-bear spread, or high neutral sentiment and high bearish sentiment readings were considered to be correct if stocks rose over the following six-month periods (the S&P 500 rose after a period with little optimism, high levels of uncertainty or too much pessimism). Both the eight-week bullish and the eight-week bearish average readings were measured in the same manner as bullish and bearish sentiment readings.
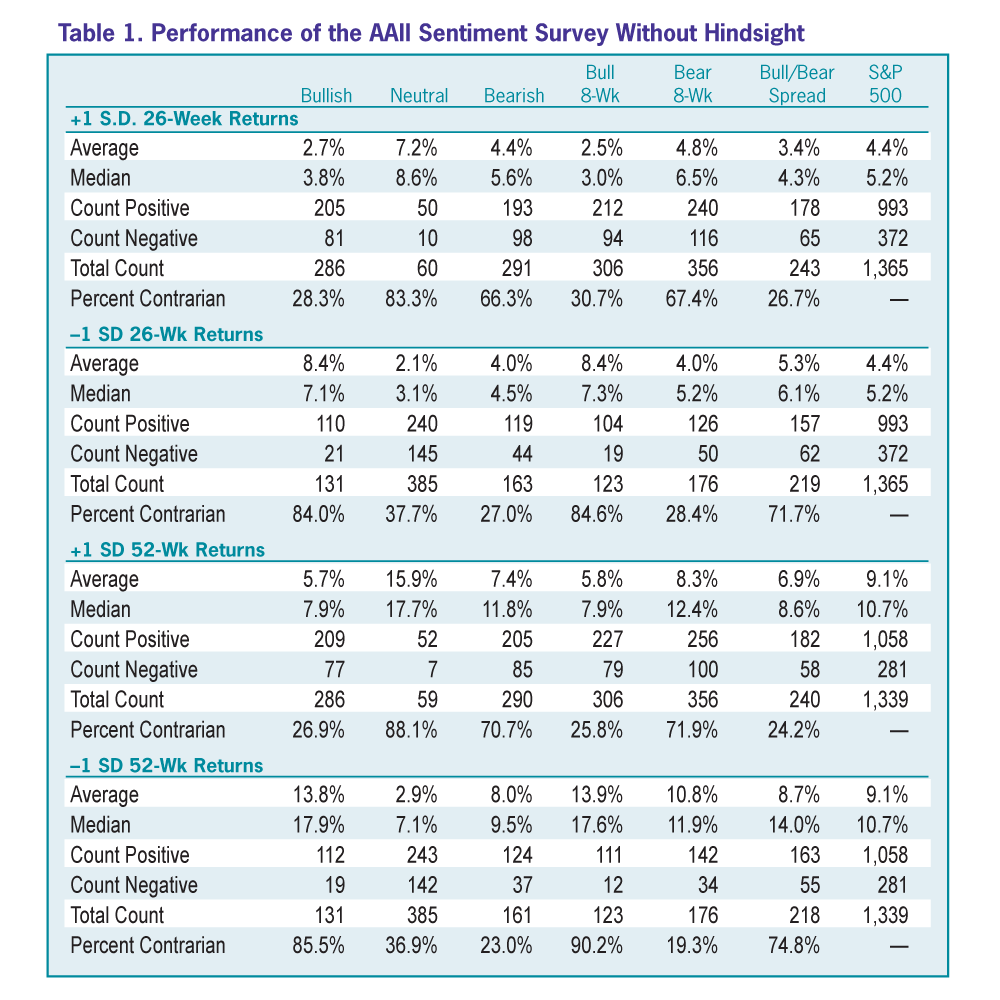
Table 1 shows how the S&P 500 performed whenever an indicator in the Sentiment Survey had an outlying value.
The best contrarian signal occurred not when investors were unusually optimistic or pessimistic, but rather when they described themselves as being neutral (defined by the survey as expecting stock prices to be unchanged over the next six months). Unusually high levels of neutral sentiment have been followed by a median 26-week rise in the S&P 500 of 8.6% and a median 52-week rise in the S&P 500 of 17.7%. In contrast, the S&P 500 had a median return of 5.2% and 10.7%, respectively, over all 26-week and 52-week periods throughout the survey’s history. Equally notable, the large-cap index was up 83.3% of all 26-week periods and 88.1% of all 52-week periods following an unusually high neutral sentiment reading. (The median is the point at which there are an equal number of higher and lower values. It is less subject to being skewed upward or downward by a large single data point than average values are.)
Low levels of optimism have also historically been associated with good buying opportunities during the survey’s history. The S&P 500 has risen by a median of 7.1% over the 26-week periods following an unusually low level of bullish sentiment. Gains have occurred 84.0% of the time. On a 52-week basis, the S&P 500 rose by a median of 17.9%, with gains realized following 85.5% of all low bullish sentiment readings. The occurrence of a 52-week gain in the S&P 500 was even greater when the eight-week bullish average was more than one standard deviation below average.
High levels of pessimism also tended to be followed by periods of market outperformance, but not with the same frequency or magnitude. The S&P 500 rose by a median of 5.6% during the 26-week period following an unusually high bearish sentiment reading. High levels of pessimism were followed by rising stock prices 66.3% of the time.
The data shows that it has been better to buy stocks when investors do not expect good short-term returns than when they expect prices to fall. This has at least been the case over the AAII Sentiment Survey’s 27-year period. In other words, Baron Rothschild’s advice of buying “when there is blood in the streets” may not be the best guidance. Rather, the time to buy may be when investors think there is a possibility of blood pouring (or more blood pouring) onto the streets or are simply uncertain about whether Mr. Market will be in a chipper or sullen mood.
There may be a logical reason for this. High levels of neutral sentiment suggest that while investors are not optimistic about the short-term outlook for stocks, they are not fearful of owning stocks either. This implies investors are staying engaged versus avoiding stocks. Low levels of bullish sentiment imply investors are not optimistic that prices will rise, while high levels of bearish sentiment imply investors expect stock prices to fall. The seemingly subtle difference is tied to loss aversion—an investor who is worried about falling prices will be less likely to buy stocks than one who merely doesn’t expect prices to rise over the short term. The latter investor will be more willing to risk temporary lackluster performance if he thinks valuations are attractive enough or may be looking for signs that a market bottom has been established.
While there is a link between the Sentiment Survey and stock market rebounds, it does not fully hold up in reverse. Neither high levels of optimism nor low levels of bearish sentiment have routinely been followed by declines in the S&P 500. The S&P 500 has had its worst performance whenever bullish sentiment been at unusually high levels, but it still has mostly risen, with a median 26-week gain of 3.8%. Unusually low levels of bearish sentiment have been followed by periods of even better performance, with a median 26-week gain of 4.5%.
Table 2 shows the synchrony between the AAII Sentiment Survey and market direction when the current long-term averages and standard deviations are used to determine if a link exists. As previously stated, I ran this second analysis to show you a comparison of how hindsight bias affects the results. Though similar conclusions are reached regardless of whether hindsight bias is eliminated or is allowed to influence the results, there are differences.
Basing the analysis on what we currently consider to be readings beyond the normal distribution range resulted in fewer outliers. Unusually high levels of bearish sentiment were more correlated with rising markets and were followed by lower levels of 52-week market returns than when hindsight was excluded. Conversely, incorporating hindsight basis showed unusually low levels of bullish sentiment to have worse performance and a weaker correlation with rising markets. When 52-week returns were calculated, the results were mixed.
Though the differences are interesting, the important point to remember is that by looking at the data without hindsight bias, you get a better sense of returns that would have been achieved had you used the survey as a contrarian signal at some point in the past.
At first glance, the numbers suggest the AAII Sentiment Survey can be used to determine buying opportunities or times to increase your allocations to stocks. The danger in thinking that is that the link is correlated, not causal. High levels of pessimism or low levels of optimism do not cause stocks prices to rebound. Rather, they are associated with periods of market turbulence. Such periods are often characterized by reduced valuations. Therefore, the AAII Sentiment Survey may work better as a prompt to determine whether a buying, selling or rebalancing opportunity exists than as an actual market timing indicator.
Furthermore, outlying sentiment readings don’t always prove to be accurate indicators of changes in market direction. During the three-week period of July 3 through July 17, 2008, bullish sentiment came in at the unusually low levels of 23.9%, 22.2% and 25.0%. During the 26-week periods following each of these readings, the S&P 500 lost 28.4%, 27.2% and 32.3%, respectively. Granted, 2008 was a very difficult period, but the magnitude of the losses shows that the Sentiment Survey is not a flawless market timing indicator.
Sample size and the timing of data is another issue. Though there has been a historical trend between unusually high levels of neutral sentiment and good market returns, the data is mostly from the first 16 years of the survey’s existence. Only one occurrence since 2003 is included in this analysis: August 1, 2013. It is too early to know what the 26-week and 52-week returns for the market will be following the unusually high levels of neutral sentiment reached in March, April and May of this year (2014).
No market timing indicator or forecaster is correct on a consistent basis. Often, the most influential catalysts on market direction are not easy to predict in advance. Plus, even if a measure (sentiment or a different one) has historically been associated with changes in market direction, an investor could wait for a considerable period of time for a signal to appear. In the process, he could miss out on profitable periods for stocks.
This is why it is more important to focus on your long-term financial goals than trying to determine where stock prices are headed over the next month, six months or 12 months.
Trading Strategies