
Related

Financial Planning
Article Highlights:
In the May 2018 AAII Journal, I provided an introduction to real estate investment trusts (REITs) [“The Basics of Real Estate Investment Trusts (REITs)”].
The article discussed public versus private real estate investing and how indirect and direct real estate investing differs, as well as types of REITs and the investment characteristics that individual investors should expect from REITs.
This article discusses how to analyze equity REITs on a fundamental basis. Fundamental analysis is similar to “bottom-up” analysis, which looks at ratios, multiples and other important metrics and compares those values to the REIT’s historical averages or to its competitors in order to determine an “intrinsic” value, or true worth. The alternative is “top-down” analysis, which focuses more on analyzing real estate cycles, sectors, interest rates, etc., to determine which segments of the REIT market might underperform or outperform over a given time period.
Although the primary focus is on equity REIT analysis, some of what is mentioned here also applies to mortgage REITs.
Please keep in mind that this article is not all-inclusive, as the number of measures that could be analyzed are endless. Instead, my goal is to focus on some of the main concepts and calculations.
Net operating income (NOI) measures the net cash generated by an income-producing property. It is total revenue earned from a property minus operating expenses attributable to that property. Net operating income is a before-tax figure that excludes principal and interest payments on loans, impairment, depreciation and amortization (see Figure 1 for the full calculation).
Operating expenses may include the costs of running or maintaining the building, such as legal fees, maintenance fees, insurance, utilities or property taxes. Net operating income is referred to as a pretax measure because the REIT’s corporate tax (if any is paid) is excluded from the calculation. However, property taxes paid for an individual property are considered an operating expense and are therefore accounted for in the calculation.
Some REITs calculate net operating income as a percentage of another measure (NOI may be separated by operating segment, geography, or even specific property/lease type) in order to analyze concentration risk. Concentration risk helps to measure what portion of a REIT’s net operating income could be at risk if certain sectors were to experience downturns; a high concentration means the company’s NOI is heavily reliant on that particular income source.
You may also see “same-store” net operating income, which measures the change in NOI from the year-ago period on properties owned for the entire current period and in the entire year-ago period. Looking at net operating income on a same-store basis allows an investor to analyze what portion of the company’s NOI growth is the result of growth in existing locations versus what portion is accounted for by the opening of new stores.
A measure often used in conjunction with net operating income is the “capitalization rate,” or cap rate, which shows the NOI generated by a property relative to its value. The cap rate shows the current yield on investment, with higher numbers generally being better. A higher cap rate can also mean higher risk, as investors will likely demand a higher return for taking on extra risk. Cap rates also vary with current market conditions and geographies. The cap rate is often used in financial modeling along with methodologies like discounted cash flow (DCF) analysis.
An investor should look for growing net operating income over time and be aware of any concentration risk as demonstrated by a high percent of NOI attributable to a specific operating segment, geography or property/lease type.
Net operating income is similar to EBITDA—or earnings before interest, taxes, depreciation and amortization—which is used in stock analysis. However, EBITDA includes non-operating income, while NOI doesn’t. EBITDA also includes general and administrative expenses, while NOI does not. EBITDA is a more widely available data point on third-party research websites.
Although it’s easier to explain how to calculate net operating income starting with revenue and working down, most REIT companies show the calculation from net income up (adding back line items that aren’t included in the calculation), which is how it is displayed in Figure 1. NOI can be unique to each REIT’s circumstances; there is no exact formula.
As with traditional equities (stocks), rising earnings are the driving force behind a REIT’s long-term growth in share price. Common stock investors use net income and earnings per share as a key measure of profitability, but in the REIT world, investors use funds from operations (FFO) and FFO per share.
Why can’t we just use net income for REITs?
The primary reason net income is less meaningful for REITs has to do with depreciation. Accrual accounting records transactions when they occur, regardless of when cash is exchanged. In accrual accounting, depreciation is always treated as an expense.
Think of depreciation as accounting’s attempt to measure general wear and tear. Depreciation is easily understood when thinking of vehicles: A car that you purchased 10 years ago has lost value from when you drove it off the lot until now. Real estate values, on the other hand, can fluctuate due to market conditions and don’t lose value each year the way a car may. In the world of real estate, most well-maintained properties can appreciate, or increase in value over time.
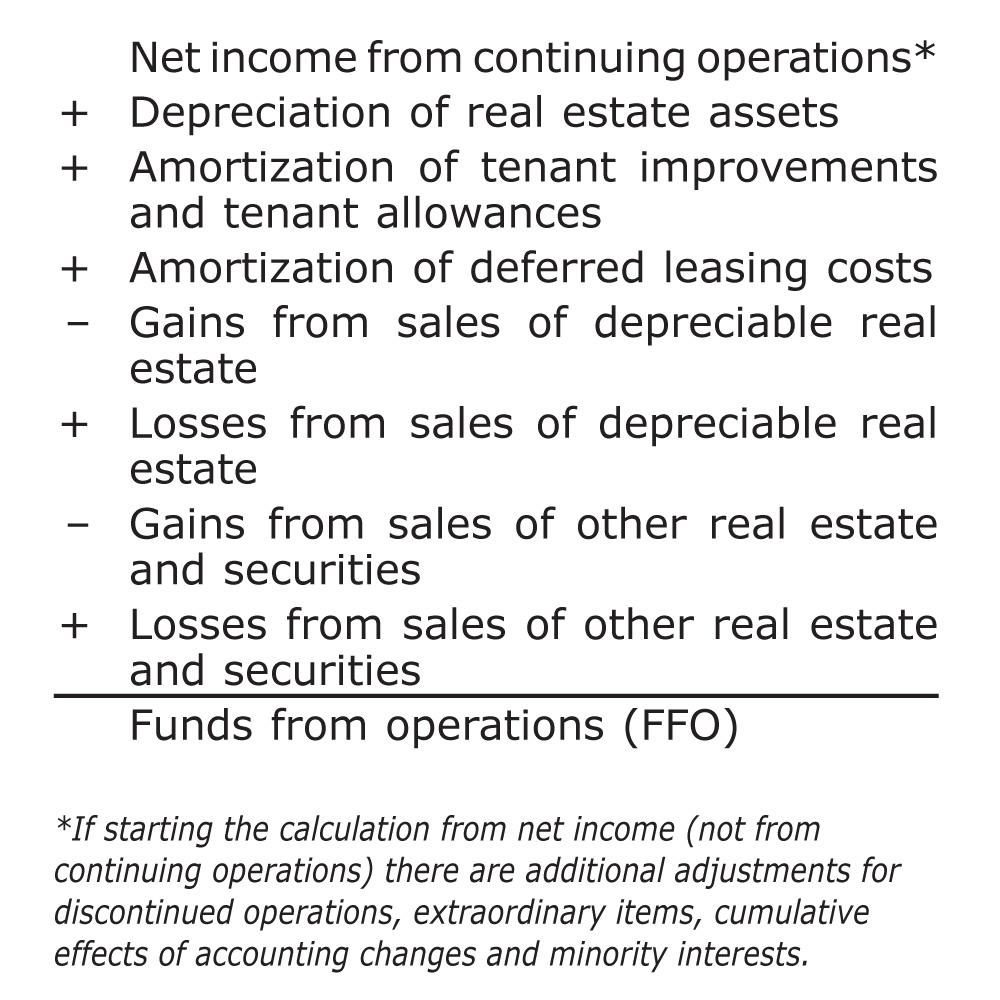
Funds from operations is more of a cash flow measure than an earnings measure. Cash flows into a REIT as the company generates revenue; cash flows out of a REIT as the company pays its operating expenses. The firm uses the leftover cash to make short-term and longer-term investments in itself. The cash that remains is available to pay out to the firm’s bondholders and shareholders. Noncash charges are added back to net income to arrive at funds from operations because noncash charges represent expenses that reduced reported net income but didn’t actually result in an outflow of cash.
Historically, FFO has been defined in different ways by different REITs. In April 2002, the National Association of Real Estate Investment Trusts (Nareit) refined its definition of FFO in an attempt to standardize the calculation. I recommend reading Nareit’s “White Paper on Funds From Operations” (April 2002) to get a better idea of what is included/excluded from FFO [linked in the online version of this article]. According to Nareit, FFO is net income (computed in accordance with generally accepted accounting principles), excluding gains (or losses) from sales of property, plus depreciation and amortization, and after adjustments for unconsolidated partnerships and joint ventures, cumulative effects of changes in accounting principles and discontinued operations. Figure 2 shows Nareit’s calculation for funds from operations.
Although there have been moves to standardize the calculation, it remains company-specific. To some extent this makes sense, as some companies may have to adjust for certain noncash items that another may not be subject to, such as foreign currency fluctuations.
Some REITs also produce a “normalized FFO” calculation, which adjusts for one-time tax benefits or losses, merger-related expenses, natural disaster expenses, change in fair value of financial instruments or other one-time items.
Using funds from operations is not without its flaws. Adding depreciation back can provide a distorted and overly optimistic picture in some cases because a property may actually depreciate over time. Additionally, some general maintenance items like replacing carpeting might not be expensed for accounting purposes. Instead, these expenses may be capitalized and depreciated over their useful lives. But because some of these items are actual expenses, when depreciation is added back to arrive at funds from operations, the FFO may be artificially inflated.
The funds from operations figure also doesn’t usually account for the capitalization and amortization of leasing commissions. However, leasing commissions actually represent an operating expense for many real estate properties.
Overall the general purpose of funds from operations is to add back the noncash expenses and subtract the one-time, non-recurring, noncash revenues from net income. An important consideration for FFO is that it is not a standardized calculation and thus can be difficult to compare between REITs.
According to the book “Investing in REITs” by Ralph L. Block (Bloomberg Press, 2011), most of the major Wall Street brokerage firms voted in 2001 “to forecast quarterly and annual financial results for REITs on the basis of net income before extraordinary items and excluding gains and sales from property sales.” Since then, depreciation has not been filtered out of analysts’ consensus estimates as it is in funds from operations.
Table 1 shows the average equity sector FFO estimates for 2018 and 2019 (estimates provided by FactSet), along with estimated FFO growth from 2018 to 2019.
Table 1. Funds From Operations (FFO) Measures and Dividend Yield for Equity REIT Sectors
| Equity REIT Sectors |
Average Price/FFO Estimates |
Est FFO Growth 2018 to 2019 (%) |
FFO Payout (%) |
Dividend Yield (%) |
|
|---|---|---|---|---|---|
| 2018 | 2019 | ||||
| Office | 15.5 | 14.8 | 4.6 | 51.3 | 4.4 |
| Industrial | 19.6 | 18.4 | 6.5 | 62.4 | 3.3 |
| Retail | |||||
| Shopping Centers | 12.1 | 11.7 | 3.2 | 67.5 | 7.7 |
| Regional Malls | 9.7 | 9.4 | 2.1 | 52.6 | 8.9 |
| Free Standing | 15.1 | 14.3 | 5.5 | 84.3 | 5.1 |
| Residential | |||||
| Apartments | 17.6 | 15.4 | 14.4 | 69.9 | 4.6 |
| Manufactured Homes | 20.4 | 18.9 | 8.1 | 75.2 | 3.6 |
| Single Family Homes | 17.9 | 15.8 | 14.1 | 30.8 | 2.3 |
| Diversified | 13.4 | 12.1 | 9.2 | 82.3 | 6.7 |
| Lodging/Resorts | 10.0 | 9.7 | 3.7 | 67.5 | 5.7 |
| Health Care | 11.5 | 10.9 | 4.9 | 94.4 | 6.9 |
| Self Storage | 18.2 | 17.3 | 5.1 | 77.4 | 4.4 |
| Timber | 27.4 | 23.6 | 16.7 | — | 3.4 |
| Infrastructure | 15.0 | 14.2 | 5.4 | 66.0 | 4.6 |
| Data Centers | 17.4 | 15.7 | 11.3 | 69.3 | 3.6 |
| Specialty | 14.5 | 12.8 | 12.0 | 88.0 | 3.8 |
| Mortgage REIT Types | |||||
| Commercial Financing | 34.1 | 36.0 | 2.2 | 26.4 | 12.8 |
| Home Financing | 8.9 | 9.5 | -7.0 | — | 11.1 |
| Source: Nareit, REITWatch May 2018. Estimate data provided by FactSet. | |||||
Adjusted funds from operations (AFFO) is an extension of FFO and is intended to be a better representation of current economic income than funds from operations. AFFO is also known as cash available for distribution (CAD) or funds available for distribution (FAD). A close comparable in the common stock analysis world would be free cash flow. AFFO is a subjective figure that can be calculated many different ways, but the following are the main adjustments.
The AFFO calculation includes an adjustment for noncash rent, which is the difference between “straight-line” rent and the actual (cash) rent paid. Straight-line rent is an average of expected rent payments over the life of a tenant’s lease, including the assumption of increasing rental rates, discounts on rent, maintenance costs passed onto tenants and more. It is an accounting term used to ensure that a lease is charged the expense on an even periodic basis. The AFFO calculation subtracts the straight-line rent in excess of contractual rent (which is the rent cash flow actually received).
Another adjustment is that recurring maintenance-related capital expenditures as well as expenses related to leasing are added back to FFO for the AFFO because they represent necessary costs to maintain the value of the properties.
These adjustments fix two of the main issues of FFO mentioned.
Adjusted funds from operations is regarded as the most useful and accurate means for determining a REIT’s cash flow. Unfortunately, AFFO is not widely reported or standardized between different REITs, but you may see it referenced in a REIT’s annual report or filings, so it’s important to understand the basis of the calculation. Additionally, compared to FFO, AFFO relies more heavily on estimates and is considered more subjective.
If REITs didn’t have the ability to grow funds from operations, their shares would be viewed more like bonds instead of stocks, and they would be bought solely for their yield. Even today there are some REITs that trade more like bonds than stocks due to investor perception and lack of projected growth.
There are two main ways a REIT can grow cash flow: internally and externally. Internal growth includes rental revenue growth (through higher rents and occupancy rates), renovating current properties, tenant upgrades, sale and reinvestment. External growth is mainly achieved through acquisitions, development and expansion.
FFO (and AFFO) is best analyzed on a per-share basis. Growing FFO does the shareholder no good if the company is issuing too many new shares to expand externally. REITs are required to distribute 90% of their taxable net income to shareholders each year, which limits the availability of excess cash. That’s not to say the only means of raising capital is through the capital markets; REITs can also generate cash from the sale of existing assets, retaining residual cash after paying dividends and forming joint ventures. External growth through raising capital may not always be possible due to a lack of high-quality properties available or attractive development opportunities or an inability to raise equity or debt capital.
Internal growth—often considered “organic” growth—on the other hand, may be more easily controllable by management (subject to market conditions).
FFO and AFFO are often used as denominators in price multiples to compare different REITs to one another, similar to how the price-earnings (P/E) ratio is used for common stocks. The ratios show how much an investor is willing to pay for a given level of funds from operations or adjusted funds from operations.
An investor would compare these price multiples to the company’s historical average: If the price-to-FFO (P/FFO) ratio is below its historical average, the REIT may be undervalued compared to its historical price range. If it’s higher than its historical average, the REIT may be overvalued compared to its historical price range.
An investor can also compare a REIT’s P/FFO or price-to-AFFO (P/AFFO) ratio to its competitors or industry. The same underlying logic is used: If the P/FFO ratio is below its industry average, the REIT may be undervalued compared to its competitors or industry.
Without further qualifying undervaluation, an investor runs the risk of investing in a REIT that is undervalued for a reason—the market projects lack of growth, sustainability or competitive advantage. In other words, a low P/FFO or P/AFFO doesn’t necessarily signal that it’s time to buy.
REITs, much like common stock, can be put on a dividend spectrum. At one end is low or no dividend growth, with a high yield and high payout ratio. On the other end of the spectrum is high dividend growth, with a lower relative yield and a lower payout ratio. The strategic decision as to where along this dividend spectrum an investor looks for REITs will determine which fundamental qualities are sought. For example, if one is looking for income as opposed to long-term growth, a REIT with a higher yield and payout ratio may be acceptable.
The dividend yield is calculated by dividing a company’s annual indicated dividend by its stock price per share. Dividend yields can be viewed on an absolute basis or a relative basis. Analyzing a yield on an absolute basis requires specifying a precise yield, say 3% for example.
On a relative basis, a dividend yield can be compared to the market or industry median, as well as its own historical average. A current yield above its historical average signals undervaluation, while a current yield below its historical average signals overvaluation. If the yield is higher than its average, an investor is paying less for a given level of dividends. A higher-than-average yield can also signal higher risk, so it’s important to qualify the soundness of the dividend payment and financial stability of the REIT issuing the payment.
In the common stock world, dividends are sticky: Once a company begins paying a dividend, it will do everything it can to avoid decreasing or eliminating the payment because of the negative perception that accompanies such actions. In the REIT world, dividends are required. Financially sound REITs with strong growth will likely increase their dividend over time, which has historically led to outperformance and stronger total returns for investors. To increase a dividend over time, management must be confident of future cash flows (which is why AFFO is often analyzed along with potential dividend growth).
The payout ratio measures the percentage of a company’s earnings (or cash flow) it is paying out to shareholders in the form of dividends. It can be calculated as a percentage of earnings (similar to how it’s calculated for common stocks) by dividing annual indicated dividend per share by earnings per share. However, for REITs, it is often calculated with NOI, FFO or AFFO in the denominator as opposed to earnings since reported earnings (net income) are less meaningful for REITs, as explained earlier.
The lower the payout ratio, the more room the dividend has to grow and the more sustainable the dividend payment. A low payout ratio is a form of insurance against unexpected events that might cause a temporary decline in FFO or AFFO. A high payout ratio (near or over 100%) is not sustainable over the long run. If a REIT pays out too much of its adjusted funds from operations in the form of dividends, investors will likely get concerned about a potential dividend cut and the REIT’s stock price may decline as investors’ perception of the dividend’s sustainability changes. Moody’s rating considers a REIT investment grade with an “Aa” rating if the REIT’s FFO payout ratio is below 50%.
A REIT’s payout ratio can be compared to its own historical average (the lower the current ratio compared to the historical average, the better) or to other REITs in its sector (the lower the better).
Due to the subjectivity of the FFO and AFFO calculations, using funds from operations or adjusted funds from operations as the denominator makes comparison between REITs more complicated.
A strong balance sheet enables a REIT to pursue ongoing business
expansion by raising new equity capital and additional debt. It also allows a REIT to maintain and grow dividends over time, as well as reinvest. Below are some ratios to consider. Higher leverage forces REITs to look to the capital markets to obtain financing, which they often have to do at the most disadvantageous time.
REITs don’t enjoy the same tax advantages from debt financing that public corporations do (interest expense is not tax deductible because REITs are generally exempt from taxation at the trust level as long as they distribute at least 90% of their income to their shareholders). Higher debt means higher interest expense and, depending on whether the debt is variable or fixed, higher debt could also mean that the REIT is significantly affected by changing interest rates. Since real estate investment is capital-intensive, and REITs have minimal cash retention capacity (because they must pay out most of their earnings). Liquidity and the company’s ability to service debt are of particular importance.
There are several different ratios used to analyze a REIT’s leverage. One of the most widely used debt ratios is debt to market capitalization, which is calculated as:
Total debt ÷ (Common stock equity + Preferred stock equity + Total debt)
The key is understanding how the ratio is calculated and making sure it’s calculated the same way for each REIT you’re comparing: Different firms may calculate debt ratios differently.
Nareit defines the denominator of the “debt ratio” as total capitalization—or the sum of implied market capitalization and total debt. Implied market capitalization is common shares outstanding multiplied by share price plus operating partnership units.
Another debt ratio is the debt-to-asset-value ratio, which is calculated by dividing total debt by total asset values (an estimate of the fair market values of a REIT’s properties). This ratio analyzes a REIT’s debt in relation to the book value of its assets, as opposed to the market value. This is a more conservative measure because using market values takes a REIT’s market price per share into account, which at times may be overly inflated or deflated. On the other hand, book value may not be an accurate representation of a REIT’s assets because of depreciation.
Similar to stocks, there is no exact “desired” level of debt for a REIT to have, and different REIT sectors have different average levels of debt. Generally speaking, a debt ratio over 50% can be considered on the riskier side.
The debt-to-EBITDA ratio is an additional measure of leverage. Nareit calculates it as average total debt over the prior two quarters divided by the most recent quarter’s annualized EBITDA. Debt to EBITDA measures a REIT’s ability to pay off its debt using earnings before interest, taxes, depreciation and amortization. A declining debt-to-EBITDA ratio is better than an increasing one because it shows that a REIT is paying off its debt and/or growing earnings. Moody’s rating considers a REIT investment grade with an “Aa” rating if the REIT’s net debt divided by EBITDA is less than 3.5x (net debt is total debt minus cash and cash equivalents).
Investors may look to a REIT’s sector to determine what level of debt is “acceptable”—if cash flows are protected by longer-term leases and earnings have been more stable over time, a REIT may be able to sustain a higher level of debt.
The interest coverage ratio measures the amount by which all debt interest payments are covered by a REIT’s NOI or EBITDA. It is calculated by dividing NOI or EBITDA by interest expense. Recall that EBITDA includes non-operating income, while NOI doesn’t. The interest coverage ratio can be calculated both ways. Keep in mind that a REIT’s NOI and EBITDA will likely be higher during favorable economic or market conditions, which will push the interest coverage ratio higher (holding interest expense steady).
The higher the interest coverage ratio, the better. There is no specific level that is considered attractive or unattractive. However, below 1.0 means the REIT has taken on too much debt and interest expenses are too high in relation to current operating income. Generally, investors seek an interest coverage ratio of 2.0x or higher. Since interest expense is a major cost for REITs, being able to pay it is paramount to the long-term success of the company.
The fixed-charge ratio is a derivation of the interest coverage ratio. The ratio adds other fixed charges (before tax), usually dividend payment obligations on outstanding preferred stock and lease, to the numerator and the denominator in the interest coverage ratio. Moody’s rating considers a REIT investment grade with an “Aa” rating if the REIT’s fixed-charge coverage ratio is consistently over 4x.
Table 2 below shows the average debt ratio, average interest coverage ratio and fixed-charge coverage ratio for different equity REIT sectors.
Table 2. Summary of Financial Leverage by Property Sector for Fourth-Quarter 2017
| Sector | Number of Companies |
Debt Ratio (%) |
Interest Coverage (X) |
Fixed-Charge Coverage (X) |
|---|---|---|---|---|
| Office | 24 | 34.4 | 4.1 | 4.0 |
| Industrial | 12 | 22.4 | 8.3 | 7.3 |
| Retail | 33 | 35.0 | 4.3 | 4.0 |
| Shopping Centers | 18 | 37.2 | 4.2 | 3.7 |
| Regional Malls | 7 | 34.8 | 4.6 | 4.4 |
| Free Standing | 8 | 31.6 | 3.9 | 3.7 |
| Residential | 22 | 30.0 | 5.1 | 4.7 |
| Apartments | 15 | 28.6 | 5.8 | 5.4 |
| Manufactured Homes | 3 | 25.5 | 3.6 | 3.4 |
| Single Family Homes | 4 | 39.4 | 2.7 | 2.3 |
| Diversified | 18 | 42.8 | 2.5 | 2.2 |
| Lodging/Resorts | 20 | 34.1 | 4.5 | 4.0 |
| Health Care | 19 | 37.4 | 3.6 | 3.5 |
| Self Storage | 6 | 14.7 | 10.2 | 6.6 |
| Timber | 4 | 20.2 | 6.6 | 6.6 |
| Infrastructure | 7 | 28.3 | 3.6 | 3.3 |
| Data Centers | 5 | 23.8 | 4.8 | 4.4 |
| Specialty | 11 | 37.7 | 3.6 | 3.5 |
| Equity REITs | 181 | 31.7 | 4.3 | 4.0 |
| Commercial Financing | 17 | 68.9 | 1.9 | 1.8 |
| Home Financing | 24 | 86.1 | 2.4 | 2.3 |
| Mortgage REITs | 41 | 83.5 | 2.3 | 2.2 |
| Industry Totals | 222 | 42.2 | 3.8 | 3.5 |
| Source: Nareit, S&P Global Market Intelligence. | ||||
If a REIT has variable-rate debt, it means its interest payments will fluctuate with interest rates: As interest rates rise, so will interest payments, and vice versa. Interest expense is typically a large portion of a REIT’s total expenses. Since interest expense is included in net income (and net income is the starting point for FFO), higher interest expense would reduce net income and therefore reduce the starting point for the FFO calculation.
Some REITs use variable-rate debt to boost FFO when interest rates are low. Others argue that variable-rate debt is beneficial during weak economic times, as interest rates tend to rise and fall in line with the economic cycle.
Fixed-rate debt, on the other hand, allows a REIT to better predict future FFO growth without having to consider interest rate expectations.
Generally, variable-rate debt that is more than 10% to 15% of the REIT’s assets can be riskier.
Investors should also analyze a REIT’s maturity of debt. Shorter-term debt (which must be repaid within one to two years) can be riskier for a REIT: Should the REIT still need the capital and the loan comes due, if the lender is unwilling to “roll over” the loan or extend the length of the loan, the REIT may be forced to sell off assets, issue debt or equity, or even file for bankruptcy.
A firm’s debt maturity structure is a focus for credit rating agencies because the bunching of maturities can present liquidity challenges. If debt maturities are spread out over time, the firm will have more financial flexibility.
According to data from Nareit, equity REITs currently have a weighted average term to maturity of 74.8 months, or approximately 6.2 years. Moody’s rating methodology considers “Aa” rated REITs to have annual debt maturities less than 10% of total debt.
Growth in same-store sales: Same-store sales refers to sales from stores open for at least one year and excludes sales from stores that have closed or from new stores. Most REITs report same-store rental revenue increases and/or net operating income on a same-store basis. The higher the year-over-year growth, the better.
Vacancy and occupancy rates: The vacancy rate is the percentage of all available units in a rental property that are vacant or unoccupied at a particular time. The lower the vacancy rate, the better. The occupancy rate is the opposite of the vacancy rate. The higher the occupancy rate, the better.
Realized annual rent per available square foot (REVPAF): Realized annual rent per available square foot is computed by dividing annualized rental income, before late charges and administrative fees, by the total available rentable square feet for the period. The higher the better.
Rent growth and rent demand: In its quarterly earnings conference calls and annual 10-K filings, a REIT’s management team will often discuss rent growth and rent demand. An investor should look for favorable comments.
Liquidity: Similar to common stocks, a REIT that is less frequently traded can be riskier for the individual investor. Lower-volume REITs tend to be smaller and riskier, as well as potentially more difficult to buy or sell.
Earnings growth: While funds from operations is considered a good measure of a REIT’s profitability, earnings shouldn’t necessarily be ignored. An investor should look for stable and growing earnings over time.
Earnings surprises: Much like common stocks, REITs can beat or miss analyst consensus earnings estimates. Investors should look for a REIT that doesn’t continually miss analysts’ earnings estimates. As with common stocks, it’s important not to overly focus on earnings surprises (or misses) but instead analyze the overall trend of the company’s ability to keep up with growth estimates.
Equity issuance: Because REITs distribute most of their earnings, they are likely to finance additional real estate acquisitions through equity offerings (selling additional shares) or debt issuance. Equity issuance dilutes current owners’ value per share. However, equity issuance isn’t always bad: If the REIT productively uses the new funds, equity issuance could be beneficial.
ROE and ROIC: Return on equity (ROE) and return on invested capital (ROIC) are applicable profitability measures for REITs. For both measures, the higher the better. Both measures are best used by comparing REITs within the same sector.
Return on invested capital (ROIC) is a profitability measure that calculates the profit that a company generates from long-term sources of funding that have provided capital. Invested capital can be provided by both bondholders and shareholders. A company’s value is derived from expected future cash flows, so to generate these cash flows, it must have sources of capital, and capital is not costless. Value is created when a company can generate a return on cash flows that exceeds its cost of capital. Companies that can do this will see their future value increase as growth increases, while companies that can’t generate excess returns will destroy value as they grow. Subpar ROIC can suggest poor capital allocation or an inability by management to deploy capital effectively.
Return on equity (ROE) also measures value created by a company for its investors. It is calculated by dividing net income by shareholder’s equity. However, some analysts prefer ROIC to ROE because ROIC is unaffected by financial leverage and share buybacks. Additionally, ROE only considers equity, whereas ROIC considers both debt and equity investments. Companies with low levels of long-term debt will have an ROIC closer to its ROE.
This article gives a basic overview of some bottom-up considerations when analyzing REITs and shows how complicated REIT analysis can be. Most of the calculations are subject to the discretion of the investor or of management with no standardized correct method.
Analyzing REITs can be difficult because of the lack of publicly available data provided. While many websites allow users to search and track REITs, the websites lack data points like NOI, FFO and debt-to-market capitalization, which complicates analysis for investors. The box below gives sources of information when analyzing REITs.
REIT analysis can also heavily depend on how a REIT is structured and what sector it operates in. Analysis will also depend on what type of REIT you’re looking for—a “growth” REIT versus a “value” REIT, etc.
While it is generally advantageous for REITs to be diversified, there has been research showing that specialized REITs may be a better bet. A REIT that focuses on a particular sector, strategy or geographic location becomes the expert in that market, giving it a competitive advantage.
With direct real estate, understanding the economics and demographics of a particular area can give you a leg up on your competition. That doesn’t mean you should avoid REITs that invest nationwide, but potentially consider whether the REIT expanded into new geographic areas just to take a shotgun approach, or if it conquered a particular area and strategically selected another market. Selecting specialized REITs is likely better for an investor willing and able to do the research and one who intends to purchase several different REITs.
This article focused on bottom-up analysis, which leaves out the top-down approach of selecting REITs based on their sector and understanding economic components and how they affect REITs. The main economic value determinants that affect REIT sectors include: job creation, population growth, new space supply versus demand and retail sales growth.
Finding some of the metrics mentioned in this article is no easy feat. The following websites provide “traditional” data on REITs—financial statements or basic metrics like price, dividend yield, EBITDA, etc., but some also provide unique data points that may be useful to you.
To find the best in-depth analysis and financial statements on a particular REIT, your best bet is likely the company’s annual and quarterly filings.
Financial Planning

Portfolio Strategies

Getting Started