Related
Stock Strategies
Stock Buybacks: Misunderstood, Misanalyzed and Misdiagnosed

AAII Stock Ideas
Companies with excess cash can pay out dividends as well as repurchase outstanding shares that have been issued to the public. When a company reduces the number of outstanding shares, remaining shares gain a slightly larger proportional claim to the company and its profits. This allows earnings per share to expand more quickly than net income. A share buyback can also signal to the market that management thinks that the shares are attractively priced at current levels.
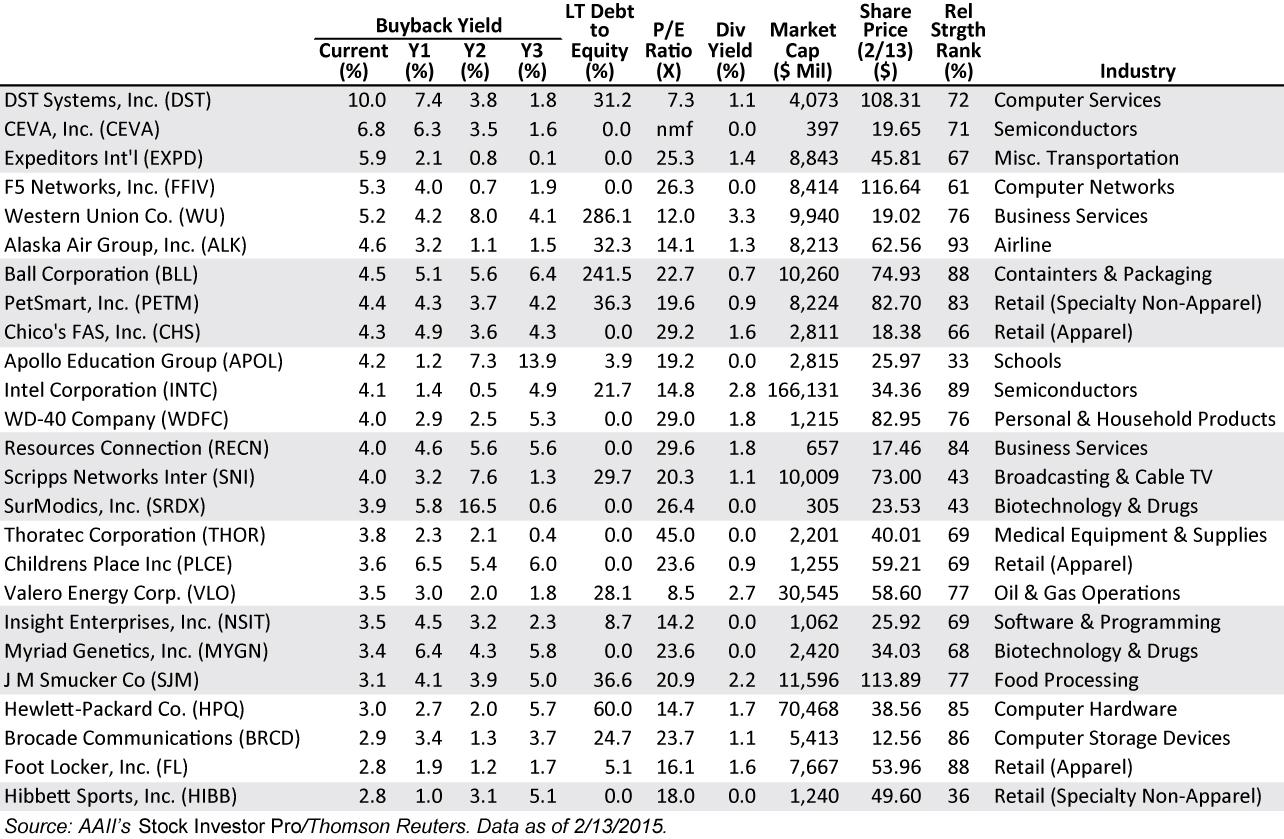
The easiest way to calculate the buyback yield is to look at the change in the average shares outstanding from one fiscal period to another. For example, DST Systems (DST) had 42.1 million shares outstanding during its 2013 fourth quarter, but it reduced the number of outstanding shares to 37.9 million by its 2014 fourth quarter. The 10.0% reduction in the number of shares is the buyback yield. A company that issues more shares will have a negative buyback yield.
James O’Shaughnessy, in the fourth edition of his book “What Works on Wall Street” (McGraw Hill, 2011), found that stocks with the highest buyback yield (top 10%) had an average annual compound rate of return of 13.7% from December 31, 1926, to the end of 2009 compared to a gain of 10.5% for the overall universe over the same time period. In contrast, portfolios made up of stocks with the lowest buyback yield had a compound annual return of just 5.9%, coupled with higher risk as well.
For our First Cut, we started with a universe of domestic exchange-listed companies. Financial sector companies were removed from the universe because their financial statements are not comparable with other firms. We then looked for companies with a positive current buyback yield as well as positive buyback yields over each of the last three years. To ensure financial strength, we eliminated firms with an increasing ratio of long-term debt to equity over the last two fiscal years. We also required positive free cash flow (cash from operations less capital expenditures and dividends) over each of the last three years. Finally, as a check for profitability, we required that firms have positive expected earnings estimates for the current and next fiscal year. The 25 stocks with the highest current buyback yield made our First Cut.
Criteria for Use With Stock Investor Pro
|
|
Field: | Operator: | Factor: | Compare to: |
|---|---|---|---|---|
| Exchange | Not Equal | Over the counter | ||
| And | ADR/ADS Stock | Is False | ||
| And | Country | Equals | United States | |
| And | Sector | Not Equal | Financial | |
| And | Buyback Yield | > | 2 | |
| And | Buyback Yield-Y1 | > | 0 | |
| And | Buyback Yield-Y2 | > | 0 | |
| And | Buyback Yield-Y3 | > | 0 | |
| And | Free cash flow/share 12m | > | 0 | |
| And | Free cash flow/share Y1 | > | 0 | |
| And | Free cash flow/share Y2 | > | 0 | |
| And | Free cash flow/share Y3 | > | 0 | |
| And | LT Debt/equity Q1 | <= | LT Debt/equity Y1 | |
| And | LT Debt/equity Y1 | <= | LT Debt/equity Y2 | |
| And | LT Debt/equity Y2 | <= | LT Debt/equity Y3 | |
| And | EPS Est Y0 | >= | 0 | |
| And | EPS Est Y1 | >= | 0 |
—John Bajkowski, President, AAII
Stock Strategies
AAII Stock Ideas