Related

Investing Gurus
“My inclination to buy out-of-favor stocks comes naturally, but by itself doesn’t account for beating the market. Success also required lots of perseverance. You have to be willing to hang in when the prevailing wisdom says you’re wrong. That’s not instinctive; more often than not, it goes against instinct.”
—John Neff
While serving as portfolio manager of the Vanguard Windsor fund from 1964 until his retirement in 1995, John Neff employed a value investing approach using a stringent contrarian viewpoint.
He looked for undervalued, out-of-favor stocks in the bargain basement.
Contrarian investing is a type of value investing, but the two are not interchangeable. Contrarians think independently, as opposed to going along with or directly against the crowd. Value investors seek to purchase stocks below their intrinsic values; the goal is to profit from the market underpricing securities. Value investing is generally associated with selecting a group of stocks with low relative valuation multiples. This could be price-to-book ratios, price-earnings ratios or price-to-sales ratios. Dividend yields also fall into this category, though with high relative yields signaling low valuations. It just so happens that many of the stocks with low relative valuations tend to also be the out-of-favor, beaten-up stocks that contrarian investors seek. While Neff is called a contrarian, he prefers the label “low price-earnings investor.”
In his book, “John Neff on Investing,” (John Wiley & Sons, 1999) Neff explained his investment style while managing the Vanguard Windsor fund:
During his 30-plus years at the helm of the fund, Neff delivered an annual average return that exceeded the rate of return of the S&P 500 index by more than 3%. Neff sought out good companies with solid market positions and evidence of room to grow. As long as the companies remained sound, strategic plans were in place, and sufficient resources existed to weather difficult conditions, Neff counted on these picks to work their way back to center stage.
Neff’s analysis started with stocks that have low price-earnings ratios. He claimed the low P/E approach provides two things: excellent upside participation and good protection on the downside. The price-earnings ratio is calculated by dividing a stock’s price by its earnings over the last 12 months. There are different measures of P/E using earnings over different time periods—including estimated earnings—but the most commonly used calculation is based on trailing 12-month (TTM) earnings. A P/E ratio of 10 means that the stock price represents 10 times earnings per share. The lower the P/E ratio, the lower the price is in relation to earnings. Price-earnings ratios incorporate expectations of earnings growth, including the likelihood of growth, through changes in the numerator of the ratio (price), even if the calculation uses historical earnings figures.
Neff explained that companies with the best prospects, fastest growth rates and most exciting concepts often trade high price-earnings ratios, high price-to-book-value (P/B) ratios and/or have low or no dividend yields. Conversely, stocks with poor outlooks and greater uncertainty often trade at low levels of earnings, cash flow or book value and usually have higher dividend yields.
Yet, undervalued, low-prospect stocks tend to outperform the market following an earnings report that beats analyst expectations (a positive earnings surprise), while overvalued high-growth stocks tend to underperform the market after a positive earnings surprise.
Why? Since analysts and investors believe they can effectively judge which stocks will be the real market winners, a positive surprise does little more than confirm their expectations about those stocks. The top companies should have rapidly growing revenues and earnings. However, when these companies fail to beat expectations, it causes a significant change in perception and sends the stock’s price down—along with investors’ confidence. Even when the bad news proves to be not nearly as severe as originally anticipated, the memory of the unpleasant experience lingers.
On the other hand, investors have low expectations for what they consider lackluster stocks (the low-valuation group), so when these stocks miss earnings estimates, it hardly turns heads. When such companies beat earnings expectations, people begin a process of perceptual change. These stocks are re-evaluated in a positive manner, leading to their outperformance of the market, particularly because of their original undervaluation. The key to how a stock price reacts to earnings lies in the market’s perception. When this perception adjusts positively, history has shown that undervalued stocks reap the most benefits. When the perception adjusts negatively, highly valued growth stocks underperform. Earnings surprises consistently result in above-average performance for out-of-favor stocks and below-average performance for favored stocks. This is an important aspect of Neff’s approach and his reasoning why out-of-favor stocks have high potential upside.
Neff’s goal was to distinguish misunderstood and overlooked stocks selling at bargain prices from the many stocks with lackluster prospects. The distinction is important. Just because a stock has a lower price-earnings ratio than another stock, it doesn’t mean the company is a “bargain.” There are many low P/E stocks that deserve their low valuation because of poor growth prospects, high uncertainty, lackluster performance or other company-specific risks.
Neff sought out stocks with price-earnings ratios 40% to 60% below the market. He noted that these stocks often lack stunning growth rates, but can “capture the wonders of P/E expansion with less risk than skittish growth stocks.” Instead of price merely adjusting with earnings, low P/E stocks can gain 50% to 100% because of the adjustment in expectations that often occurs.
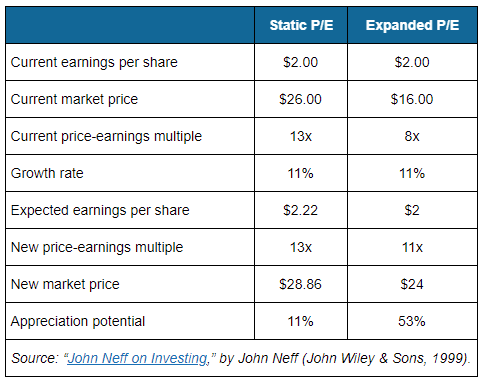
Table 1 replicates a table from Neff’s aforementioned book demonstrating the “extra gain” earned courtesy of P/E expansion. It shows two stocks with the same current and expected earnings per share but with different P/E multiples due to a difference in price. The “growth rate” of 11% in the table represents the earnings growth from $2.00 per share to $2.22 per share. The increase in the P/E ratio in the column labeled Expanded P/E goes from 8x to 11x—this was just a hypothetical scenario that Neff used. He said, “In Windsor’s neck of the woods, the prospects for increasing an out-of-favor company’s P/E ratio from, say, 8 to 11 times, always proved more promising than lining up in hopes of comparable percentage advances by companies that started with lofty P/E ratios.”
Earnings growth is ultimately what drives price-earnings ratios and stock prices. Analyzing historical earnings growth and earnings growth expectations helps distinguish between low P/E stocks trading at a bargain and those that are deserving of a low valuation.
In his book, Neff mentioned that low P/E stocks of companies growing faster than 7% a year tipped him off about underappreciated signs of life, particularly if accompanied by an attention-getting dividend.
Candidates for investment were required to show a sturdy earnings track record. Generally, Neff used an analysis period of five years, but this wasn’t a hard rule. An exception was made for cyclical companies that had peaks and troughs; in this case, Neff preferred persistent increments of quarterly earnings. (See the box below for more on Neff’s views on cyclical firms.) Looking ahead, he felt that promising investment candidates should show evidence of “reasonable and sustainable growth rates.”
Dealing With Cyclical Companies
Cyclical stocks normally comprised a third or more of the Vanguard Windsor Fund, which Neff managed. Neff said, “Whereas growth stocks are expected to increase earnings steadily, the trick with cyclical stocks is to catch them at just the right moment—after one economic cycle has decimated the stock price, but before improved earnings become apparent to everyone.”
Cyclical stocks operate in industries that are strongly impacted by the strength of the economy. When evaluating cyclical stocks, realize that earnings fluctuate under the best of company circumstances. As opposed to the five-year earnings growth rates that Neff traditionally used, for cyclical companies he used an estimate of “normal earnings.” For Neff, normal earnings merely represented a best estimate of earnings at a more fortuitous point in the business cycle.
Neff emphasized that a ceiling on price-earnings ratios for cyclical stocks limits the upside. For growth stocks, at least in theory, P/E ratios can expand as long as earnings keep rising, which is not the case with cyclicals. The market is forward looking; as a cyclical company’s earnings nears peak levels, the price-earnings ratio will begin to retreat as investors begin to expect a trough is on the horizon. Once a trough is reached, prices begin to strengthen as investors anticipate a turnaround in earnings. Investor expectations can lead a cyclical stock’s price-earnings ratio to be extremely inflated during a trough, as earnings fall to negative or very low territory. Remember, earnings are the denominator in the P/E ratio; if the denominator shrinks at a faster rate than the numerator, the overall ratio will rise. Nobody can predict when the peaks and troughs will occur, but Neff protected himself by purchasing cyclicals only with prospective price-earnings ratios that “scraped bottom.”
Historical or expected growth rates less than 6% or exceeding 20% seldom made the cut. Neff excluded companies with earnings growth over 20% because he found them to be too risky. Very high growth rates can be dangerous, he believed, because investors chasing them can push stock valuations too high, despite the fact that the high growth rate is unsustainable over the long term.
Value investors often count on receiving dividend payments while they wait for the market to readjust earnings expectations for their low P/E holdings.
The dividend yield is calculated by dividing a company’s annual indicated dividend per share by its stock price. If a stock’s price-earnings ratio is low, it is not unusual for the dividend yield to be high—allowing the investor to lock in a higher-than-average dividend yield.
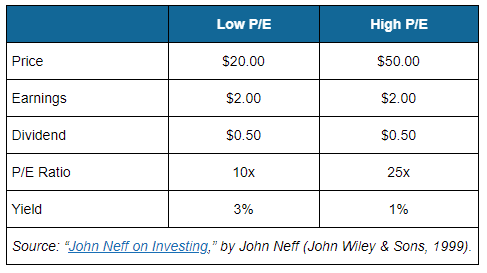
Table 2 is a copy of a table displayed in “John Neff on Investing.” The table illustrates the relationship between dividend yield and P/E often observed in the market: Low price-earnings ratios and higher yields normally go hand-in-hand. While price is the numerator of the P/E equation, price is the denominator of the dividend yield equation. As price declines, if the annual indicated dividend per share and earnings per share stay steady, the P/E ratio will decline, while the dividend yield will rise.
The dividend yield is often compared to the stock’s historical average to determine whether it is below or above its historical average. High relative dividend yields signal undervaluation (above the average), while low relative dividend yields signal overvaluation (below the average).
Dividends are sticky: Once a company begins paying a dividend, it will do everything it can to avoid decreasing or eliminating the payment because of the negative perception that accompanies such actions. Good companies are much more apt to increase their dividend over time as a signal to investors. The concept of increasing dividend payments ties back into Neff’s focus on earnings: If a company is not confident in its ability to grow earnings going forward, it will likely not raise its dividend payment.
Neff sought to avoid companies that have recently decreased their dividend, as they would likely not be part of the group of stocks that are misunderstood and undervalued by the market. Rather, they’re more likely to be deserving of a low valuation.
While dividend income is a plus, it wasn’t something Neff insisted on for every stock. For those securities that did pay dividends, Neff felt that dividend growth could be moderated for a year or two if a company found strategic capital opportunities more advantageous for investors than a larger dividend payment, but he generally looked for stable and increasing dividends. Overall, the Vanguard Windsor portfolio had roughly a 2% dividend yield. Neff explained, “Windsor outpaced the S&P 500 by [an average of] 3.15% a year while I was portfolio manager. Without roughly 2% a year that superior dividend return contributed, Windsor’s edge versus the S&P 500 would have slipped to around 1.15%.”
The dividend-adjusted price-earnings-to-earnings growth (PEG) ratio combines the P/E ratio, earnings growth forecasts and the dividend yield that we have discussed so far into one calculation. To Neff, the dividend-adjusted PEG ratio explained total return in relation to what he paid for a stock better than any other ratio. The dividend-adjusted PEG ratio is calculated by dividing the price-earnings ratio by the sum of estimated earnings growth and the dividend yield. A stock with a P/E ratio of 10, growing at 11% accompanied with a dividend yield of 2.0% has a dividend-adjusted PEG ratio of 0.77 [10 ÷ (11 + 2)].
If a company does not pay a dividend, its dividend-adjusted PEG ratio will match its “regular” PEG ratio. (The regular PEG ratio doesn’t add the dividend yield to the denominator of the equation.)
In the book, Neff stated that while managing the Vanguard Windsor fund he and his team looked for a stock’s dividend-adjusted PEG ratio to be half of the market average dividend-adjusted PEG ratio. Neff realized that this may be difficult to achieve depending on current market conditions; therefore, he was willing to accept a PEG of 1.4 or lower. The lower the PEG ratio, the lower the stock’s value in relation to its expected total return (lower is better).
Of the many figures on a company’s financial statements, sales is among the more difficult to manipulate. Ultimately, growing sales create growth in earnings. While short-term earnings can increase without sales rising, over the long term, a company will not be able to grow earnings without also growing sales.
Neff believed it is important to examine the relationship between sales in dollars and sales in units. He explained, “Earnings are measured in dollars, not in units. The link is important because of what it communicates about pricing. If the growth of dollar sales outpaces the unit sales, rising prices can help fuel momentum. Taken in tandem with overall rising sales, rising prices often flag an opportunity. Low P/E merchandise poised to capture price increases often pays a tidy return.”
He also mentioned that an investor should keep an eye on deliveries. If a company can’t deliver goods as fast as it can take orders, a backlog is created and it might suggest trouble. Alternatively, when demand exceeds supply, companies can sometimes raise prices. Neff reiterated that low P/E investors must discern whether earnings will return to normal and what sort of attention they will draw. The magnitude of the problem—or the opportunity—has a bearing on how long it will take for the price-earnings ratio to respond.
Investors must also determine what caused the backlog. Neff gave examples of possible causes: a shortage of raw materials, too few skilled workers or a technical glitch. He added that a shortage of raw materials or a technical glitch may lend themselves to quick remedies, but if a company is left needing substantial numbers of skilled workers, there’s no quick and easy way to fill that gap.
Determining the cause of backlog, issues with deliveries, or specifics regarding sales trends is no easy feat. However, investors could read companies’ earnings conference calls, as well as look through their 10-K annual reports for clues as to what is driving sales growth (or decline). While Neff mentioned analyzing backlog and deliveries, he did not identify specific ratios one should use. Some considerations may be days-sales-outstanding, inventory turnover or receivables turnover.
AAII Stock Screen on the Neff Approach
The John Neff approach has been translated into a stock screen that is tracked by AAII. At the Stock Screens area of AAII.com, you can see the criteria used and a list of stocks passing the criteria that is updated once a month. The Neff screen is also preprogrammed into AAII’s Stock Investor Pro fundamental stock screening and research database program.
For more on the AAII Stock Screens and the Neff screen, please visit www.aaii.com/stockideas.
Neff mentioned that, in an era of rising doubt about earnings calculations, cash flow has assumed increasing importance.
His reference to doubts about earnings calculations is tied to the creation of new measures of earnings and management’s ability to manipulate earnings easier than it can cash flow. These measures have encompassed earnings over and above the cost of capital, dilution of earnings per share resulting from generous stock options, and earnings before payment of interest on debt, taxes and depreciation. It is common to see “adjusted earnings” or “operating earnings” referenced in a company’s earnings release along with generally accepted accounting principles (GAAP) earnings. Adjusted earnings ignore “extraordinary” items and other small items that hide in the footnotes of a company’s financial statements.
Cash, on the other hand, is not easily manipulated by management and can give investors a better idea of how a company is managing its assets and spending its money. Neff defined cash flow as retained earnings (retained earnings are net profits not distributed through dividends or other means) plus depreciation. While Neff used the term “cash flow” this calculation is a proxy for free cash flow.
Neff compared cash flow to a company’s working capital and capital expenditures. Working capital and capital expenditures help to measure how much cash a company will require to feed its capital requirements. Excess cash flow can provide capital for additional dividends, stock repurchases, acquisitions or reinvestment. Any shortfall in cash flow must be financed in some fashion, so to Neff, positive cash flow was a must.
In Neff’s words, “Return on equity (ROE) furnishes the best single yardstick of what management has accomplished with money that belongs to shareholders.” Companies with higher levels of ROE are more efficient at utilizing the balance sheet to realize profits. The three primary drivers of ROE are net profit margins, asset turnover and leverage, each of which can lead to a higher ROE. A rising ROE signals that the firm is earning more profits from its net assets relative to previous years. Generally speaking, a higher and rising ROE is a positive sign.
ROE is calculated by dividing net income by shareholder’s equity. Net income is for the full fiscal year (before dividends paid to common stockholders, but after dividends to preferred stock). Shareholder’s equity excludes preferred shares. Shareholder’s equity represents the net asset value of a company; it is the amount that would be returned to shareholders if all the company’s assets were liquidated and all the liabilities were paid.
Return on equity can significantly differ between industries, so it’s important to analyze a company’s ROE in relation to its industry or competitors. A firm generating a level of ROE in excess of industry norms may be more efficient at generating earnings than its peers. Although return on equity is a useful tool, it does not tell you what factors are helping or hurting the company’s performance. For more information on deconstructing the ROE formula to determine the drivers of return on equity, see “Breaking Down ROE Using the DuPont Formula” in the December 2012 AAII Journal.
While Neff discussed the importance of ROE, he didn’t state a specific threshold to seek.
When a company squeezes greater earnings from each dollar of sales, it’s referred to as margin improvement. Competitive advantages often manifest themselves through margin improvement (though not always). Neff analyzed two different margins: operating margin and pretax profit margin.
Operating income is the profit that is left over after deducting the cost of sales, operating expenses (such as costs of goods sold and wages) and depreciation from sales. Operating margin expresses operating income as a percentage of sales (operating income divided by sales).
Neff analyzed operating margins because they indicate a company’s earnings margin of error for unfortunate events. He gives the example, “if the operating margin is 20% and a bad turn of events knocks off 5%, a pretty good margin remains. Since the low P/E universe likely has many companies that have faced a bad turn of events, a robust operating margin supplies protection against negative surprises.”
The nature of an industry typically dictates the status quo for operating margins; some industries have naturally high margins (e.g., technology) while others have naturally low margins (such as grocery stores).
Neff also wrote about analyzing the pretax profit margin (pretax profit divided by sales). Pretax profit margin highlights the relationship between sales and all other costs (aside from taxes). The ratio reveals if costs related to and unrelated to sales are hindering the overall business prospects of a company. If a company is able to grow sales while reducing expenses, its pretax profit margin will improve. Higher is better; investors should look for an upward trend in the pretax profit margin. Much like the operating profit margin, this metric is typically compared to a company’s industry.
Neff sold stocks for two main reasons:
Before a stock was added to Vanguard Windsor, the appreciation potential and expected gain was calculated based on earnings expectations and estimated P/E expansion. A failure of fundamentals was typically determined by analyzing earnings estimates and five-year earnings growth rates. While Neff didn’t mention a specific decline in earnings growth that would prompt a sale, we know that he looked for historical and estimated earnings growth between 7% and 20% when initially qualifying stocks.
While Neff generally had a longer investment period (over five years) while managing Vanguard Windsor, he wasn’t afraid to take profits right away; some stocks were sold after a few short months. He cautioned investors about holding a stock too long and/or falling in love with a stock, advising, “When you feel like bragging about a stock, it’s probably time to sell.”
Neff urged investors to form a “curbstone opinion” of a prospective investment, by answering five questions:
While Neff recognized that diversification is an important part of portfolio management, he also cautioned that too much diversification can cripple performance. He said, “Why own, for instance, forest products companies if the market has embraced them and you can reap exceptional returns by selling them? Worse, some portfolio managers whose portfolios are underweighted in a hot sector chase high prices, just to secure sufficient representation.”
Neff believed that an investor shouldn’t have to choose between a top-down approach (starting with a macroeconomic focus then choosing stocks that would benefit) and a bottom-up approach (analyze fundamental metrics of individual companies). He approached stock-picking from both directions and attributes much of his success to identifying major inflection points. He said, “A wise investor studies the industry, its products, and its economic structure.”
Understanding and analyzing the methodologies and investment strategies of “gurus” can help individual investors determine their own personal investment strategy. Having a sound investment approach and discipline when it comes to selling are crucial aspects to investing when seeking long-term wealth.
The John Neff Approach in Brief
While serving as portfolio manager of the Vanguard Windsor fund from 1964 until his retirement in 1995, John Neff employed a value investing approach using a stringent contrarian viewpoint. Neff perennially found undervalued, out-of-favor stocks in the bargain basement. He sought out stocks with low relative price-earnings (P/E) ratios and, from that group, determined which may be undervalued by the market or out-of-favor. Neff’s goal was to distinguish misunderstood and overlooked stocks selling at bargain prices from the many stocks with lackluster prospects.
While not explicitly stated, Neff’s approach is generally geared toward exchange-traded stocks. No limitation on stock size.
Neff sold stocks for two main reasons: deterioration in the stock’s fundamentals or the stock’s price approached expectations. Before a stock was added to Vanguard Windsor, the appreciation potential and expected gain was calculated based on earnings expectations and estimated P/E expansion. A failure of fundamentals was typically determined by analyzing earnings estimates and five-year earnings growth rates. While Neff didn’t mention a specific decline in earnings growth that would prompt a sale, he looked for historical and estimated earnings growth between 7% and 20%.
While Neff generally had a longer investment period (over five years) while managing the Vanguard Windsor fund, he wasn’t afraid to take profits right away; some stocks were sold after a few short months. He cautioned investors about holding a stock too long and/or falling in love with a stock, advising, “When you feel like bragging about a stock, it’s probably time to sell.”
Investing Gurus

Financial Statements

Financial Statements