Related

Investment Newsletters
Article Highlights:
Editor’s Note: Mark Hulbert is the founder of the Hulbert Financial Digest and a senior columnist for MarketWatch. AAII president John Bajkowski and I spoke to Hulbert about the observations he’s made from tracking investing newsletters over the course of his career.
—Charles Rotblut, CFA
Charles Rotblut (CR): I don’t think we’ve ever discussed how you got started analyzing newsletter performance. Would you mind sharing your story?
Mark Hulbert (MH): Absolutely. It was 1979. I was right out of graduate school, and I attended the National Committee on Monetary Reform conference. It was probably the granddaddy of the investment conference world. Thousands of people would show up.
This was well before cell phones. At each pay phone booth, there would be lines of 10 or 20 attendees calling their broker after each speech. While every one of the speakers was very charismatic and made a compelling case for what they were recommending, they were contradicting each other. So, it amazed me that there were people willing to call their broker based on these untested and unverified claims.
I don’t think the idea for tracking newsletters is at all original with me. What I think was different was that I just happened to be in a place in my life where I could do something about it since I was just out of grad school and was doing a lot of freelance work.
John Bajkowski (JB): How did you get started with your newsletter?
MH: I knew a couple of people from grad school who were willing to put up some money for advertising and compensate me for doing the work. It involved looking up every price in The Wall Street Journal and going through copious dividend printouts that would come from S&P. It was just incredibly copious, labor-intensive work. It was more than a full-time job, but it hit a nerve.
Within a year, we were up to something like 5,000 subscribers. I was on the cover of Barron’s and got an invitation to be on Wall Street Week [Louis Rukeyser’s highly regarded TV show]. It was an incredible startup. I couldn’t have been more fortunate.
JB: Are there any newsletters you tracked back then that are still around today?
MH: Yes, there are a few. Among them is Value Line Investment Survey. It’s under different editorship, but the service is still very much around. John Buckingham’s The Prudent Speculator was edited at the time by Al Frank, as you know, but that newsletter is still around. [See Table 1 for a complete list.]
Table 1. Investment Newsletters With More Than 30 Years of Return History
| This small group of newsletters were in publication when Hulbert began tracking performance in 1980 and remained in constant publication as of January 2016 when the Hulbert Financial Digest ceased to be offered by MarketWatch. | |||
| Newsletter |
Annualized Return* (%) |
Risk** | Sharpe Ratio*** |
|---|---|---|---|
| The Prudent Speculator | 14.7 | 9.20 | 0.134 |
| NoLoad FundX | 12.0 | 4.51 | 0.152 |
| The Value Line Investment Survey | 11.9 | 4.32 | 0.155 |
| The Chartist | 10.1 | 5.13 | 0.111 |
| Dow Theory Forecasts | 9.9 | 3.89 | 0.128 |
| The Outlook | 8.0 | 3.55 | 0.096 |
| Doug Fabian’s Successful ETF Investing | 6.4 | 3.07 | 0.065 |
| The Value Line Special Situations Service | 5.9 | 7.48 | 0.052 |
| The Dines Letter | 4.2 | 8.47 | 0.039 |
| Wilshire 5000 Value Weighted Total Return Index | 11.0 | 4.43 | 0.137 |
|
*For the period June 30, 1980, through January 31, 2016. **Reflects the volatility of a newsletter’s performance, as measured by the standard deviation of its monthly returns. Higher numbers reflect greater volatility and risk. ***A measure of risk-adjusted performance. Higher numbers mean that the adviser did better in relation to the amount of risk they incurred. Source: Mark Hulbert. |
|||
JB: What are the big lessons you learned by tracking all of these newsletters and their recommendations over the years?
MH: The biggest one is that people don’t always tell the truth. We already know that, but the corollary of that insight is that people’s well-honed instincts, which detect outrageous advertising in almost every other aspect of life, somehow get suspended when it comes to money. If a used car salesman came up to somebody and said, “Here’s a car that’s only been driven to church on Sundays by a grandmother,” you’d laugh. The functional equivalent of that is being told that all the time in the investment arena, and people’s reaction is, “Where do I sign up?” The prospect of making money is so alluring that investors are willing to suspend all their rational faculties.
CR: I know you wrote about this a long time ago in the AAII Journal, but is there an upper limit on returns where you think people should be extremely skeptical?
MH: I’m not sure exactly where that is, but Warren Buffett’s return since 1964 is an upper limit of the best long-term return that you should hope for. He’s at the upper echelon of the distribution, so it’s most likely something that’s unattainable for us mere mortals. If that is the upper limit, it gives you an immediate reality check on the advertising claims you might see. [Editor’s note: Warren Buffett’s long-term annualized return is approximately 20%.]
CR: Any suggestions for those who are pitched to by someone who is charismatic or presents a strategy that sounds really appealing? Is it just having the discipline to hold onto your wallet tightly and walk away?
MH: My recommendation used to be that you run, not walk the other way. If somebody has so little faithfulness to the truth—and it’s insulting your intelligence to make claims that are wildly implausible—then why do you want them managing your money?
The other thing that is very interesting to discover is that the performance ratings that we calculated for newsletters were not correlated with the outrageousness of their advertising. So even some relatively good newsletters still had outrageous advertising.
I heard from one newsletter editor years ago, whose name will go unmentioned but had a rate of return that was in the high teens. It wasn’t just a one-year shot in the pan either. So you’d think that would be enough to satisfy any marketer who’s out trying to sign up subscribers. When he approached one of the top direct marketing firms, the firm’s principal told the editor that, unless he was willing to allow marketing to say that he was producing 40% more in annualized returns, the firm wouldn’t take him on as a client. In this case, the editor said, “Well, I’m not going to have you then as my direct marketer.”
I would have thought that a direct marketer who can’t make a high-teens annualized return over the longer term look very attractive wouldn’t be a very good marketer. The truth should suffice. Evidently, we’re in a world where the truth doesn’t always suffice. In one sense, I have sympathy for the marketing expert because everyone else is exaggerating too. It’s going to be very difficult to distinguish yourself with a truthful claim about having returns in the high teens when everyone else is bragging about returns that are orders of magnitude greater.
JB: One of the things you did was to track model portfolios based on how a subscriber would be able to build a portfolio from the information presented. Did you find anything as far as the ability for winners to repeat over time or losers to repeat over time that would be helpful for individual investors?
MH: The depressing thing was to discover how little persistence there was between the past and the future. I’m not of the opinion that everything is random, but it’s a lot closer to that and uncomfortably closer than we’d like to think. If somebody wanted to look at my data and conclude that everyone should just go with an index fund, that would not be an unfounded conclusion. But I don’t think it’s the only conclusion one could draw.
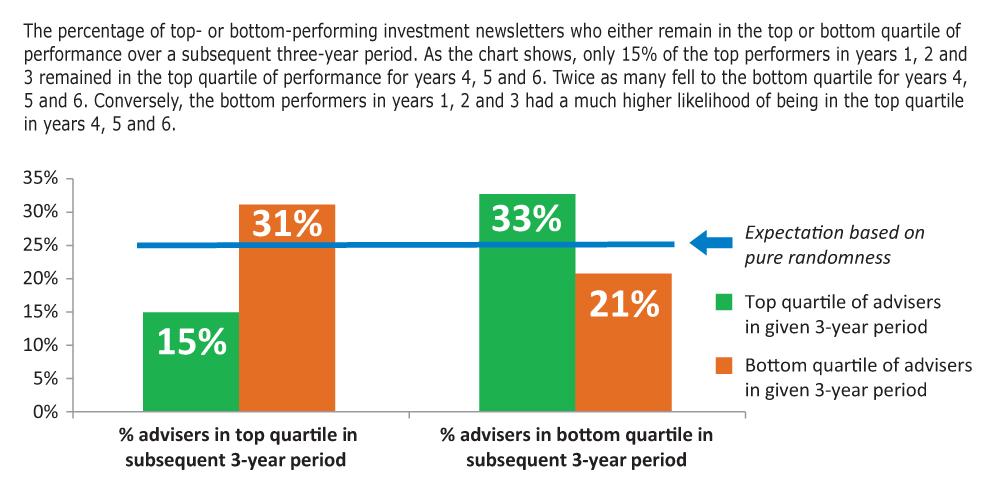
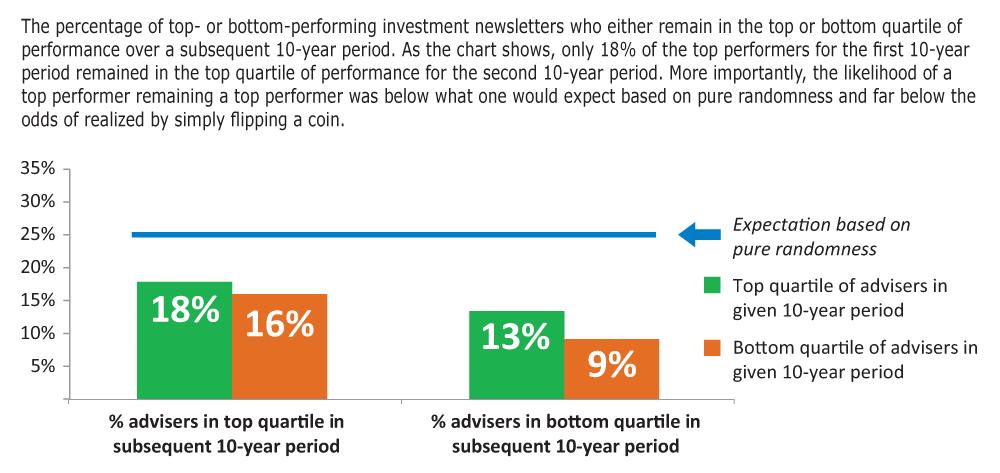
The overwhelming realization is that even among the top performers over one period, only a small fraction of them beat the market in the subsequent period. [See Figures 1 and 2 for examples.] One example I like to use in my talks is based on the widely accepted notion that maybe 20% of mutual funds will beat the market over a five- or 10-year period. If you had some system that would double that proportion from 20% to 40%, which statistically would be a huge feat, your odds of picking one of the outperforming newsletters would still be below 50/50. In other words, you’d still have a greater-than-even chance—by going with the top performer—of not beating the market even with the increased odds.
I think that something similar to that may apply here; the persistence is just not there. We would like to hope that it would be, but it’s just not there.
JB: How about on the negative performance side? Do you see any repeatability there?
MH: To the extent that there is persistence in the data, it’s dominated by correlations at the bottom of the rankings. If you are a terrible performer, you have an above-average chance of being a terrible performer in a subsequent period.
I think another way of putting that conclusion is that maybe the greatest benefit I’ve had over several decades of being in this business was to help investors avoid the worst performers. I think it increased their odds of not losing a lot of money. Now, would it mean that they would make as much money as they would have by investing in index funds? Probably not. But not losing a lot of money is, in itself, something to be somewhat pleased about.
CR: All newsletters will underperform over short periods of time, but there are some that will end up doing well over longer periods of time. So, if somebody’s following a strategy that maybe has had good long-term past performance and now is underperforming, how long should they stick with it? Alternatively, at what point do they throw in the towel and switch to something else?
MH: One of the most frustrating things for subscribers is that I will often show charts of underperformance over what seems to be an excruciatingly long period of time and then ask whether that period of underperformance is sufficiently long or extreme enough to justify that the strategy or the editor has lost its touch. The answer is, in most cases, no.
One example is momentum, which is one of the most documented and well-recognized anomalies to the efficient market hypothesis. It favors the stocks that have beaten the market over the trailing 12 months and avoids those stocks that have performed the worst. A portfolio that goes long on high-momentum stocks and shorts low-momentum stocks has not made much money for 10 years now. Is that enough to say, “Well, maybe momentum doesn’t work anymore”? It’s possible that momentum doesn’t work anymore, but there are some very simple statistical tests you can apply to the sample and ask yourself, “Is the last 10 years sufficiently different as to the characteristics of the sample than what the sample looked like over the previous 80 or 90 years for which data existed?” The answer is no. Given the variability in the data, you cannot conclude that.
What I tell subscribers is that it may be that they’d be justified in getting rid of momentum, but they can’t base the decision on statistics. They have to base it on something else.
Another way of putting that is, if they want to be a data-driven investor, they have two choices. One is to go with an index fund, because the hurdle over which they have to jump before they make any decisions on an active manager is so high that they can’t jump over it. Alternatively, they would have to be willing to stick with a strategy, even one that’s losing, for probably more years than they have the patience to do so.
CR: What about on the strategy side? Money managers always face the challenge of balancing what they know will work over the long term with doing what will keep their clients happy. Among the newsletters that have been around for a long time, have you seen them being willing to stick with their strategies when they are out of favor, or have these newsletters been more likely to start changing their strategies when they underperform?
MH: The former of those two choices. In general, I’ve been impressed that the long-running newsletters have been willing to stick with their approach, even when it hasn’t been working. I think that is one of the reasons that they have been good long-term performers.
This allows me to go back to add an additional thought to one of my earlier answers, which was that I said that there are other possible conclusions one could draw from the data other than to just put all of your money into index funds. One of the other conclusions is that, regardless of whether you’re in an index fund or following an active manager, the crucial question is what’s going to keep your nose to the grindstone through thick and thin?
So really, the issue isn’t index fund versus active manager, it is: “What can you live with through thick and thin?” That’s where some of these advisers really distinguish themselves. They—either through force of personality, an ability to describe what they’re doing in compelling ways, or a combination of those factors—keep their clients willing to stick with a strategy even when it’s not working. I think that really is, in fact, an underappreciated virtue in the investment arena.
Many people are data driven, but they also have to be committed. And unfortunately, being data driven alone does not provide sufficient commitment to stick with it when the data don’t look very good. You have to marry both the psychological aspect and the data to have good, long-term performance. That’s what the best long-term performers have done.
JB: In terms of being a data-driven investor, you observed that much of beating the market is just due to luck and very often our emotions are our worst enemy. Are there any lessons here? Anything you could point out that would be helpful for individuals?
MH: Both of those factors together are really a terrible one-two punch. I would say over the short term, most of it is luck. Hopefully, over the long term, the luck cancels itself out—
because luck is not all good or all bad. If luck dominates the short- or even the intermediate-term, which I think it does, our emotions are an overlay on top of that, which makes it even worse.
One of the really telling factoids that I like to talk about with clients is the famous study by business school professors Brad Barber and Terrance Odean, where they looked at more than 66,000 individual accounts at a discount brokerage firm. Every time a stock was sold, they looked to see if another stock was bought within 30 days. So, they made the assumption that the one that was being bought was a replacement for the one being sold. Why would you have sold one and bought the other if you didn’t think the one you bought was going to do better? It turned out that on average, even before transaction costs, over the next year the stocks that were bought returned more than 3% less than the stocks that were sold. The investors would have done a lot better if they hadn’t sold, just stuck to whatever they were holding.
Why would we systematically always be buying what we should be selling and selling what we should be buying? The answer is our emotions. So really, it’s a combination of randomness or luck on the one hand and our emotions, our self-destructive emotions, on the other. And boy, you put those two together, and it’s a miracle anyone ever beats the market over the long term.
CR: Are there any insights that you’ve gained from having tracked the sentiment of newsletters?
MH: Tracking sentiment is one of the things that we continue to do, even after our newsletter was shut down a couple of years ago. We find that it has some very interesting properties. If our sentiment leads us to do the wrong things, and if you look at the consensus of a group of advisers, you ought to find yourself being a contrarian and doing the opposite of what the consensus is doing.
What we do, which is slightly different than other sentiment surveys, is look at the average exposure to the market among the market timers we track. We update it daily. We track maybe five or six dozen market timers. At the end of every day we know whether they are 100% invested or 50% invested or 50% short. We simply average all of those numbers at the end of the day.
We look at the top decile and the bottom decile of sentiment readings over the last several decades to see how the market’s done over the subsequent week, month, quarter, six-month periods and so forth.
As you’d expect, the market does significantly better after the lowest sentiment readings. In other words, when the advisers, on balance, are most bearish, the market does significantly better than when they are most bullish. The spread between the top and bottom is even greater in those areas of the market where you’d expect sentiment to have an outsize influence.
For example, if you look at junior gold mining stocks [smaller exploration companies] relative to senior gold mining stocks [larger companies with established positions], you’d expect the juniors to be more sensitive to swings in sentiment. And, sure enough, the swings are greater.
So, it follows along with what the theory would suggest. I think one of the more exciting areas of research in the market over the last five to 10 years has been in the role of sentiment. It’s being increasingly recognized in academic circles as a valuable factor. It’s not the only factor to look at, of course, but it’s a nice confirmation of the fact that our emotions are self-destructive. These are advisers who are, presumably, professionals, and well regarded in the industry. Even then, they are unable to, on balance, get out of their own way— in other words, not be wrong on average.
CR: You’re looking at their holdings and not what they’re saying, correct?
MH: Correct.
JB: How has your perspective on the market and investing changed over the course of your career?
MH: I’d say I’ve gotten a greater appreciation for how much uncertainty and risk there is in everything we do. I think it’s a tendency of a young man’s mind to think we know more than we really do, and to be impressed by statistical analysis that looks valid and say, “Oh, well that must be worth investing in.”
The last four decades have humbled me over and over again; there’s so much uncertainty out there that we don’t even know. I’ll recite the famous quote from Donald Rumsfeld, “There are known unknowns, and then there are the unknown unknowns.” That latter category is far greater and more significant than we could possibly know, because they’re unknown.
We’ve been telling ourselves over the years that if you’re willing to hold long enough, the volatility or the range of possible returns goes down. So, we think, “As long as we’re willing to hold for long enough, everything will turn out all right.” I’m not convinced now that it necessarily will turn out all right. It just happens to be that we come out of a 200-year period in which things did turn out. But it was not preordained that we were going to win two world wars, win the Cold War, and all the things that have worked in the favor of the U.S. over the last 200 years. In order for the next 200 years to be as good as the last 200, there would have to be all those things of equal geopolitical significance falling our way without us knowing about them in advance.
So, this notion of, well, as long as we hold on long enough, things will turn out, I think may be somewhat dangerous. We may be lulling ourselves into a dangerous complacency with that. I don’t know necessarily what the investment implication of it is, other than to say we may want to reduce our equity exposure relative to that level of risk. All the asset allocation models that come up with the ideal allocation, given your risk tolerance, are based on historical volatilities. If the future volatility turns out to be greater than what we’ve seen over the last 200 years, then we have the wrong inputs into that model.
CR: You’ve written several times about doing less instead of more. So how does somebody square that with what you’re saying now?
MH: The distinction I find helpful, is between, on the one hand, how much we invest in equities in the first place and, on the other hand, what we do with the amount that gets allocated to equities. My point about risk being greater over the long term than conventionally assumed relates to the first half of this distinction, while the idea that doing less is better than doing more relates to the second.
Investment Newsletters
Investment Newsletters
Investment Newsletters