Related

Portfolio Strategies
Retirees are commonly told they can safely withdraw 4% of their savings, adjusted for inflation, without running out of money.
Often this advice is presented with return data based on stock and bond market indexes. What is sometimes lacking, however, is an example of implementing the withdrawal strategy with a real-world portfolio.
Since I created a hypothetical portfolio for analyzing the effect of rebalancing (discussed in the article “Portfolio Rebalancing: Observations from 25 Years of Data,” April 2013 AAII Journal), I have the data to walk through the process and show where potential pitfalls may lie. The portfolios use actual funds that were available to investors over the time period studied, so the results presented should be close to what an investor could have actually realized on a pretax basis during the past 25 years. In other words, rather than relying on theory, these portfolios provide close to a real-world example.
Though I used mutual funds for my analysis, exchange-traded funds (ETFs) could be directly substituted without any significant changes. Investors holding individual stocks and bonds should group their holdings by asset class to follow the examples provided.
One change I made from the example shown in my April article was to incorporate an accelerating withdrawal rate. Each year, I increased the percentage withdrawn by the reported Consumer Price Index (CPI) for the year as an inflation adjustment. Factoring in inflation raised the annual withdrawal rate from 4.00% of the portfolio’s value at the end of 1988 to 7.65% of the portfolio’s value at the end of 2012. The inflation escalator was included since retirees will need to increase the amount of their portfolio withdrawals to cover rising expenses.
The good news is that a person who retired at age 65 in 1988 and turned 90 in 2012 would not have incurred longevity risk—the risk of outliving one’s savings—by adhering to the 4% withdrawal rate over that time period. This was the case even though AAII’s moderate portfolio allocation model, which uses a 70% allocation to stocks, was followed. The bad news is that the dollar size of the annual withdrawals did not increase every year and, if rebalancing is not employed, the allocation shifts to nearly 90% domestic stocks after 25 years.
The 4% rule recommends investors base their retirement withdrawal rates on the value of their portfolio at the start of retirement. In the analysis used for this article, the starting portfolio value is $100,000. I chose this number for its ease of calculation and analysis. It can easily be scaled upward or downward. Plus, any cumulative dollar changes can be quickly estimated through simple multiplication. (A $1 million portfolio would have had dollar amounts that were 10 times larger than the amounts shown in this article.)
The second part of the 4% rule advises increasing the withdrawal rate in accordance with the rate of inflation. For example, if the economy experiences 2% inflation during an investor’s second year of retirement (assuming withdrawals are made at year-end), he would increase his withdrawal rate by 2%. The mathematical formula is: Current withdrawal rate × (1 + rate of inflation). Using the 2% example, the equation would be: 0.04 × (1 + 0.02) = 0.0408, or 4.08%.
Therefore, in the second year of retirement, the investor will withdraw 4.08% of his existing savings. The withdrawal percentage for the third year of retirement would be based on the second year’s higher withdrawal rate. Assuming inflation stays at 2% and using the formula in the paragraph above, the withdrawal rate in the third year would increase to 4.16%. The math is: 0.0408 × (1 + 0.02) = 0.0416, or 4.16%. In each subsequent year through the remainder of his life, the investor would continue to adjust the withdrawal rate upward using the same methodology.
Of course, we know that the rate of inflation never stays constant from year to year. Updated, and historical, information can be found for free at Econstats.com. This website is one of our favorites for economic statistics and contains a wealth of downloadable data. I specifically used the seasonally adjusted Consumer Price Index for all urban consumers (CPI-U). This data is located at www.econstats.com/bls/blsnea8.htm.
There are various measures of inflation and no single gauge precisely measures the impact of overall inflation on a consumer’s expenses. But the CPI-U is a close overall measure and should serve as a useful basis for determining how much to increase your withdrawal rate. I would advise against using a “chained” inflation indicator, since it assumes consumers will change their preferences if the cost of one product becomes too high. While some goods and services can be easily swapped if prices rise too much (e.g., changing from brand name paper towels to store-brand towels), others cannot, particularly certain medications. I would also suggest caution before using a higher-than-reported rate of inflation since it can lead to a higher-than-sustainable rate of portfolio withdrawals. The bigger the assumed inflation rate in one year, the larger all withdrawals made in future years will be.
As previously noted, I used AAII’s moderate portfolio allocation model as the basis for the analysis. This model is one of three we track on our website at www.aaii.com/asset-allocation. The moderate asset allocation model uses a 70% allocation to domestic and international stocks and a 30% allocation to bonds.
I purposely chose to stick with this model instead of the conservative asset allocation model, which has a 50% allocation to stocks and 50% allocation to bonds, because of the large drop in bond yields that has occurred over the studied time period. Though investors should shift to a more conservative allocation in retirement than they followed in their working years, the performance of bond funds over the past 25 years will not be repeated over the next 25 years. Given the high level of uncertainty over bond yields, I decided to purposely limit their portfolio weighting.
The challenge with making annual withdrawals is to not disrupt overall portfolio allocations. Some investors choose to do this by taking portfolio income first and then supplementing from principal. Since both income and capital gains contribute to a portfolio’s total return, I chose to focus on the entire portfolio’s balance to fund withdrawals instead. I also assumed that all withdrawals occurred at the end of each calendar year. The simplicity of this approach lends itself well to spreadsheet modeling. It also makes determining the total amount that can be withdrawn easier.
In a real-world scenario, taxes are a consideration. A large withdrawal from a traditional individual retirement account (IRA) could require the payment of estimated taxes in the quarter the funds are withdrawn. Spreading the account withdrawals over the course of the year would lessen the tax impact in any single quarter, though your overall annual tax bill would not change. A compromise would be to withdraw the funds from the stock and bond accounts, but allocate those dollars to a money market fund within the IRA. Then, money could be withdrawn as needed (e.g., on a monthly basis). This way, the withdrawal amount for the calendar year would not be at risk of market fluctuations. Plus, if you do not need to use the entire withdrawal, either because your income needs are met or because you are able to meet your required minimum withdrawal without taking the full withdrawal, you could apply the remaining balance to the following year’s withdrawal amount. (For example, if you have $1,000 left over in year 10 of retirement, the amount withdrawn from the portfolio in year 11 would be reduced by that $1,000 balance.)
I should point out that there are instances when taking interest and portfolio income first makes sense. This would particularly be the case if you hold actual bonds instead of a bond fund, since taking interest income first would be preferable to selling the bonds. If you hold annuities, only take the income since the exit penalties for early withdrawals can be steep. Those of you holding bond funds instead of bonds should be aware that taking interest income first to fund withdrawals may require a greater attention to fluctuations in portfolio allocations, however. The last statement would apply to dividend-paying common and preferred stocks and stock funds, as well.
As far as how much to withdraw from each specific fund, I ran the numbers assuming withdrawals were spread evenly across all funds (the “non-pro rata” method) and assuming withdrawals were weighted by target allocation percentages (the “pro rata” method).
The non-pro rata methodology evenly divided withdrawals across all funds held by portfolio. Since the portfolio initially held four funds, I simply divided the annual withdrawal rate by four. For example, say during the first year of retirement, the investor wanted to withdraw 4% from a $100,000 portfolio holding four funds. The calculation would be $100,000 × (0.04 ÷ 4). The math equates to $1,000 being withdrawn from each fund. I chose this method for its simplicity. (The tables presented here assume the first withdrawal was made at the end of 1988 and factor in that year’s return.)
An investor willing to do a little extra math could use the pro rata method instead. This method weights the withdrawal by the targeted allocation percentage. (If you hold more the one fund for a given asset class, group them together for purposes of calculating the asset class withdrawal amount.) For example, our model recommends a 30% weighting to bonds. Each year of retirement, the retiree would use the bond fund as the source for 30% of his overall withdrawal amount. For a $100,000 portfolio, $1,200 would be withdrawn from the bond fund during the first year of retirement. The math is: the portfolio balance × (withdrawal rate × target allocation) or $100,000 × (0.04 × 0.30) = $1,200.
You could also adjust the amount to withdraw from each fund as a method of annual rebalancing. This would involve withdrawing first from the funds furthest above their allocation targets. Doing this requires more math than the above two methods, but it is possible.
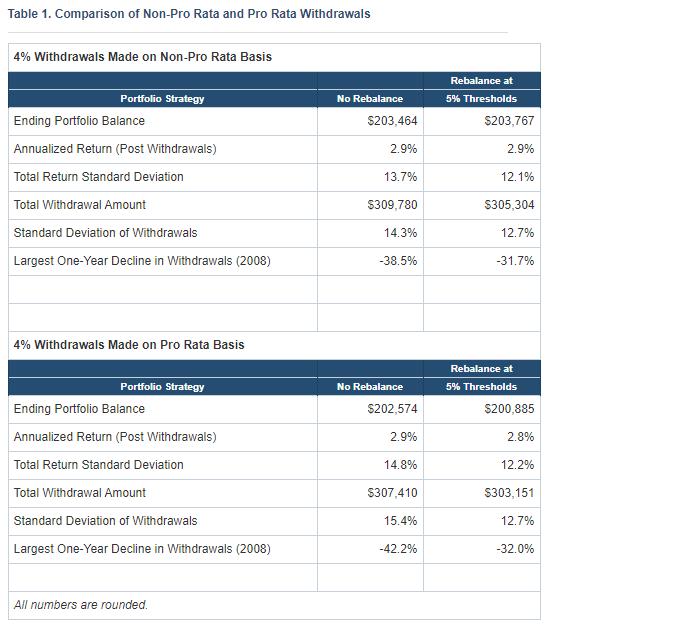
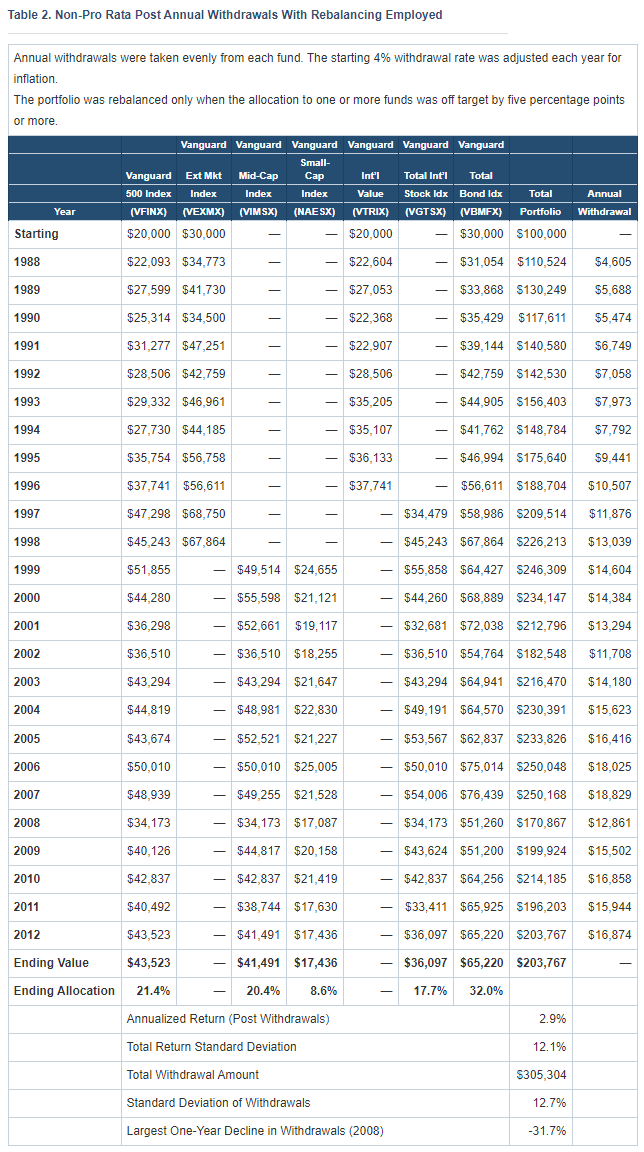
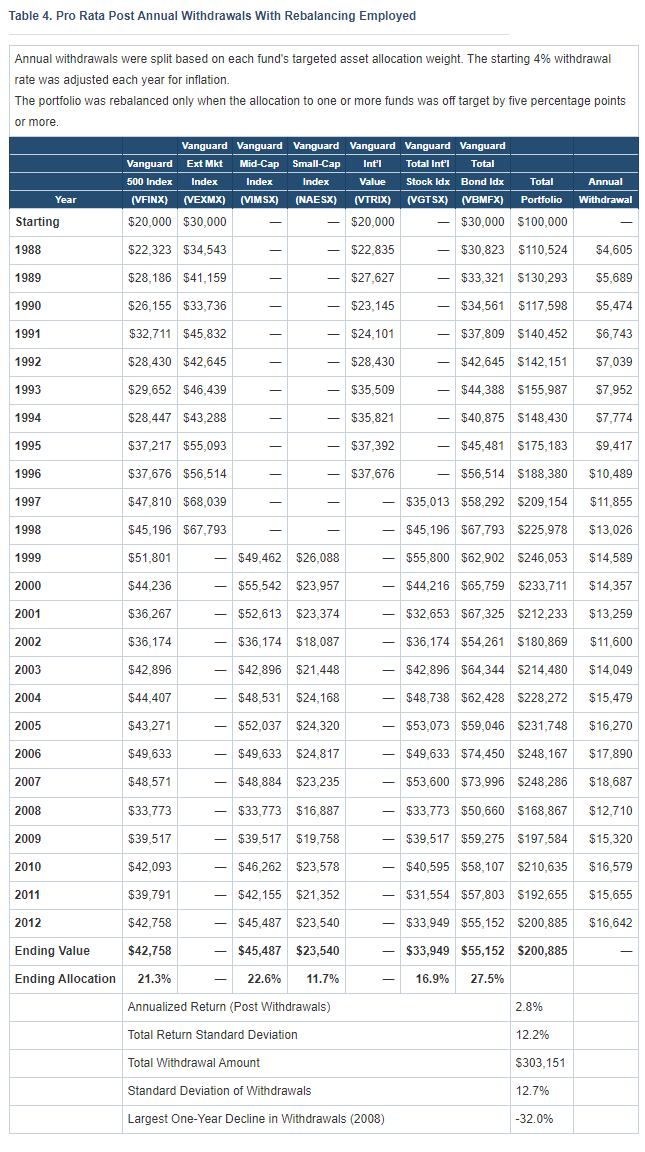
Table 1 summarizes the results for the non-pro rata and pro rata portfolios. The non-pro rata method did produce a slightly higher rate of return, a slightly greater amount of total withdrawals and slightly less volatility. It is also the easiest to calculate. This said, the decision comes down to personal preference. The non-pro rata portfolio is shown in Table 2 with rebalancing employed and in Table 3 with rebalancing not employed. Similar pro rata tables are included at the end of this article.
I used index mutual funds from Vanguard to limit the impact of active management, keep expenses to a minimum and to show close to real-world results. It is very possible for an investor to have mimicked these hypothetical portfolios and achieved similar results. Keep in mind that withdrawals made from a traditional IRA or a similar type of tax-deferred account would be taxed. The results shown here are on a pretax basis.
The specific target portfolio allocations are 20% in the Vanguard 500 Index fund (VFINX); 20% in the Vanguard Mid-Cap Index fund (VIMSX); 10% in the Vanguard Small-Cap Index fund (NAESX); 20% in the Vanguard Total International Stock Index fund (VGTSX), which invests in both developed and emerging market countries; and 30% in the Vanguard Total Bond Market Index fund (VBMFX).
The starting year of 1988 was chosen because that was the first year enough index funds were available to conduct the study. A 20% allocation to Vanguard International Value fund (VTRIX), an actively managed fund, was used through the end of 1996, when Vanguard Total International Stock Index fund (VGTSX) was launched. A 30% allocation to the Vanguard Extended Market Index fund (VEXMX) was used from 1988 until 1998, when Vanguard Mid-Cap Index fund (VIMSX) became available. At the start of 1999, the VEXMX allocation was split between VIMSX (two-thirds) and Vanguard Small-Cap Index fund (NAESX) (one-third) to achieve the desired 20% mid-cap and 10% small-cap allocation.
To maintain the portfolio allocations and the benefits of diversification, the portfolios were rebalanced when a specific fund’s allocation was more than five percentage points off target. The rebalancing occurred after the annual withdrawals were made. The rebalancing transactions occurred in 1992, 1996, 1998, 2002, 2003, 2006, 2008 and in 2010 for the non-pro rata portfolio (withdrawals spread evenly across all funds). The dates differed slightly for the pro rata portfolio (withdrawals weighted by allocation percentages): 1992, 1996, 1998, 2002, 2003, 2006, 2008 and 2009.
When rebalancing was employed, I first took withdrawals out of the funds. I then multiplied the year’s ending, post-withdrawal balance by the targeted allocation weight for each fund. In 1998, the non-pro rata portfolio had a post-withdrawal balance of $226,213. Based on this, I adjusted the post-withdrawal balance in the large-cap fund to $45,243 by selling shares and reallocating the cash to the international and bond funds. With a target allocation of 20% for the large-cap portion, the math is: $226,213 × 0.20 = $45,243. (Both the portfolio balance and the large-cap allocation numbers are rounded.) A similar equation was applied to the other funds to either increase or decrease the amounts invested in them.
Each fund in these portfolios represents a different asset class. If you hold multiple funds for a given asset class, group them together for purposes of rebalancing.
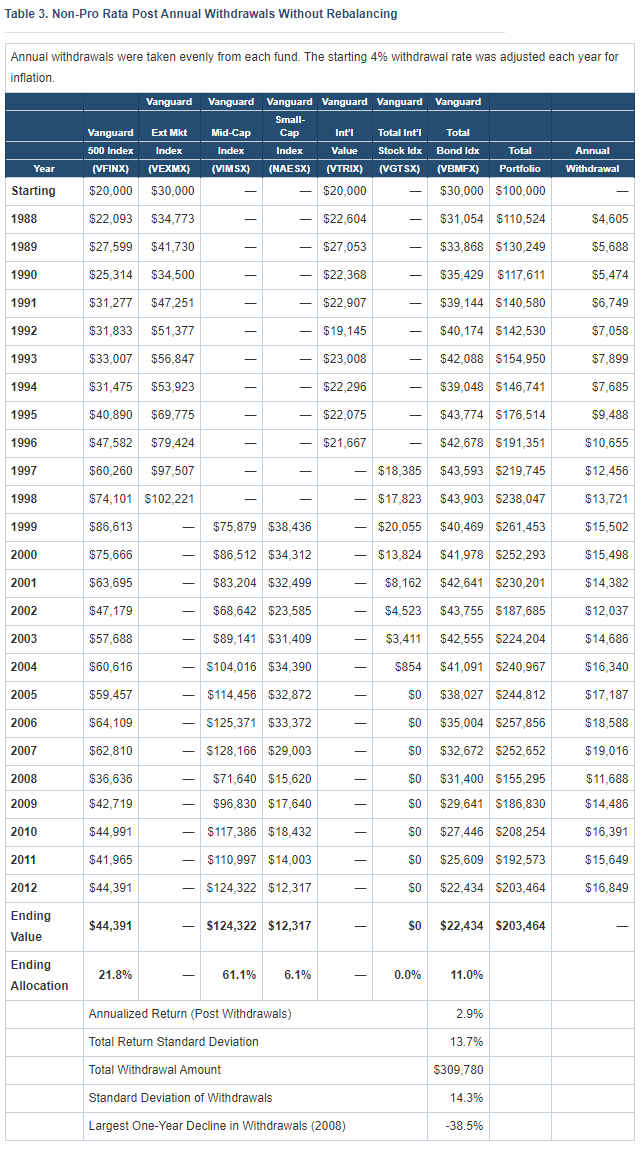
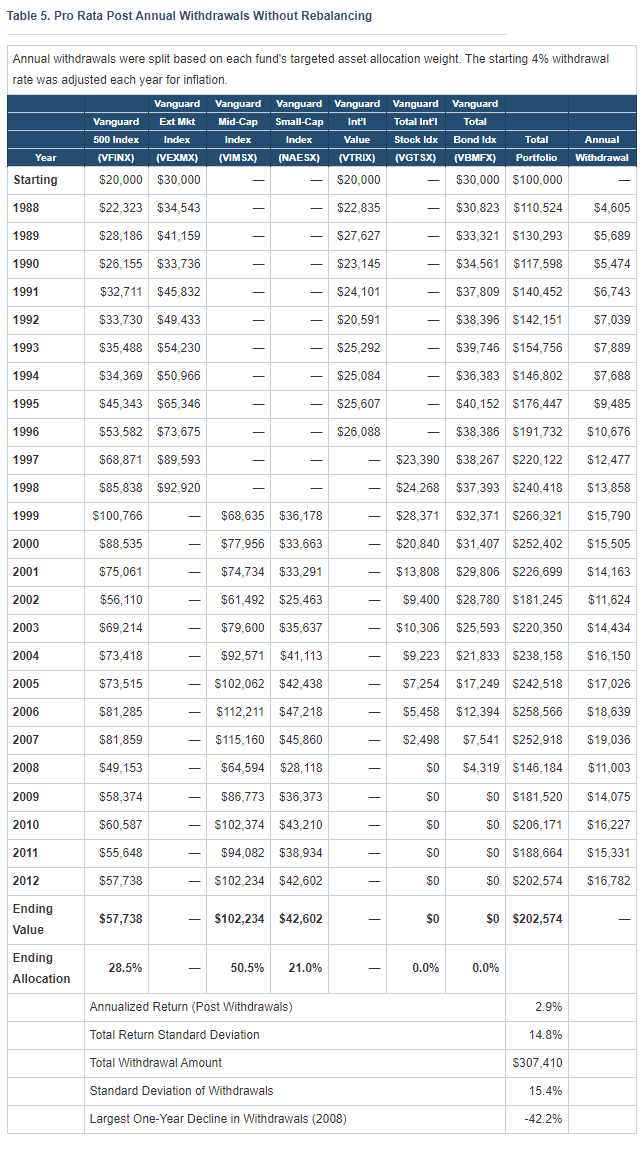
By limiting withdrawals to 4% of the portfolio’s starting value and only adjusting the annual withdrawal percentage amount upward to account for changes in inflation, total savings rose. Over the past 25 years, the dollar value of the non-pro rata portfolio would have grown to $203,767 when rebalancing was employed and $203,464 when rebalancing was not employed. The dollar value of the pro rata portfolio would have grown to $200,885 when rebalancing was employed and $202,574 when rebalancing was not employed. Regardless of which method was used, volatility was reduced when rebalancing was employed.
The growth in the portfolio’s value is significant because an investor who retired at age 65 in 1988 would have turned 90 in 2012. This means his chances of outliving his portfolio are extremely slim given current life expectancy rates, assuming he started out with enough savings to survive on the inflation-adjusted 4% withdrawal rate. As I mentioned earlier in the article, the portfolio is scalable, so as long as the 4% withdrawal is followed, the ending balance should be proportionately the same.
The size of the annual withdrawals increased under both the pro rata and the non-pro rata methods, regardless of whether rebalancing was used or not. In the case of the rebalanced, non-pro rata portfolio, the withdrawal amount rose from $4,605 at the end of 1988 to $16,874 at the end of 2012. Solely looking at the starting and the ending values does not reveal the entire story, however.
The annual withdrawal amount decreased in size seven times for the rebalanced, non-pro rata portfolio (1990, 1994, 2000, 2001, 2002, 2008 and 2011). Even though the withdrawal rate rises every year to account for inflation, it is still a percentage of total portfolio value. If the portfolio falls more in value on a percentage basis than the withdrawal rate is increased by the rate of inflation, the dollar amount of that year’s withdrawal will be lower. This is why price volatility is a consideration for retirees. The greater the fluctuation in annual returns, the greater the fluctuations in the annual withdrawal amounts will be. Many advisers suggest shifting to a more conservative allocation in retirement as a strategy for reducing this volatility.
An investor with enough money saved can buffer these fluctuations by keeping withdrawals stable during down years for the market. This is only possible if the size of the retirement portfolio is large enough to ensure that longevity risk is not a concern. Otherwise raising the withdrawal amounts early in retirement can cause financial problems later in life.
Varying withdrawal rates will be less of a concern for an investor with a large enough stream of more predictable cash flow. Social Security, pensions, bond ladders and annuities can assure a retiree a minimum level of cash flow, increasing his financial ability to tolerate periodic annual variances in withdrawal rates.
Allocation problems occurred when rebalancing was not employed. Not rebalancing caused the international stock allocation to be fully depleted by the 2005 withdrawals in the non-pro rata portfolio and by the 2008 withdrawals in the pro rata portfolio. The bond allocation was completely depleted in the pro rata portfolio by the 2009 withdrawals, though this was not the case in the non-pro rata portfolio.
In the year when the international fund’s balance fell below its share of the annual withdrawal, I assumed a retiree would completely pull his investment out of the fund. I then proportionately adjusted the amounts to withdraw from the four remaining funds, less the amount withdrawn from the international fund. This increased the size of the withdrawals made from the remaining funds in subsequent years, which helps to explain why the bond fund ran out of money in the pro rata portfolio, but not the non-pro rata portfolio.
Bond fund investors should take note of this. If bond funds lag over the next decade or longer, they could pose allocation problems. Since the bond funds would underperform the portfolio’s total return, as withdrawals increased in size, larger and larger amounts would be taken from a fund balance that was shrinking in relation to the rest of the portfolio. This is why using a pro rata weighting might compound the problem.
One solution would be to periodically rebalance. Regardless of whether the non-pro rata or the pro rata method was used, the benefits of diversification were preserved with periodic rebalancing. None of the four funds diminished to a point where their balances declined to $0. Rather, the non-pro rata withdrawal portfolio ended 2012 with a post-withdrawal balance of $36,097 in the Vanguard Total International Stock Index fund and the pro rata portfolio ended 2012 with a post-withdrawal balance of $33,949 in the Vanguard Total International Stock Index fund.
Using the non-pro rata portfolio, I increased the initial withdrawal rate to see how high I could set it without running out of money after the final withdrawal was made in year 25. As was the case with the prior examples, the starting amount was adjusted upward to account for inflation. A starting withdrawal rate of 15% would have ensured that none of the five funds would have been fully depleted when rebalancing was employed. The portfolio’s balance at the end of 2012 was just $2,010, however. (When rebalancing was not used, 4% was the maximum withdrawal rate that could have been used without the international stock fund being fully depleted.)
Though a 15% withdrawal rate makes the 4% rule seem too conservative, a single number often does not always tell the full story. The annual withdrawal amount peaked in 1989, the second year of retirement, at $18,869. It then proceeded to decline to a mere $1,771 in 2012. This decline occurred because the withdrawal amounts in the early years of retirement were too large. Since the withdrawal amounts are based on a percentage of total assets withdrawn, as the portfolio shrank in size, so did the size of the annual withdrawals.
So how much could you withdraw without diminishing the annual amounts late in life? Five percent seemed to be close to the upper limit. The annual withdrawal amount would have risen from $5,756 at the end of 1988 to $14,607 at the end of 2012. The maximum amount of $17,969 would have been realized in 2007.
Other studies have also pegged an inflation-adjusted 4% withdrawal rate as the safe maximum level a retiree can withdraw from his portfolio and not run out of money before his death. A study that looked at withdrawal rates from 1926 through 1995 concluded this withdrawal rate had between a 95% and 98% success rate over a 30-year period for a portfolio with at least a 50% allocation to stocks. Notably, a 3% rate appeared to be the maximum for retirees allocating 75% or 100% to bonds. See “Retirement Savings: Choosing a Withdrawal Rate That Is Sustainable” in the February 1998 AAII Journal for the results of this study; a PDF of the article is available on AAII.com.
Keep in mind that my analysis here is based on what has happened over the past 25 years. Though the portfolios provide examples of how to manage a fund portfolio in retirement, they reveal pitfalls as well. Perhaps the biggest lessons are that following the 4% withdrawal rule is a key to avoiding longevity risk, but it can result in withdrawal amounts that do not increase every year.
Portfolio Strategies
Portfolio Strategies