The Truth About Top-Performing Mutual Fund Managers
by Aaron S. Reynolds
It’s only natural for investors to look at past performance when selecting managers of either mutual funds or separate accounts. Almost everyone is impressed by a strong track record. However, investors may be making a crucial mistake by fleeing from recent losers and flocking to recent winners, especially if they act on relatively short-term results.
According to a study we conducted at Baird, at some point in their careers, virtually all top-performing money managers underperform their benchmark and their peers, particularly over time periods of three years or less. Rather than abandoning a top-performing manager during one of these periods, investors should anticipate and, quite often, accept this performance cycle. Why? By chasing performance, investors fall into an ongoing pattern of buying after share prices have risen considerably and selling after they have dropped. This behavior opposes the basic tenet of investing—buy low and sell high—and can cut dramatically into investor wealth. In addition, past performance is only part of the story. Professionals who analyze investment managers know that the drivers of performance are equally important.
Our study, which updated and built upon prior research, revealed that investors with the patience to stick with a top manager through trying times are likely to reap greater rewards than those who chase the latest winner. Although there are times when a change in manager is warranted, our research revealed that the longer an investor sticks with a top-performing manager, the better the chances of success.
This article explores the tendency of top managers to underperform and the reaction of investors when they do. It also offers insights to help investors uncover the reasons behind a manager’s performance and make informed decisions based on longer-term results.
Even the Best Investment Managers Underperform
In general, money managers are considered top managers when they have a history of outperforming their benchmarks and their peers. They add real value by producing returns that exceed management fees over a long period of time. Our study looked at a group of more than 1,500 mutual funds with a 10-year track record as of December 31, 2010, and narrowed the list to 600 that outperformed their respective benchmarks by one percentage point or more, on an annualized basis, over the 10-year period. Furthermore, we included only those funds that both outperformed and exhibited less volatility than the market benchmark. This narrowed our list to a select 370 funds. [Editor's note: Aaron Reynolds provided us with a list of the fund names.]
In dollar terms, these top performers generated more than $10,000 in incremental wealth above the benchmark’s return for every $100,000 invested over the period. The average top manager in the study beat the benchmark by nearly three percentage points annualized, net of fees, adding $34,000+ in incremental wealth.
Clearly, this is no ordinary subset of managers. Their 10-year performance records are truly outstanding. One of the purposes of this study was to determine what percentage of these managers fell short of their benchmark over any three-year period within the 10 years (see Note 1 in the box at the end of this article). The results are compelling. Despite their impressive long-term performance, almost all of these top-performing managers underperformed their style benchmark at some point. In fact, evidence confirms that it is virtually certain that all top-performing managers will go through prolonged periods where they underperform their benchmarks and lag their peers.
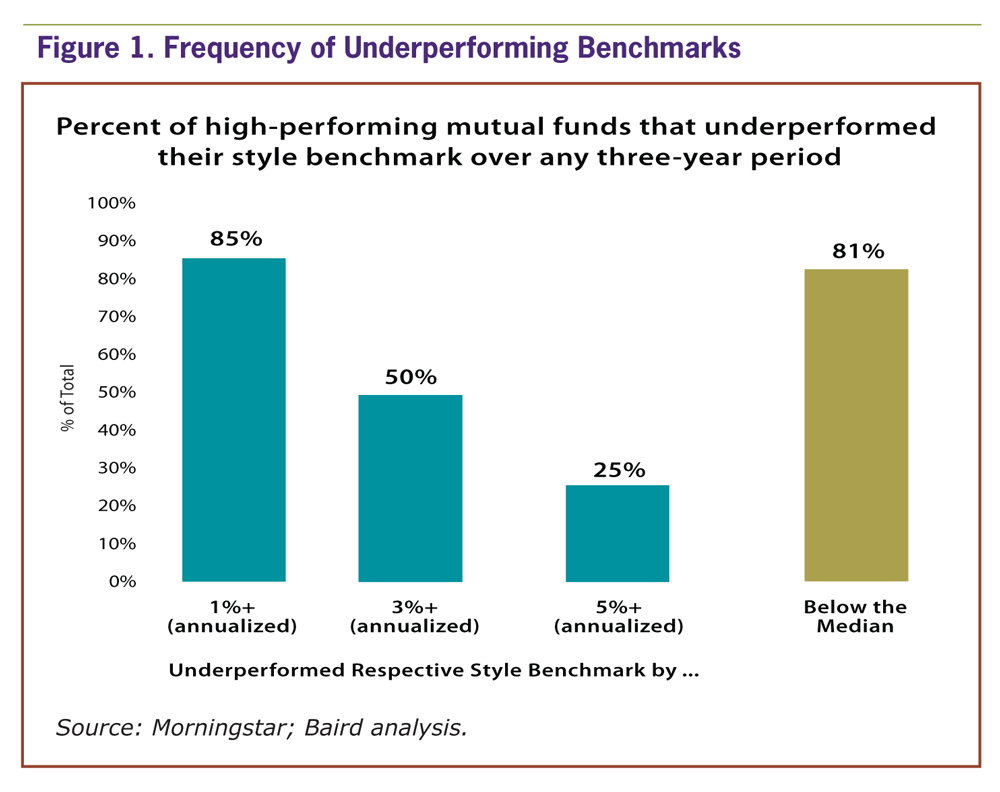
As Figure 1 illustrates, approximately 85% of the top managers had at least one three-year period in which they underperformed their style benchmark by one percentage point or more. In fact, on average, they underperformed during six separate rolling three-year periods (out of a total of 29). About half of them lagged their benchmarks by three percentage points (on average, three separate times) and one-quarter of them fell five or more percentage points below the benchmark for at least one three-year period.
When compared with their peers, 81% of them fell to below-average in at least one three-year period—and they remained below par for an average of almost four quarters. It appears that when the top managers fall below their peer group median, they tend to remain there for some time.
Depending on which of the three-year periods investors looked at, they could have been highly alarmed by what they saw. Still, all of these managers were top performers over the full 10-year time span.
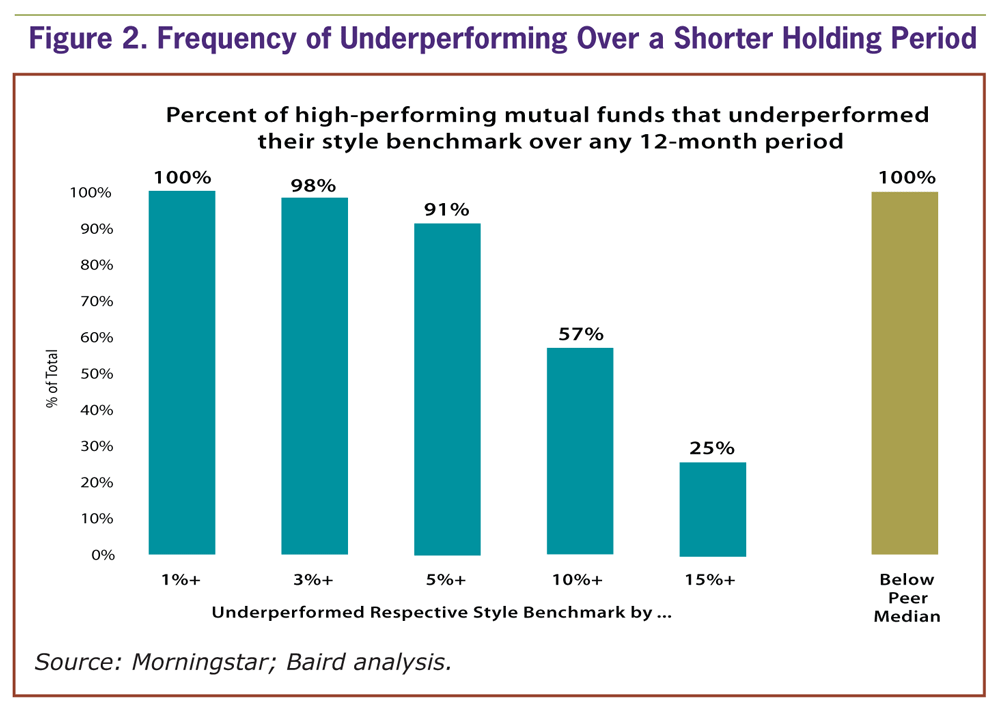
We also looked at shorter holding periods of 12 months because, in our experience, many investors make decisions based on very short-term performance. The results were even more telling, as shown in Figure 2. All of the top managers dropped below their peer group average at least once. Compared to their peers, there were many 12-month time periods when these top managers disappointed investors.
Moreover, one-quarter of them went through at least one 12-month period where they underperformed their benchmark by 15 percentage points or more.
Clearly, both the frequency and magnitude of underperformance become more dramatic over shorter evaluation periods. Investors who focus on very short-term results may be more susceptible to making imprudent investment decisions.
By these measures, it looks as though all great money managers will go through periods of underperformance. What should investors do when they find themselves in the midst of one of these tough periods?
Shortsighted Investors Leave Wealth on the Table
Most money managers and mutual funds report performance results over one-year, three-year, five-year and 10-year periods, as well as since inception. However, in our opinion, many investors take action based on the first or second number, and begin a pattern of chasing short-term performance.
As a proxy for gauging investor behavior, we looked at money flows into and out of funds following changes in Morningstar’s star ratings, which are based on past performance relative to peers. The star rating ranks funds based on relative performance within their category over the trailing three-, five- and 10-year periods, adjusted for risk and sales charges (see Note 2 in the box at the end of this article). As a result, a fund with a strong 10-year record could be downgraded if its three-year performance fell well short of its peer group.

We isolated any period over the past 10 years when a high-performing fund was given a rating upgrade or downgrade and then measured the subsequent asset flows for the following 12 months. When top-performing funds in our study were upgraded from three to four stars or four to five stars, net money flows over the following 12 months were sharply positive—to the tune of $14 million and $331 million, respectively, on average per fund. Similarly, flows were decidedly negative following a top-fund downgrade from three stars to two stars or from two stars to one star (by approximately $65 million and $257 million, respectively, on average per fund).
This shows that investors tend to race into funds after a period of strong performance. As a result, they appear to be buying high (as funds are coming off a strong period) and selling low (as funds are coming off a weak period). This pattern of behavior is in clear violation of the cardinal rule of successful investing: buy low and sell high.
So begins the path toward a less-than-optimal outcome for investors. As Figure 3 illustrates, investors who bought a top fund after it was upgraded would have indeed fared well. Over the three years following a rating change from three to four stars or four to five stars, these funds produced an excess return of 1.4 and 1.7 percentage points over the peer average, respectively. However, the downgraded top-performing funds performed even better, gaining 2.0 and 2.1 percentage points of excess return for a rating change from three to two stars or two to one star, respectively.
This research reveals that most high-performing managers can and do make up lost ground and add excess return following periods of weakness, particularly over an intermediate-term time period. By abandoning these managers and failing to exercise patience, investors can leave significant wealth on the table.
Why a Long-Term Perspective Is Important
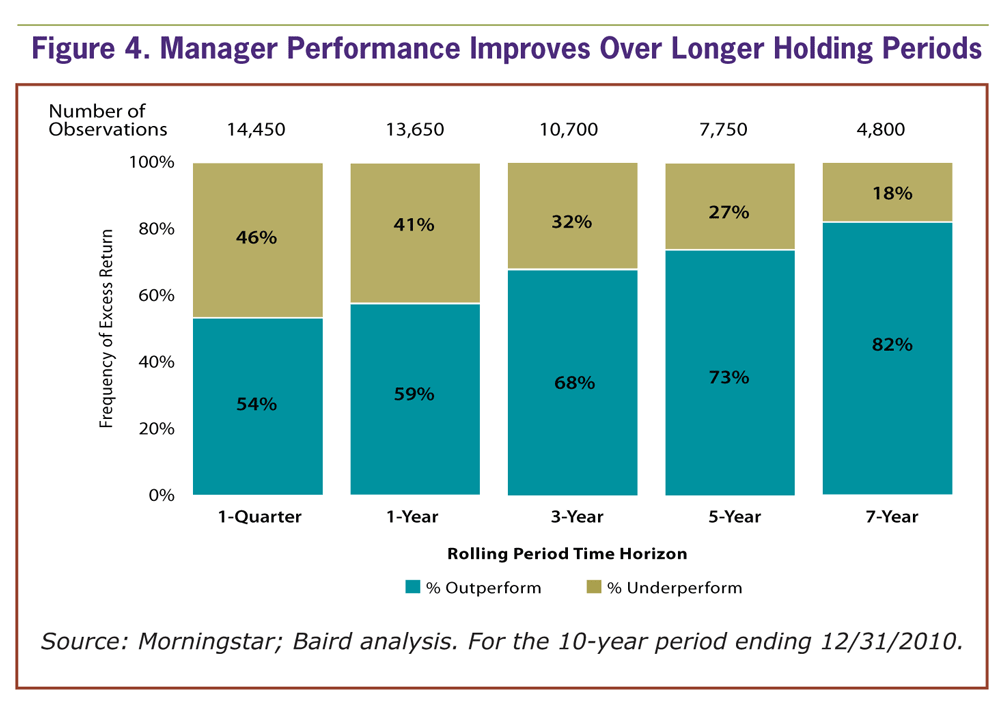
Rather than leaving a top-performing manager during difficult times, the evidence suggests it pays to be patient, as shown in Figure 4. Indeed, the longer an investor can wait the better, as managers’ chances of beating their benchmarks increase with longer holding periods. For example, when we looked at performance over the shortest time period, one quarter, the top-performing funds in our study outperformed their benchmark just more than half of the time. However, by extending the holding period to five years, the managers were able to add value almost 75% of the time. Over seven-year holding periods, more than 80% of them beat their benchmarks (see Note 3 in the box at the end of this article).
This research confirms that fluctuations in relative returns are fairly common over shorter time periods, while outperformance is achieved more often over longer periods. Again, it is critical to avoid making judgments based on short-term performance and to evaluate money managers over periods of time that are long enough for them to prove their worth.
Does It Ever Pay to Make a Manager Change?
Manager performance can lag for a number of reasons. Sometimes the underperformance is expected and is no cause for alarm. Other times there may be signs of deeper problems. Identifying potential red flags means doing homework on money managers—understanding how managers have historically added value and discovering the cause of the underperformance. For example, what are the managers buying? How do they invest? Is the underperformance within the range of expected variation? Here are some considerations:
1. Manager Style
It’s unfair to paint all managers in the same asset class with the same brush. For example, deep value managers look for stocks selling at discounts to their historical valuations, while relative value managers look for stocks that are cheap relative to their prospective growth rates. Likewise, traditional growth managers may have an advantage over managers who adhere to the “growth at a reasonable price” investment style, which tends to be more conservative. In both of these cases, the managers may be benchmarking to the same indexes, but showing very different relative performance results.
2. Market Environment
In our view, investors should always expect some of the money managers within their portfolios to be performing well and some to be underperforming, particularly in very turbulent market environments. Consider the late 1990s, when money managers’ opinions of technology stocks largely determined their relative performance. If an investor retained only those managers who were outperforming, they would have been left with an extremely attractive portfolio, as defined by recent performance. However, their portfolios would also have been quite poorly positioned for the next couple of years.
In turbulent markets, it is especially important to avoid the herd mentality, which can implicitly result in a bet on just one side of the market. Currently, sector and asset class leadership is rotating quickly. A diversity of opinion might achieve a better balance.
3. Asset Allocation
Disciplined asset allocation has been shown to add significantly to investor returns. Investors who approach manager selection the way they approach asset class allocation would rebalance away from recent strong performers and toward recent weak ones. Thus, if they choose to stay with a manager after a period of weakness, they might be able to add wealth by allocating additional funds toward that manager. If they decide to change managers after a period of weakness, investors should recognize they are selling a potentially undervalued portfolio.
When a Change May Be Warranted
All that said, while much of this study highlights the benefits of being patient with underperforming investment managers, complacency is not always the best course of action. There are times when a change is warranted. For example, are the weak results sustained and evident across investment environments? Was outperformance expected given market conditions? These could signal that the manager has made several poor judgment calls in the portfolio. Also, a manager change may be prudent if there have been unexpected qualitative changes, including:
- the departure of a key manager,
- a new subadvisor,
- a change in the investment process,
- a change in firm ownership, and
- significant shifts in assets under management.
In Summary
It’s probably smart to stick with top managers who are underperforming, if they are investing consistently within their style and process, even if it happens to be out of favor. Likewise, it is understandable if managers fall short because they are underweighted in one or two stocks or sectors compared with their benchmark. Evaluating managers over a full market cycle can offer deeper insight into the story behind the numbers. Unless the weak results are sustained and widespread, or supported by material changes in the management team or process at the firm, patience is likely to pay off.
A Lesson in Patience
The Baird study and others before it offer an important lesson for investors: Virtually all top-performing investment managers underperform their benchmarks and their peers sometimes—and when they do, it is usually for a relatively prolonged period. Investors who focus on these short-term results may lose out on the incremental wealth that top managers are likely to add in subsequent years. By extending their focus to long-term performance, investors may reap the rewards of their patience.
Investors will always be influenced by a manager’s past performance. But by holding managers accountable for their body of work over time, rather than their short-term results, investors have a better chance of witnessing a top manager’s true potential and building greater long-term wealth.
Note 1
For this analysis, we took a “snapshot” of each fund’s three-year relative performance calculated every quarter, much like an investor would experience when receiving a quarterly statement. This resulted in more than 10,000 observations (29 periods × 370 funds = 10,730 observations). The mutual funds were analyzed relative to their style-specific benchmarks; for example, large growth funds were analyzed relative to the Russell 1000 Growth index. We analyzed funds at the asset class level (i.e., large-cap, mid-cap, small-cap and international) and aggregated the data for presentation.
Note 2
Mutual Fund Style Universe: Style-specific universe of mutual funds as categorized by Morningstar. The Morningstar-generated categories are created by incorporating all the funds in the respective Morningstar categories that have at least 12 months of reported performance. The number of funds included in each category as of December 31, 2010, are 472 for large growth, 596 for large core, 334 for large value, 231 for mid growth, 162 for mid core, 121 for mid value, 228 for small growth, 217 for small core, 105 for small value and 399 for international.
High-Performing Mutual Fund Study: Style-specific universe of mutual funds as categorized by Morningstar, which are created by incorporating all the funds in the respective Morningstar categories that have at least 12 months of reported performance. As of December 31, 2010, according to Baird’s study, the number of funds with a 10-year track record and the number outperforming by 1% or more and having a lower standard deviation are: 166/82 for large growth, 249/50 for large core, 142/32 for large value, 84/53 for mid growth, 80/9 for mid core, 80/6 for mid value, 83/53 for small growth, 90/41 for small core, 48/17 for small value and 187/26 for international.
Morningstar Ratings: The overall Morningstar rating for a fund is derived from a weighted average of the performance figures associated with a fund’s three-, five- and 10-year (if applicable) Morningstar Rating metrics.
For each fund with at least a three-year history, Morningstar calculates a Morningstar Rating based on a Morningstar risk-adjusted return measure that accounts for variation in a fund’s monthly performance (including the effects of sales charges, loads and redemption fees), placing more emphasis on downward variations and rewarding consistent performance. The top 10% of funds in each category receive five stars, the next 22.5% receive four stars, the next 35% receive three stars, the next 22.5% receive two stars and the bottom 10% receive one star. Each share class is counted as a fraction of one fund within this scale and rated separately, which may cause slight variations in the distribution percentages.
Note 3
For the past 10 years ending December 31, 2010, we tracked the relative performance of each high-performing manager over various rolling time periods. For example, there are 40 one-quarter periods over the past 10 years (40 periods × 700 funds = 28,000 total observations). We recorded how often these managers outperformed or underperformed their respective benchmark over that time period. This same methodology was used to evaluate the managers over one-, three-, five-, seven- and 10-year periods.
Investors should consider the investment objectives, risks, charges and expenses of a fund carefully before investing. This and other information is found in the prospectus. Please read the prospectus carefully before investing. Past performance is no guarantee of future results.
