Using Sell Signals to Improve Results
by Kate Stalter
There are three elements of successful portfolio management: buying, holding and selling. Yet many investors focus their energies almost exclusively on buying and fail to make a plan for selling.
It is crucial to find the best stocks and buy at the right time, but to keep profits, it is equally key to understand when holding is no longer the right move and the time to sell has come.
It is also important not to downplay how much emotions can interfere with decision-making. When it comes to selling, many people feel it is somehow wrong to let go of a stock, even when they have significant gains on paper. But it stands to reason that if a profit is going to be realized, selling is absolutely necessary.
Consider this: When the general market topped in March 2000, millions of investors did not understand the signals. It has been said that roughly 80 million people lost $7 trillion in the ensuing months because they held stocks that tumbled ever lower, rather than selling to keep their gains after the dotcom boom. By spotting critical sell signals, you can affect a big difference in investing results.
First Sell Rule: Cut Losses
Sell any stock that falls 7% below its purchase price. Period. End of story.
This is one of the first investing principles that Investor’s Business Daily founder William O’Neil observed when he began his market research in the early 1960s. And since then, ongoing research has supported that finding. Assuming that a stock is bought as it emerges from a healthy chart pattern, it generally will not rebound any time soon if it falls more than 7% from a proper buy point.
Odyssey Healthcare ODSY illustrates the point. In late 2003, the stock began what turned into a catastrophic downward slide. The chart in Figure 1 shows how the 7% sell rule would have protected investors.
- Point 1: Odyssey, which runs a chain of hospices throughout the country, rallied to a new price high in early September 2003. It retreated from there and began forming a new area of price consolidation. There were problems with that new consolidation, also called a base. For example, price swings became wider than they had been during the preceding four-month rally.
- Point 2: In late November 2003, Odyssey began emerging from its consolidation or base. A possible buy point would have been at $33.52, 10 cents above the high price of the handle within a cup-with-handle pattern, or $33.42. (See “What Is a Cup-With-Handle Base?” on page 20 for an explanation of this pattern.) Adding 10 cents increases the odds that the stock would overcome its most recent price resistance. The cup-with-handle base is among formations that frequently precede a big price run-up.
- Point 3: The price rallied to a new high of $38.85 on December 2, 2003, but immediately reversed lower.
- Point 4: The next day, the price dropped another 11% accompanied by a huge spike in volume. That big decline brought the stock more than 7% below the buy point of $33.52. The stock rebounded somewhat, but the fact that it fell so hard so fast was an indication that something was wrong and the stock should have been sold.
- Point 5: In February 2004, shares of Odyssey Healthcare gapped down 26%. As Figure 1 shows, Odyssey had begun showing weakness back in late 2003. Anyone who had sold using the 7% sell rule would have been very happy with how that process worked out!
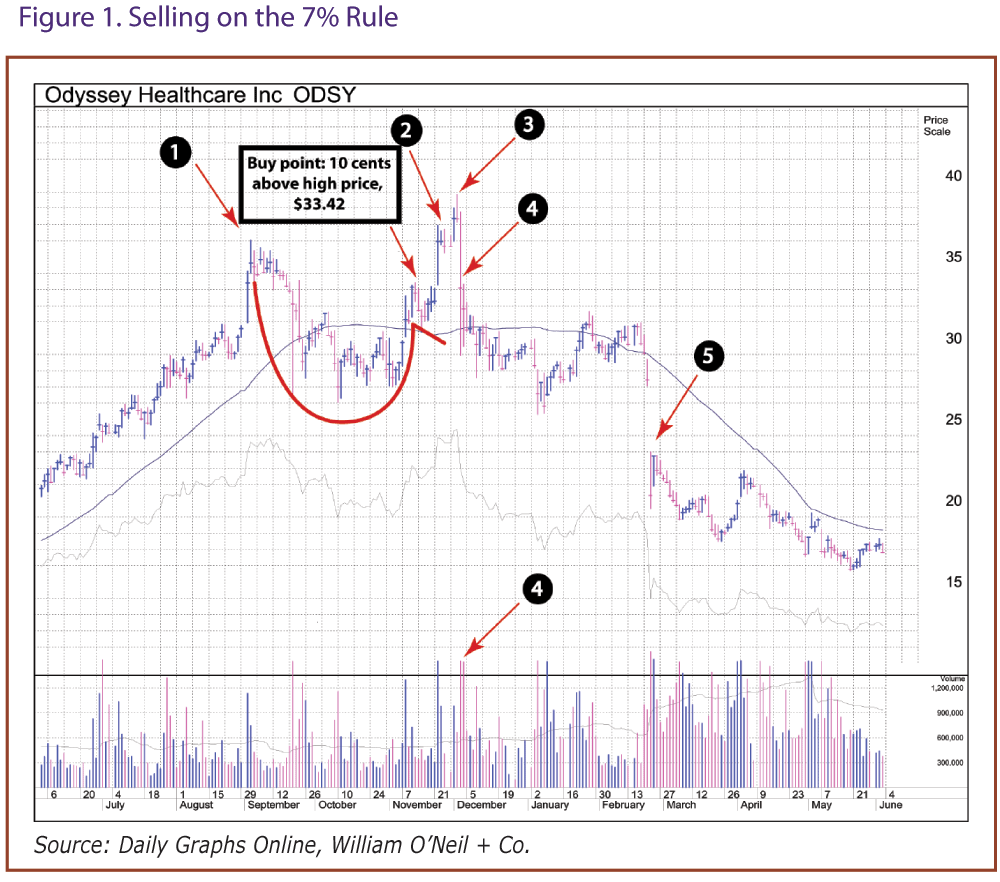
Odyssey Healthcare illustrates how sell signals are often present before bad news becomes public. The big gap-down in February 2004 was caused by the company saying its first-quarter profits would come in below analysts’ estimates. Published reports also began to raise questions about the company’s standards of service for Medicare patients.
In October of 2004, Odyssey gapped down another 47%. The company revealed that it was under investigation by the Department of Justice and announced the resignation of its CEO. Odyssey also reported another earnings miss.
Odyssey is just one of many examples that show why the 7% sell rule is a proven way to protect oneself against possible big losses. It also illustrates that so-called “surprises” often are preceded by warning signals on a stock’s chart.
Second Sell Rule: Protect Gains
The second important time to sell is when gains in a stock exist, but the chart shows signs of weakening.
Here, a crucial piece of the puzzle is the general market. Are the major indexes trending higher? Three-fourths of stocks follow the market’s direction, so if an investor is holding a stock, it is critical to know how the indexes are performing. The stock is likely to move in the same direction.

Leading up to the market downturn that began on January 22 of this year, the S&P 500 was showing six days of heavy-volume selling, called “distribution days” (Figure 2). As far back as the 1880s, distribution days have been a reliable signal of market weakness that precedes a downturn.
As Investor Business Daily’s IBD “Big Picture” market column noted at the time, leading stocks—those with the market’s best fundamentals and technicals—were showing big declines. When leaders begin to tumble, that’s another indication that overall market health may be fading.
So what should an investor do when the days of heavy selling on the indexes begin to pile up? Just watch the stocks held in your portfolio like a hawk, and be ready to sell to protect any unrealized gains. You should even consider selling partial positions to start reducing exposure to stocks.
Sometimes newer investors get confused about the sell rules and think that a market correction means, by definition, that an investor must immediately sell all his or her holdings. Not true. If a stock is one of the few that bucks the downward trend, then it may be okay to hold. Likewise, if there already is a large cushion in the stock since the purchase date, an investor may be able to safely hold it during an intermediate market correction.
But strict monitoring is key. Do not assume that because it has been a winner a stock will continue along the same path! If an investor becomes emotionally attached to a stock and decides to hold it at all costs, the cost could end up being quite high. The decision to hold is not permanent and must be re-evaluated daily, especially in a market downturn.
Third Sell Rule: Look for Signals in Stocks
The market is not the only selling barometer, though. Stocks themselves weaken and can break down completely.
Of course, selling a stock with large gains is not always easy to put into practice. As IBD founder William O’Neil points out in “How to Make Money in Stocks” (McGraw-Hill, fourth edition, 2009), it can be difficult to sell after gains exist in a portfolio holding. It is easy to remain hopeful that there are more gains to come.
But history shows why that can be a big mistake. By identifying sell signals near the top, O’Neil writes, “You won’t get caught in the heartrending 20% to 40% corrections that can hit market leaders and put downside pressure on your portfolio.”
The MercadoLibre Example
Here’s an example of a stock that was flashing signs of weakness in late 2009 and early 2010.

MercadoLibre MELI is a Latin American online marketplace that sells a range of consumer goods, including electronics, clothing, collectibles, and even real estate. The stock went public in August 2007, and has a three-to-five-year earnings growth rate of 168%. Sales have grown in every single quarter since March 2006, and Wall Street expects profits to increase at a double-digit rate in the next two years.
Even eBay likes this company and owns a sizeable portion of its shares.
So the company’s been growing, it is profitable, and looks to remain profitable. So why not just buy and hold?
The answer can be found with a look at MercadoLibre’s chart (Figure 3).
- Point 1: MercadoLibre ran up to a new price high of $55.62 on December 3, 2009. However, it couldn’t hold its gains and it reversed downward, finishing near the session low. It is worth noting that the NASDAQ also staged a similar downside reversal the same day. At that time, the general market was under selling pressure.
- Point 2: After pulling back and finding support above its 50-day moving average, MercadoLibre rallied to yet another new high of $55.75 on December 28, 2009. Here again, the stock reversed lower, and finished near the bottom of its daily trading range. MELI retreated even further the following day. Volume was light due to the holiday season but, nonetheless, such downside price reversals are not encouraging. The stock was clearly having problems overcoming resistance between $55 and $56. As of late December, IBD’s Current Outlook was “Confirmed Uptrend.”
- Point 3: On January 11, 2010, with the market still in an uptrend, MercadoLibre sliced through its 50-day line on its heaviest volume in eight months. A sharp pullback below this key moving average, accompanied by unusually heavy trading, is one of the main signals that a stock’s uptrend is in jeopardy, if not already dead. There was news that drove the move: Venezuelan president Hugo Chávez devalued the bolivar against the dollar. Institutional investors, who had already been showing signs of hesitation about the stock, took the opportunity to dump shares in earnest. But even without knowing the news, the price and volume action was a clear signal of weakness in the stock.
- Point 4: MercadoLibre went on to notch six weeks in a row of downside trading, correcting 36% from its December 28, 2009, high. Even if gains still existed after the 36% correction, it would not have been a savvy investing decision to hang onto a stock that big investors were continuing to bail out of as the market went into a downturn on January 22, 2010. As of this writing, in early May, the stock is still below its old high. Meanwhile, many other stocks not only rallied out of their bases, but set new 52-week highs! Investors who stuck with MercadoLibre are still, as the old song goes, “wishing and hoping.”
MercadoLibre’s chart delivers an important reminder. When a stock is falling sharply, an investor might think it is too late to sell and that waiting for a rebound would be preferable. But remember the Odyssey Healthcare example. This stock still has not rebounded back to its price at the time of the 2004 decline.
Sure, many stocks fall sharply then reverse higher again and recapture the lost ground. But one never knows when or if that will happen. So when a stock flashes sell signals, the investor’s primary thought should be to protect capital and have money to invest in better opportunities.
The Fuqi Example
Let’s look at another example of a big 2009 winner that took a catastrophic tumble. It provides an excellent example of how sell signals can be evident long before bad news is announced.
The stock is Chinese jewelry retailer Fuqi International FUQI. As China’s consumers move into the middle class, they’re buying more consumer goods, like fine jewelry. Fuqi is a manufacturer of jewelry made with gold, platinum and other precious metals. It showed several quarters in a row of excellent sales and earnings increases.
The stock, which came public in October 2007, was among those beginning a strong run-up just as the general market turned higher in March 2009. Around that time, it cleared a steep cup-shaped pattern that began in 2008. (The cup pattern has been a precursor to many big winners of the past, so it is not a bad idea to pay attention when a stock with great fundamentals is forming a cup base.) In the summer of 2009, Fuqi offered alternate buy points as it found support above its 10-week moving average.
Even as it was trending higher, the stock displayed some volatility. Wide price swings within any given week were not uncommon.
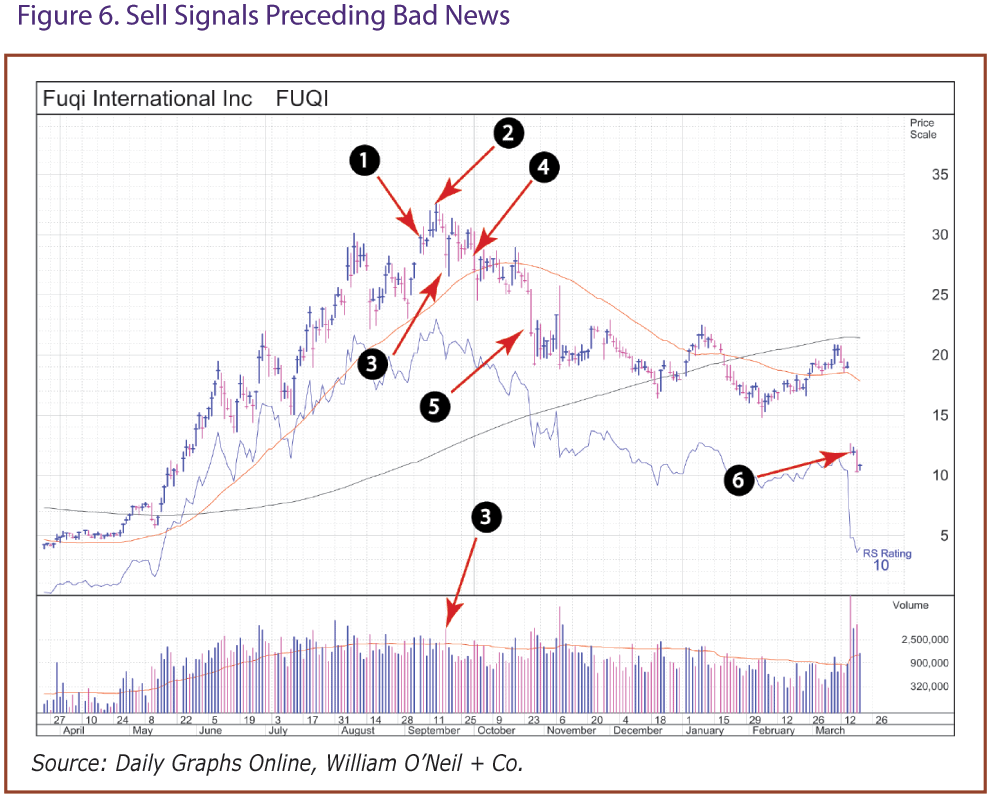
But in early September, Fuqi began showing some signals of possible weakness, as shown in Figure 6.
- Point 1: On September 8, 2009, after a 640% run-up since March, Fuqi gapped higher on above-average volume, moving out of a pullback. Normally, a big-volume gap-up is a sign of strength. However, after an extended uptrend, it can sometimes mean the last gasp for a stock’s rally.
- Point 2: The stock advanced another 10% in the next five sessions. While price gains are generally something to cheer, this situation also presented a red flag. That’s because it occurred immediately after the September 8 gap-up, which itself followed a long, steep uptrend. That can sometimes be cause for concern.
- Point 3: On September 18, 2009, a few days after reaching the new price high, the stock pulled back sharply on heavy volume.
- Point 4: FUQI meandered along for a few more days, but on October 1 had another big pullback in above-average trading. It closed that week below its 50-day moving average line.
- Point 5: After having trouble gaining much traction above its 50-day line, the stock made a huge downside move on October 27, 2009. That same day, the general market went into a correction.
- Point 6: Fuqi continued trending lower after reaching its September high. On March 17, 2010, the stock gapped down 36% on news that the company would have to restate 2009 earnings. At that point, shares of Fuqi were 63% below their September high!
Fuqi is a great example of a stock that showed signs of weakness well before the bad news came out. And that’s not unusual. As we saw with MercadoLibre and Odyssey Healthcare, the chart generally tips investors off to weakness well before the bad news breaks.
Shareholders who hoped the stock would bounce back quickly only became more frustrated with the downtrend over time. But the frustration could have been avoided by following those early sell signals.
It is worth noting that both Fuqi and MercadoLibre showed good fundamentals at the time of their initial declines. Do not hold a stock just because the fundamentals still look good. Make the buy decisions based on fundamentals and technicals, but use the chart signals to determine when it is time to sell.
Conclusion
So what is a good plan to ensure that you don’t miss key signs that a stock you own may be rolling over? Here’s a quick action plan to help you track your portfolio for possible sell signals:
- Limit portfolio holdings to a small number of stocks so each one can be effectively monitored.
- Know when key company events are occurring, such as earnings reports, which can send a price sharply higher or lower.
- Know the market outlook at all times. If the Dow, S&P 500 and NASDAQ are weakening, individual stocks tend to retreat along with them. Investor’s Business Daily studies show that three-fourths of stocks follow the market direction, so don’t get swept in with the downdraft.
Understanding these sell principles is crucial. As the examples show, stocks throw off signals of weakness early, prior to sharp declines. By recognizing these, investors can protect their money and take the best advantage of the market’s biggest winners.
What Is a Cup-With-Handle Base?
After a stock runs up, it usually pauses as it consolidates its price gains. That consolidation happens as some professional investors sell to take profits, while others hold on, waiting for the next upward move.
In research into the best stock winners going back more than a century, Investor’s Business Daily has found that a few patterns commonly take shape as stocks digest their gains. These patterns, which have occurred decade after decade from the 1880s through the present day, often precede another strong price run-up.
The most common base pattern that occurs before a fresh upward move is called the cup with handle. This trading formation resembles a coffee cup when viewed from the side.
In recent decades, many familiar names have formed cup-with-handle bases, and then staged big run-ups. Past cup-with-handle winners include Cisco Systems CSCO, Home Depot (HD), Microsoft MSFT, Apple AAPL, Whole Foods WFMI and many more. These are worth studying.
Recognizing this pattern on a stock chart provides an early signal to buy in before the stock begins a possible big run.

As Figure 4 shows, there is a prior run-up (Point 1) before the price pulls back. This upward move should be about 30% or more to show you that the stock has already built a track record of buying on the part of professional investors. It’s their confidence in the company’s potential that brings them on board and sends the price higher.
When the stock finally pulls back, as some investors take profits, the stock’s low price (Point 2) ideally should be no more than about 35% below the previous high. These pullbacks frequently happen at the same time as an intermediate market correction.
However, in a severe bear market, such as the one in 2008 and 2009, the decline in many individual stocks is much steeper. In fact, many steep decliners eventually emerged from cup-with-handle bases after the market went back into an upward move in March 2009. We’ll look at one example in a minute.
But first, returning to the line drawing in Figure 4, notice the handle area (Point 3) that begins to form after the price has risen from the bottom of the consolidation. Even though the price declines a bit in this area, it still represents a sign of strength, which may seem counterintuitive.
But here’s why the handle often precedes a new run-up: This last downturn serves to shake out any remaining investors who might be prone to selling. Often these are investors who bought into the stock before it fell into its correction. They held on through its downturn and now that they are back to “even,” they are ready to sell.
Once those investors are gone, the stock faces less overhead pressure, or resistance, as it breaks out of the pattern and heads higher. In other words, investors who held, and new investors who come in, all have more confidence in the stock and are eager to invest more money. That is what sends the stock into a new upward move. It has happened over and over from the 1880s through the present day, so it is worthwhile pattern to watch for.
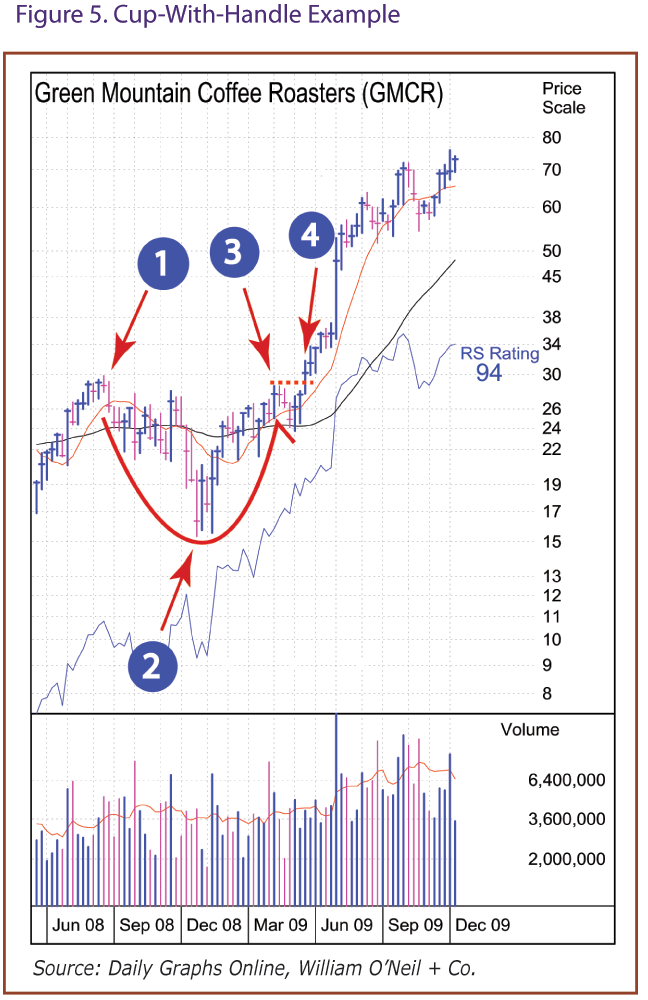
Figure 5 is an example of a stock that formed a cup-with-handle as it emerged from the bear market in early 2009. And appropriately, it is Green Mountain Coffee Roasters GMCR, known for the Keurig single-serving coffee cups.
Let’s look at how that base took shape:
- Point 1: Green Mountain rallied to a new price high in June 2008, after notching a prior run-up of 79%.
- Point 2: The price fell to a low of $15.34 in October 2008. That was a 49% decline from its June high, but remember: this was in the depths of the bear market, when there are more likely to be unusually steep declines—well beyond the 30% or 35% correction that would occur during an intermediate market correction.
- Point 3: Green Mountain began forming a handle in February 2009.
- Point 4: The price climbed out of that handle in March 2009 in heavier-than-normal volume—soon after the general market itself shifted back into a confirmed upward move.
Green Mountain went on to notch a gain of almost 250% in the next 13 months. Many stocks notch double- or triple-digit gains after clearing the cup with handle, so it is a formation to always be on the lookout for in a stock that already has outstanding fundamentals.
And as noted in the main article here, whenever a stock you buy falls 7% from its buy point—even if it breaks out of a seemingly proper base—sell immediately to avoid big losses.