Using the Arnexa Retirement Planning Tool in Google Sheets
by Sridhar Ramakrishnan
The founder and CEO of financial tool producer Arnexa describes their retirement planning calculator.
Arnexa is a company based in Silicon Valley, California, that helps users prosper financially through smarter tools and information. Our flagship tool is a savings app that nudges people to save more using ideas and principles from behavioral economics, gamification and social feedback. A smart retirement calculator, described here, is our second tool.
Retirement planning for most of us is a bit like playing multidimensional chess and requires us to answer (at least) two very difficult questions:
- “What will your expenses be during retirement?” People find budgeting difficult for expenses today, yet we ask them to estimate their expenses decades out when their spending patterns may be very different from today.
- “What will your investment returns be during retirement?” The higher the market returns, the less we need to have saved away!
At Arnexa, we have come up with a simple, yet powerful, retirement calculator that does not require the user to answer such difficult questions. Instead, we ask users to provide answers that are knowable and precise, and we provide a framework and tools to help them provide answers with precision.
In the next section, I discuss how the Arnexa Retirement Calculator tool works and, specifically, how it overcomes the shortcomings of the existing retirement calculators. After that, I walk through various components of the calculator. Lastly, I discuss future work we will do to improve the tool and conclude with a summary.
How the Arnexa Retirement Calculator Works
The Arnexa Retirement Calculator leverages powerful and innovative algorithms and computing infrastructure to address the shortcomings noted above.
Leverage Cohort Data
Consider the problem of how one may estimate their expenses in retirement. One obvious answer is: “Ask those who are already 65 and older.” We do just this by collecting public data from government sources such as the Bureau of Labor Statistics (BLS) that provides information on expenses and incomes broken down by age (and other demographic attributes).
The goal is to find the closest cohort for which we have quality data that may be used in helping a given user to estimate their data more accurately. By leveraging cohort data (group data), we have transformed a problem that was intrinsically hard for a given user into a simple data entry problem.
Timing Is Everything
Most existing calculators ask the user to estimate the average annual return on their retirement accounts. There are numerous problems with this approach: Even if the user could do this well, returns are fundamentally dependent on the asset class in general (stocks, bonds and cash and equivalents deliver different returns) and on the user’s asset allocation, in particular. But there is an even bigger problem.
What matters during retirement is not the average annual return but where the negative years appear in retirement because of concomitant withdrawals. Figure 1 shows this visually. Return 1 (on the left) shows the annualized returns for the S&P 500 index (including dividends) for the 35-year period starting in 1982 and ending in 2016. Return 2 is a simple permutation where the three negative years appear toward the beginning in year two. Both Return 1 and Return 2 have identical averages (and medians).
|
Return 1 |
Return 2 |
|
14.07% |
19.31% |
|
16.59% |
–10.05% |
|
... |
–12.92% |
|
... |
–23.02% |
|
–10.05% |
... |
|
–12.92% |
... |
|
–23.02% |
... |
|
... |
... |
|
... |
... |
A user who commences retirement with sequence Return 1 will have a better outcome than a user who commences retirement with sequence Return 2 (all other things being equal). Informally, this occurs because in Return 1, the user’s assets grow in the early years and compound. They have grown enough such that when the bad years hit, they already have a large enough nest egg to weather the storm. In Return 2, they are hit with bad years almost immediately. The gains in the following years cannot overcome the initial losses.
The Arnexa Retirement Calculator does not ask the user for return averages. Instead, we allow the user to model their retirement asset environment in terms they can understand. First, we ask the user to classify their assets in three buckets—stocks, bonds and cash (each asset type has very different expected and historical returns). Second, the user can envision different market conditions during retirement: Very Poor, Poor or Average. Our system runs through tens of thousands of different retirement simulations, each representing a complete retirement period for the user based on their chosen asset allocation. Simulations are sorted from worst to best (in terms of end retirement balances).
A “Very Poor” environment is one set at the 10th percentile—meaning that 90% of the simulations generated better results than the chosen one. A “Poor” environment is set at the 25th percentile—meaning that 75% of the simulations generated better results. An “Average” environment is set at the 50th percentile.
By default, our tool starts out in “Very Poor” mode so the user will see what happens if the market performs very poorly when they retire.
Important note: The Arnexa Retirement Calculator does not forecast the markets. Instead, we run simulation algorithms using historical market data for the actual user asset allocation. We currently model three assets:
- Equities are modeled using the S&P 500 (with dividends),
- Bonds are modeled using 10-year Treasuries and
- Cash and equivalents are modeled using three-month Treasury bills.
Data for all indexes has been obtained from http://people.stern.nyu.edu/adamodar/
Insights That Educate and Drive Change
The purpose of a calculator is not just to calculate. It is to induce change in the user today so that their desired future comes to fruition at retirement. The Arnexa Retirement Calculator surfaces key knobs in the tool so that the user can vividly see the impact of various choices on their retirement solvency. These are:
- Asset allocation strategies. Several allocation strategies are preloaded (an equity-heavy one recommended by John Bogle, the founder of Vanguard), a bond-heavy one (similar to an asset allocation recommended by Ray Dalio), etc.
- Taxes. Most calculators ignore the taxes that must be paid by the retiree. Yet, this has a huge impact on their overall retirement solvency. The Arnexa Retirement Calculator shows the user cohort data for what others 65 years and older pay in annual taxes (answer: 8.3% effective tax rate) and we set the default appropriately at 9%.
- Fees. Most users do not think about (or understand the importance of) investment fees. Retirement account fees can vary widely depending on the investment choices made. We push the user to find the fees that are levied on their accounts and to report that number in our tool. The user can see the impact of raising and lowering the fees. Changing the fees from say 0.75% to 1.50% can change retirement solvency dramatically. So, the key lesson is that fees matter!
Our hope is that once users internalize these numbers, they make more informed asset allocation decisions both to lower fees but also to generate better returns.
Using the Arnexa Retirement Calculator
The Arnexa Retirement Calculator tool is available for free as an add-on to Google Sheets. (It will also be available on the Arnexa website and mobile app shortly.) Using it is super simple and proceeds in six simple steps.
Step 1: Install the Tool
The tool can be installed from a desktop browser at the Google Chrome web store. Users just need to click on the link provided. Once at the Arnexa Retirement Calculator page of the Chrome web store (not to be confused with the Google Play store for Android apps), they can click on the ‘+Free’ blue button toward the top right of the screen and then follow the on-screen instructions. A few seconds after installation completes, the user should see the Arnexa Retirement Calculator show up in the Add-ons menu.
Once installed, the user should click Arnexa Retirement Calculator → Setup. The tool will start crunching and shortly the user should see a bunch of worksheets automatically added to their spreadsheet.
A Google account is needed to use the tool. If a user does not have one, it’s easy to set one up for free at Gmail or Google Accounts.
Users should become familiar with the Add-ons menu by looking through the Arnexa Retirement Calculator item within. They should see the following actions within the menu:
-
Setup—this gets them set up with all of the worksheets needed to run the retirement calculator. It takes a minute or so to run as it pulls in the latest worksheets prefilled with default data.
-
Analyze—this is the main command that users will run each time after modifying the data to see how your retirement scenario stacks up.
-
Clear Results—this command will clear out data from a previous run of the tool.
-
Show Tips—this command will provide quick tips on running the tool.
-
Display Id—this command will display an Arnexa Id that users can use to send Arnexa problem reports.
-
Reset Everything—this command will wipe out all user data, delete all the worksheets and recreate them from scratch.
The spreadsheet should have the following six worksheets: Start, People, Inflows, Assets, Expenses and finally ExpenditureSurvey. Let’s walk through each.
Step 2: People Worksheet
Let’s skip the Start worksheet and proceed to the People worksheet. This is where users enter information about themselves and their spouse/partner, if any. No spouse/partner? No problem, just uncheck the box.
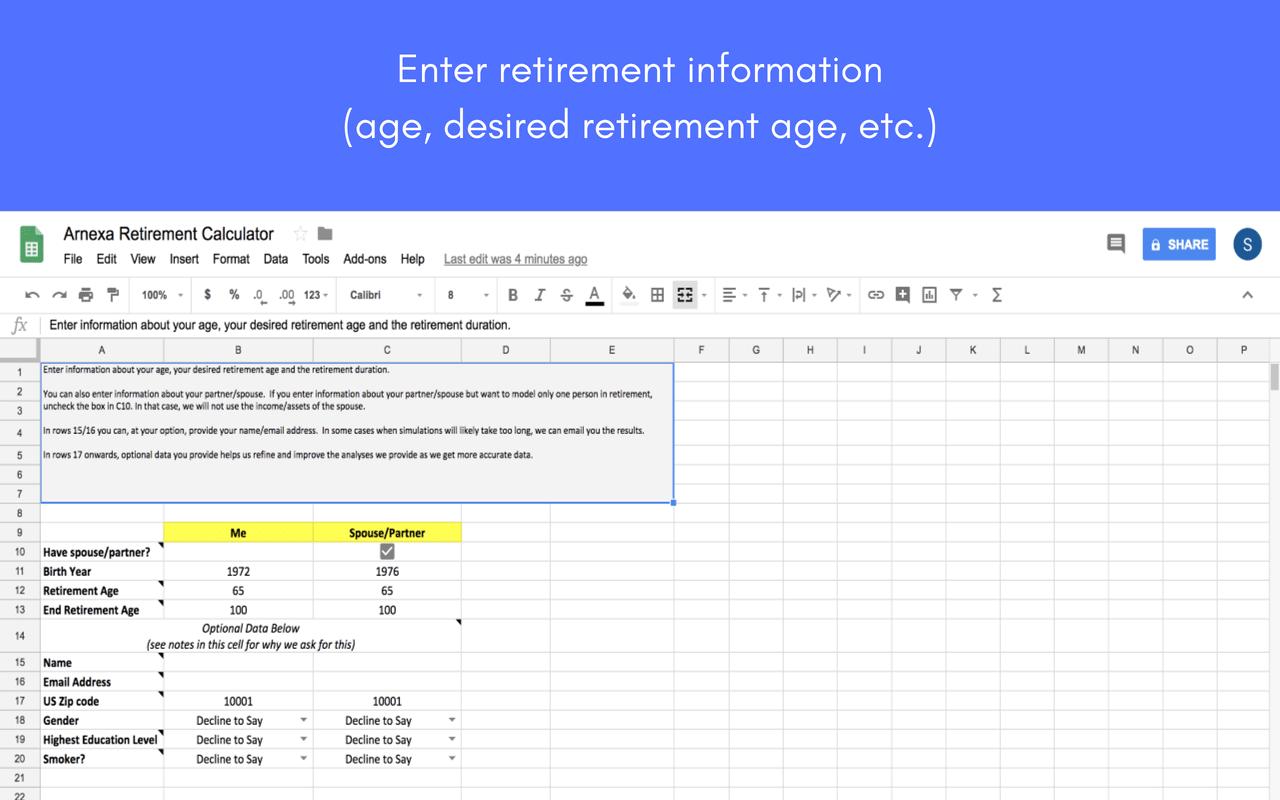
Data is simple to enter: year of birth, desired retirement age and duration of retirement. We have chosen the default of 100 years as the end retirement age both because it’s a nice round number (more time to spend with kids and grandkids) but also in anticipation that medical breakthroughs in the next several decades might increase longevity.
Step 3: Assets Worksheet
In the Assets worksheet, users enter information about the assets they expect to have at the time of retirement. This is the worksheet that users will keep coming back to tweak and improve as they accumulate more assets and become smarter about investments.
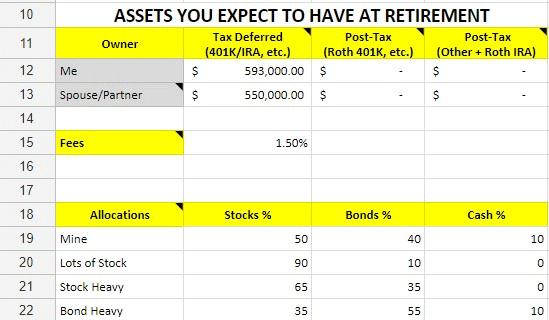
There are three sections in this worksheet:
- Assets. Users enter their total assets broken down by tax status and by person (whether the asset is owned by spouse/partner or not). The tax status is important because we estimate tax expenses for withdrawals from tax-deferred accounts.
- Fees. Users enter a single number that represents the aggregate fees they pay as a percentage of their total assets each year. The default of 1.5% is reasonable for small-employer 401(k), 403(b) or 457 plans. This default changes over time as our tool gets smarter as more people enter the fees they pay.
- Allocations. Here users specify how their assets are broken down between stocks, long-term bonds and cash. Over time, we may add new asset classes. The row titled “Mine” should reflect the users’ own asset allocation. Other rows may reflect other asset allocation strategies that they’d like to try.
Step 4: Inflows Worksheet
The Inflows worksheet is where users enter information about the income streams available to them at retirement. We have listed lots of possible income streams so that users can think through the ones that apply to them—not just Social Security. Users indicate the owner of the income stream, the years when this income stream is available and the monthly amount.
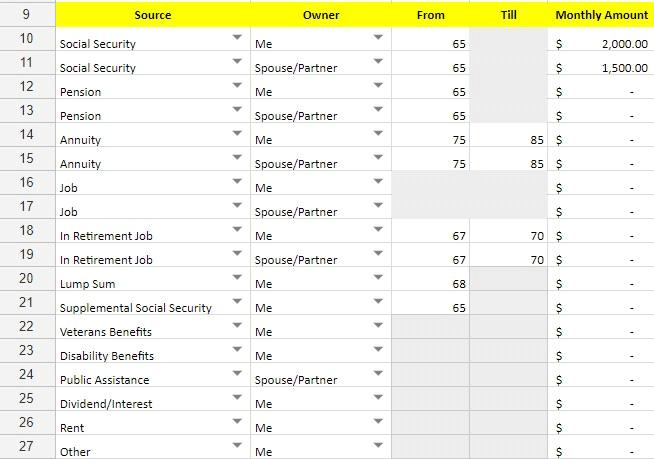
This is another place where cohort data plays a huge role in helping the user enter smarter data. Consider, for example, that the user runs the tool and no matter what they try, they still come up short: They are not able to make it completely through retirement without running out of money. Should they consider working during retirement (perhaps, even making money from some hobbies they may have)? Looking at the cohort data (65 and older) shows that approximately 40% of retirement income comes from wages and self-employment income. Hence, working during retirement to generate additional income is a perfectly acceptable mechanism to meet and bolster retirement financial security.
Notice also that the Arnexa Retirement Calculator tool forces the user to work through their income streams from the bottom up. They should log in to their Social Security website and get concrete numbers of the Social Security payment due to them. This bottom-up approach is crucial to get smarter and more knowledgeable answers. Other calculators adopt a lazy approach asking one to specify simply that their retirement income is some fraction of their last income prior to retirement.
Step 5: Outflows Worksheet
In the Outflows worksheet, users enter the expenses they expect to incur during retirement. Again, no lazy estimation in our tool. Users run through the various line items thinking through each expense and estimating it.
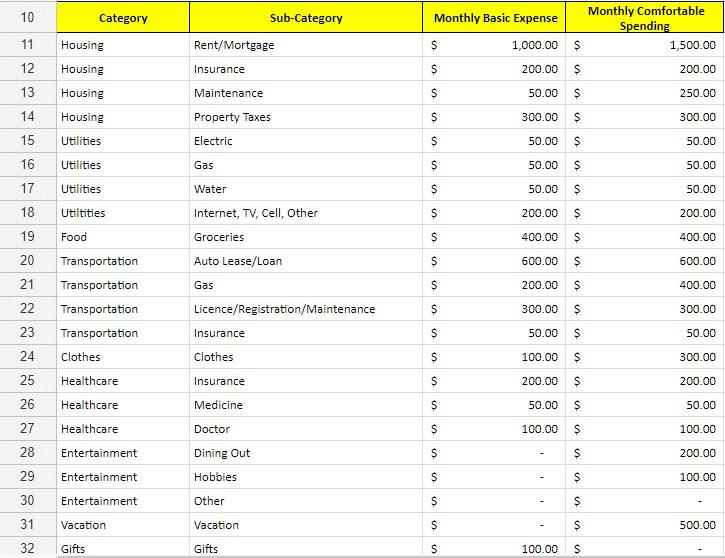
We have listed numerous categories of expenses because we don’t want users to forget crucial expenses. The two columns of “Basic” and “Comfortable” come from Tony Robbins’ book “Money: Master the Game” (Simon & Schuster, 2014). Basic refers to expenses that are musts (taxes, loan payments, rent, food, health care, etc.). Comfortable refers to discretionary expenses. Users can focus on developing a plan to handle a comfortable expense scenario once they have successfully developed a plan to handle the basic expense scenario.
Cohort estimates here again prove immensely valuable. If a user is not sure what expenses they should enter, they can easily see what others 65 and older are paying for various categories of expenses in the “ExpenditureSurvey” worksheet. Health care is especially crucial to get right, as we know that these expenses will become larger as we age.
Step 6: Start Worksheet
Now the core data has been entered. In the Start worksheet, users can control the scenario parameters and “what if” experiments they want to perform. They can run the Analyzer (from the Add-ons menu select Arnexa Retirement Calculator → Analyze).
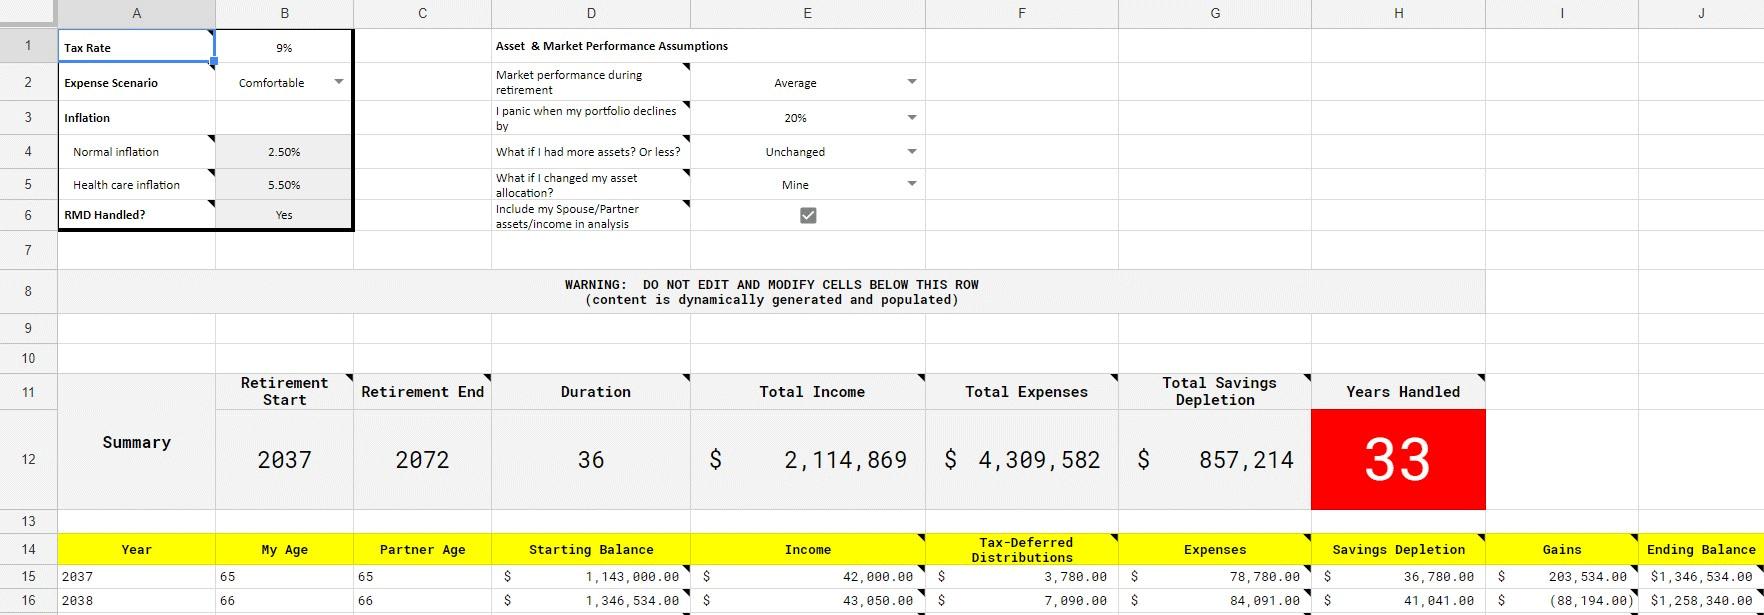
Here are a few crucial things about the parameters that can be controlled by the user in this worksheet:
-
Specify the effective tax rate that they expect at retirement. If a user has no clue as to how to estimate it, they can again leverage cohort data in the ExpenditureSurvey worksheet that shows the data for the 65 and older population. They can see that the average retiree pays an effective tax rate of approximately 8.3% (federal, state and local). So, they can enter this as a first approximation and refine this as they get more information.
-
Choose the expense scenario they want to evaluate—whether basic or comfortable, as described in Step 5 above.
-
Specify the market condition they wish to evaluate. This is perhaps the most crucial of the parameters. Returns during a user’s retirement may be great, average or terrible. It is unknowable now what the markets will do during one’s retirement. So, we allow the user to evaluate three different market conditions: What if the markets perform very poorly, poorly or just average?
-
Change the asset allocation used.
-
Quickly see what having more or fewer assets does for their retirement outlook. Likewise, if they are doing great at the current forecast level of assets, what would having 25% less do? They can quickly run these other scenarios with a click of a button.
-
In the future, users will also be able to set their “panic threshold”—the threshold of market decline at which users can no longer bear the pain and exit their equity positions and move assets to bonds or cash. We don’t do anything with this currently. Emotion modeling will be added in a future release.
-
If users have added information about their spouse/partner, they can easily see how well they are able to run through retirement with or without their incomes and assets.
Future Work
We already have a long list of enhancements that we’d like make to improve our tool. A few of these are:
- Add additional asset classes such as real estate, international/emerging markets, commodities, etc. Our tool can easily accommodate new asset classes. The challenge is to get historical data dating back to 1927 (or earlier) for each index that we add.
- Deepening cohort data so that data entry “wisdom” for users continues to improve.
- Making the retirement tool available on the Arnexa website, as part of the Arnexa mobile app, and/or even as part of financial partner websites and apps.
Our tool makes one (unreasonable) forecasting demand on the user: We ask them to estimate the assets they will have at the start of retirement. For users who are decades away from retirement, this is a difficult estimation problem. This is something that we plan to address in a future version of our tool.
Summary
The Arnexa Retirement Calculator advances retirement planning by using state-of-the-art technology in a simple spreadsheet. It makes it easier for users to enter data by not asking them fundamentally difficult forecasting questions in areas of investment returns and expenses. It pioneers an approach called cohort-guided data entry by leveraging cohort data to enable users to enter more accurate data. Powerful algorithms drive our analysis engine that enables us to model complex scenarios to take into account critical factors such as asset allocation, taxes and fees.
For more information, please visit the Arnexa website.