Ratio Analysis in Stock Investor Pro
Companies of interest can be identified through a variety of methods in Stock Investor Pro. Once you have a company that you are interested in, you can use ratio analysis to dig deeper into the company’s fundamentals to make judgments about its profitability. In this month’s Stock Investor News, we discuss some common financial ratios and demonstrate how to use SI Pro to view and compare these ratios and print out a ratio analysis report.
What Are Financial Ratios?
Ratio analysis is a simple quantitative tool for looking at financial data that offers easy comparability over time periods and between companies. Ratio analysis involves dividing a numerator by a denominator. For example, in the case of the current ratio the numerator is current assets and the denominator is current liabilities, both of which can be obtained from the company’s most recent balance sheet. While ratios are easy to calculate, they have some inherent weaknesses. One weakness is that by themselves, they are not particularly useful. A reference point is needed to give perspective, such as the ratio for the prior year or the average for the firm’s industry. Additionally, different accounting methods and seasonality may drastically change ratio values.
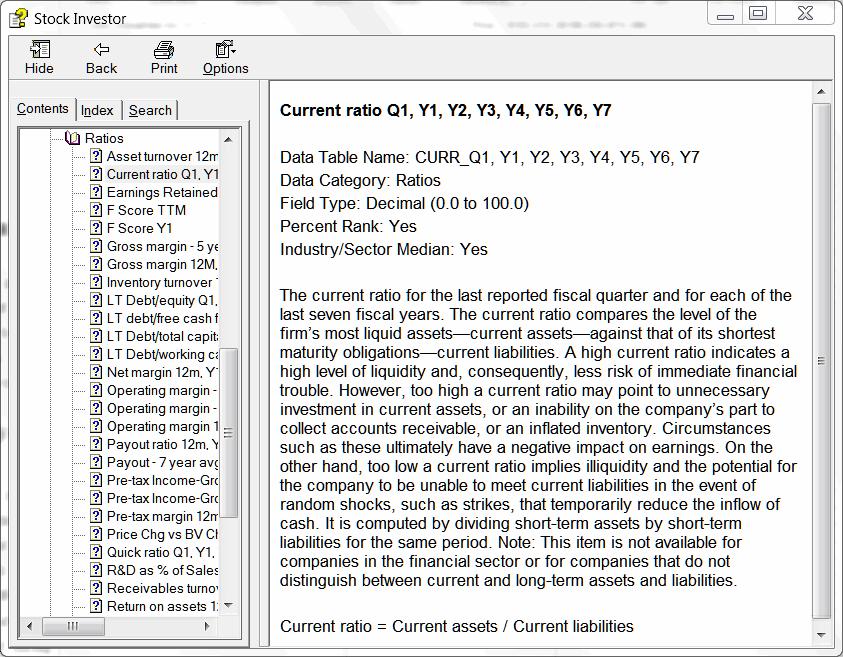
For more information on understanding financial ratios, please refer to the contents and index section under the help menu in the program. Click on Field Definitions, then Field Definitions by Category and choose ‘Ratios’ from the list. Click on a specific ratio to see a description of the figure and how it is calculated. Additionally, you can bring up articles at AAII.com by searching for “ratio analysis” in the custom search box at the top of the home page. One article you may find helpful is “16 Financial Ratios for Analyzing a Company’s Strengths and Weaknesses.”
Viewing the Ratios Page
Stock Investor Pro offers views into the most popular of the ratios for each company, although not all ratios may be available for all time periods. The ratios that are included on page one when you print the ratio analysis report are the gross profit margin, operating margin, net profit margin, return on assets, return on equity, quick ratio, payout ratio, current ratio and the times interest earned ratio. There are a few less commonly used ratios shown in the company tabs and on page two of the report such as the payout ratio and the receivables turnover ratio, among others.
To find the ratios for a particular company, first select the company by searching on its ticker from a new notebook or choosing a company from a list of results from running a screen. Once you’ve selected a name, simply highlight the company in yellow by clicking in the row. A number of tabs will be shown across the top, one of which is labeled Ratios. Click on this tab to open the ratios page.

The ratios page has dates across the top (below the tabs) and fields down the left side. For each ratio you are given four pieces of data. For example, the first ratio is gross profit margin. You are first given the gross profit margin for the company, then percent rank of the company’s gross profit margin relative to all other companies in the database. Following that are the gross profit margin averages for the sector and the industry in which the company operates. Moving from left to right, you can see what the gross margin is currently and historically, from the most recent fiscal year to seven fiscal years ago.
This data is not currently exportable, so you will have to recreate the data in another format if you wish to do further research on these calculations.
Generating a Ratio Analysis Report
Printing is accessed either via the file menu or by clicking the print icon. The reports window will launch with the available reports listed in the window. Select Comprehensive Company Report – Selected Company and then click Preview. A new window will pop up that offers a number of preferences that you can checkmark if you want included in this report. For the purposes of this example, we check only “ratios” in the second section and then click “ok.” The ratios analysis report is generated in a new window.

The report shows the company name and symbol in the top left. Common ratios such as operating margin, return on assets (ROA) and the quick ratio (among others) are shown. Additionally, the data is shown for each year going back seven years from the most recent quarter end. The ratios are ranked by percent against all other companies. Also, the sector and by industry averages for each ratio are shown by year. This offers a unique insight not available to non-subscribers.
Within Stock Investor Pro, the ratio analysis tools offer a unique and deeper understanding of company performance available at your fingertips.