Stock Investor Pro Valuations: Estimating a Stock’s Fair Value
As investors, we are trying to maximize our financial return when we buy assets such as stocks. Valuation is at the heart of investing. Perhaps the quickest way to fail as an investor is to consistently overpay for assets. Therefore, one way to succeed in investing is to buy stocks that are trading at an attractive price relative to their “intrinsic value” (more on that term in just a bit). Common sense dictates that investors should buy stocks when they are cheap and sell when they are rich. However, while this may be a simple principle, determining a company’s fair market price or intrinsic value is far from easy.
In this installment of Stock Investor News, we discuss some of the valuation models presented in Stock Investor Pro, including the assumptions underlying these models that are built into a stock’s price and how you may use them to identify potentially undervalued (or overvalued) stocks. It is important to remember that these are just models and that not all valuation methodologies are created equal. Additionally, no single method applies to all companies or works in all market conditions. Some valuation methodologies are more appropriate in certain circumstances and not in others.
Price Versus Intrinsic Value
The price of a security is based on a number of factors: the prospects for the company, the current overall market sentiment (including periods of fear and greed), supply and demand for the shares, liquidity of the shares, and the market in which the shares trade, just to name a few. Intrinsic value, on the other hand, is what we think the company is worth independent of transitory factors that may be currently influencing the price.
Valuation is an exercise where we determine what a company is worth and whether the price is reasonable relative to this intrinsic value. There are a couple of overall approaches to valuation: relative valuation and absolute valuation. In relative valuation, we are looking at the price in relation to some underlying fundamental or alternative measure of value, such as income statement or balance sheet figures. These relationships have meaning when viewed over time or in relation to similar securities or the market as a whole. One of the most common approaches that individual investors use is examining price-earnings ratios, price relative to some measure of the firm’s accounting earnings.
Absolute valuation is a process by which we assess, independently of price, the current intrinsic value of the company. Absolute valuation methods include discounted cash flow methods (e.g., discounted dividends or free cash flow), asset-based methods and residual income methods. In absolute valuation, you are interested in determining the value of the company without reference to its current price. You determine the value independently and then compare it to the current price to determine if there is sufficient expected return.
The models will we be discussing from Stock Investor Pro offer absolute valuations that we can compare to the current price of the shares to get an idea of whether the stock is undervalued, fairly valued or overvalued.
Valuations Tab
Stock Investor Pro includes a tab on the Stock Notebook devoted to valuation models. Figure 1 shows the Valuations tab for Ritchie Bros. Auctioneers (RBA) with data as of May 24, 2016.
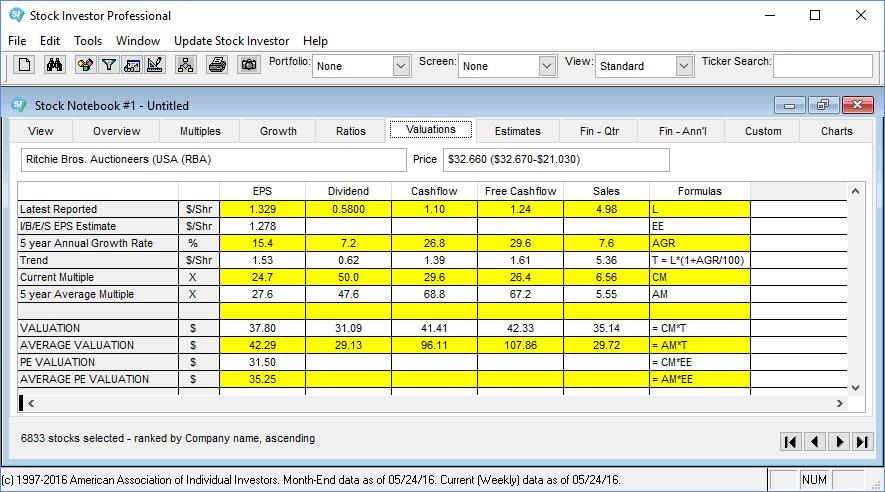
The Valuations tab uses popular multiples such as the price-earnings ratio (P/E), coupled with historical and projected growth rates to determine benchmark price valuations. Valuations are meaningful for a wide range of company situations and can help determine which primary factors are influencing a company’s stock price. The Valuation tab provides valuation models based on earnings, dividend, cash flow, free cash flow and sales.
Valuation Calculations
Stock Investor Pro includes four absolute valuations based upon earnings and two valuations each for dividends, cash flow, free cash flow, and sales. The formulas used in the calculations are displayed on the Valuations tab of the Stock Notebook in the far-right column, and also appear when Valuations are included in the Company Summary report.
A simple projection of per share earnings, dividends, cash flow, free cash flow, and sales is calculated in the Trend row. The Latest Reported row (represented by the “L” in the Formulas column on the far right of the Valuations tab) uses per share figures for the last four fiscal quarters (trailing 12 months), which are projected out one year (T) using the historical five-year annual growth rate (AGR). If a company does not have a five-year historical growth rate for a given income statement or cash flow statement item, a trend (T) will not be available.
For example, basic trailing 12-month earnings per share for Ritchie Bros. was $1.329 as of its latest quarter ending December 31, 2015. Increasing or growing this trailing 12-month earnings figure by the company’s the five-year annual earnings growth rate of 15.4% leads to a one-year projected (Trend, or T) earnings figure of $1.53 per share [1.329 × (1 + 0.154)].
There are numerous assumptions underlying this simple projection, notably the latest figure must be representative of a normal period and the growth must continue in a stable and predictable manner. Normally, dividends will expand in a consistent pattern, but earnings, cash flow and even sales can be quite variable from period to period. Investors must take seasonal, cyclical and product life-cycle patterns into account when judging the reasonableness of the trend estimates.
Looking at the I/B/E/S EPS Estimate figure for Ritchie Bros. in the EPS column of the Valuations tab, we see that analysts do not believe earnings will maintain the same average growth of the last five years. In fact, analysts polled by I/B/E/S are expecting earnings for the current fiscal year to fall to $1.278 per share from the current trailing value of $1.329 per share and below our Trend (T) figure of $1.53 per share.
The Current Multiple (CM) row provides an indication of the expectations embedded into the stock price. Companies with higher expectations will trade with higher multiples to earnings, dividends, cash flow and sales. As expectations increase, multiples expand, raising the stock price supported for the given level of earnings, dividends, cash flow or sales. At times, the market gets ahead of itself, leading to overvaluation. When reality catches up with overzealous expectations, downward adjustments are made to multiples and prices, even if on the surface, factors such as earnings increase.
The first Valuation row of the Valuations tab multiplies the current multiple (CM) by the projected “trend” variable (T) to calculate the fair market price (CM*T in the Formulas column). Valuations are calculated only for companies with positive figures for the latest reported items and a five-year growth rate (positive or negative). The $37.80 earnings (EPS) valuation for Ritchie Bros. is determined by multiplying the $1.53 earnings trend figure by the current multiple (price-earnings ratio) of 24.7 (manual calculation differs slightly from Stock Investor Pro due to rounding of underlying figures).
Beyond assuming that earnings will continue to grow over the next year at the same rate that they have over the past five years, this valuation assumes that the relationship between price and earnings will stay constant.
Comparing current multiples against industry and historical norms helps to indicate if the stock valuation is out of kilter. In essence, the price-earnings ratio indicates the dollar amount an investor can expect to invest in a company in order to receive one dollar of that company’s earnings. In general, a high price-earnings ratio suggests that investors are expecting higher earnings growth in the future compared to companies with a lower price-earnings ratio. A low price-earnings ratio can indicate either that a company may currently be undervalued or that the company is doing exceptionally well relative to its past trends. Ritchie Bros.’ current price-earnings ratio of 24.7 is a bit high when compared to both the median of 19.6 for the capital goods sector and to the miscellaneous capital goods industry’s median of 20.4. Based on its price-earnings ratio, the market seems to see stronger long-term growth potential for Ritchie when compared to its industry and sector.
Below the Current Multiple row on the Valuations tab is the “5 year Average Multiple” (AM) row. The five-year average multiple serves as a base to help determine whether the current price has deviated too far from its past relationship to sales, earnings, cash flow, free cash and dividends. Ritchie’s current price-earnings multiple of 24.7 is slightly lower than its historical average of 27.6. Multiplying this average multiple (AM) by the projected income statement variable (Trend, or T) forms the basis for the Average Valuation (AM*T). Ritchie’s average EPS valuation is $42.29, 30% higher than the May 24, 2016, closing price of $32.66.
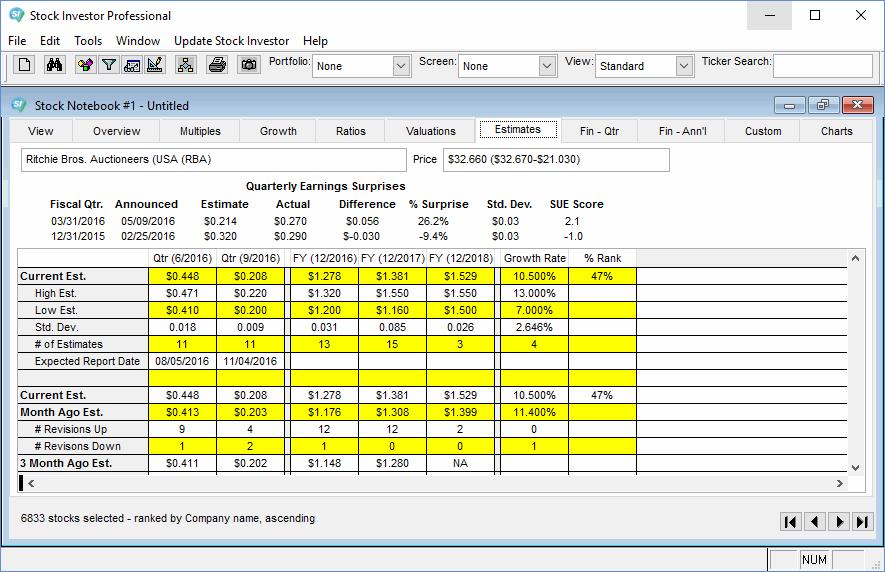
Two additional valuations provided under the EPS column use I/B/E/S earnings estimates found under the Estimates tab (shown in Figure 2) in place of the simple trend-generated estimates. These valuations are calculated by multiplying the consensus estimate for the company’s current fiscal year (EE) by the current multiple (CM) and the average multiple (AM), respectively. The $1.278 per share consensus earnings estimate represents the projection for the fiscal year ending December 2016. As seen in the Valuations tab from Figure 1, this estimate is below the simple projected trend of $1.53 per share (T). Using the consensus estimate of $1.278 per share leads to a $31.50 PE Valuation based on the current multiple (CM) ($1.278 × 24.7) and $35.25 Average PE Valuation based on the average multiple ($1.278 × 27.6).
The Valuations tab provides a quick look at a stock’s appeal. However, the merit of this data does not rest within the calculated fair market estimate values, but rather in getting a feel for the assumptions built into the company’s stock price. Extraordinary gains come when you place a bet against the general consensus and are correct.