How Big of a Concern Is the Inverted Yield Curve and Negative Interest Rates?
by Brian Haughey
Inverted yield curves can precede a recession, and negative interest rates remove a traditional income source for risk-averse investors. Find out if you need to take action.
We are living in interesting times.
In July 2019, the Federal Reserve cut its overnight lending rate for the first time since 2008. The Treasury yield curve has been inverted several times recently, and, as we saw in the interview with Campbell Harvey (“Bond Yields’ Role as a Recession Warning Signal,” May 2019 AAII Journal), this phenomenon is often a harbinger of a recession.
 Meanwhile, Bloomberg reported at the end of August 2019 that more than $17 trillion of global debt (including 30% of all investment-grade securities) carried a negative yield, meaning that investors who hold such debt until maturity are almost certain to suffer a loss. This is an unprecedented situation since, as noted bond commentator James Grant has observed, never before in 5,000 years of recorded history have we had sub-zero rates.
What Is “The Yield Curve?”
Lenders of money have two major concerns. The first, naturally, is the likelihood of being repaid, which is related to the borrower’s creditworthiness. The second concern is the loss of purchasing power of the repaid principal, due to future inflation. The rate of interest that a lender charges, therefore, needs to address these risks in addition to providing a reward for lending or, as an economist would say, for deferring consumption. Conventionally, therefore, the interest rate on a loan is considered to have three components: the base, or real, rate of interest that compensates for deferring consumption, a premium for expected inflation and, for risky loans, an additional premium for credit risk. (The inflation premium can be considered as including an element that compensates for the maturity of the investment, and the credit premium as including a component to compensate for liquidity risk).
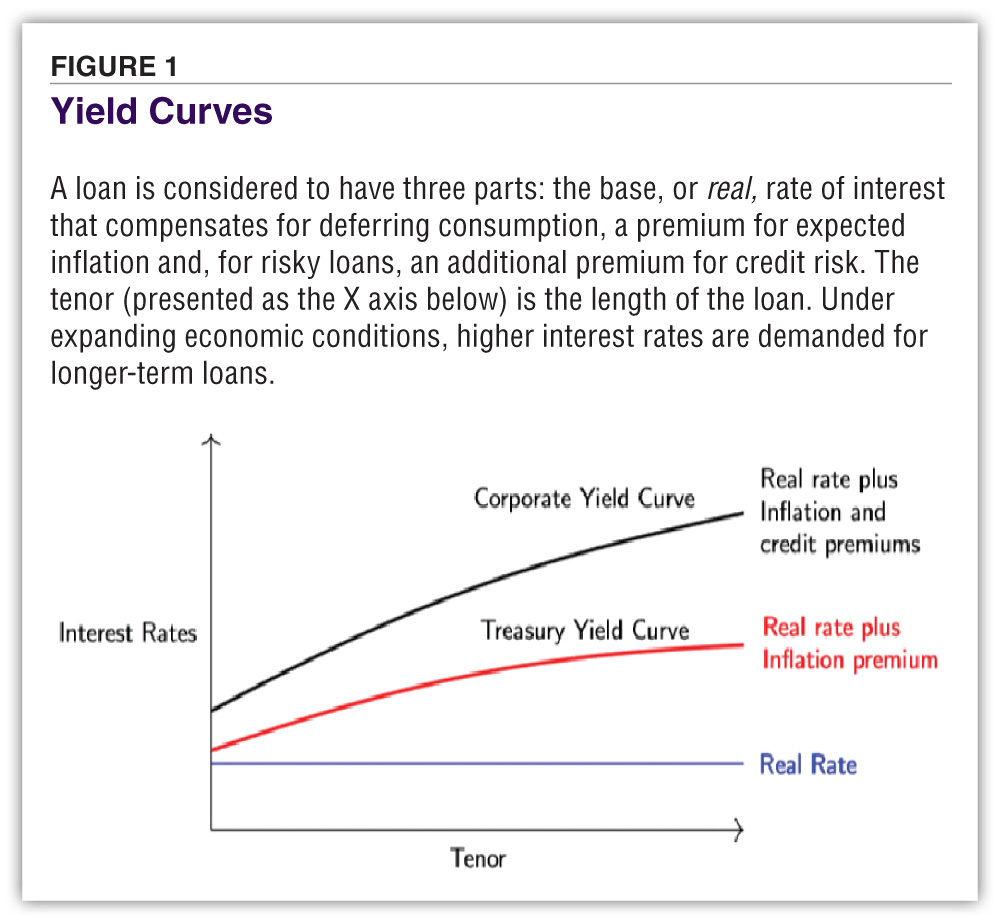
Just as car insurance premiums are set using risk-based pricing—with those drivers perceived to be riskier being charged more than their safer peers—the interest rate charged on loans, or demanded on bonds, is a function of expected inflation and credit risk. Since securities issued by the U.S. Treasury are considered to be free of credit risk, because the government can levy taxes—or, in extremis, simply print money—to repay its loans, there is no credit premium associated with them. However, these securities (called notes if their term is up to 10 years and bonds if they have longer terms) still expose the investor to inflation risk. And since risk (including inflation risk) usually increases with time, longer-dated notes and bonds usually carry higher interest rates than shorter ones. We can plot the interest rate on Treasury instruments (such as the three-month and 12-month T-bills, and notes and bonds with maturities from two years out to 30 years) against time, as shown in Figure 1.
Note that we can also plot the yields on corporate bonds, which include a premium for credit risk, to produce the “corporate yield curve.” In fact, there are several such curves, reflecting the yields on notes and bonds categorized by a particular credit rating, or by type of issuer, but in this article we focus on the curve for Treasury instruments, which is usually referred to as the “Treasury yield curve” or, simply, the “yield curve.”
Shape of the Yield Curve
The real rate of interest is a function of supply and demand, while the inflation premium depends on inflation expectations and usually increases with time because uncertainty also increases with time.
You can find current and historical U.S. Treasury yield curve data at the U.S. Treasury Department website in the Data section (www.treasury.gov/resource-center/data-chart-center/interest-rates/pages/textview.aspx?data=yield).
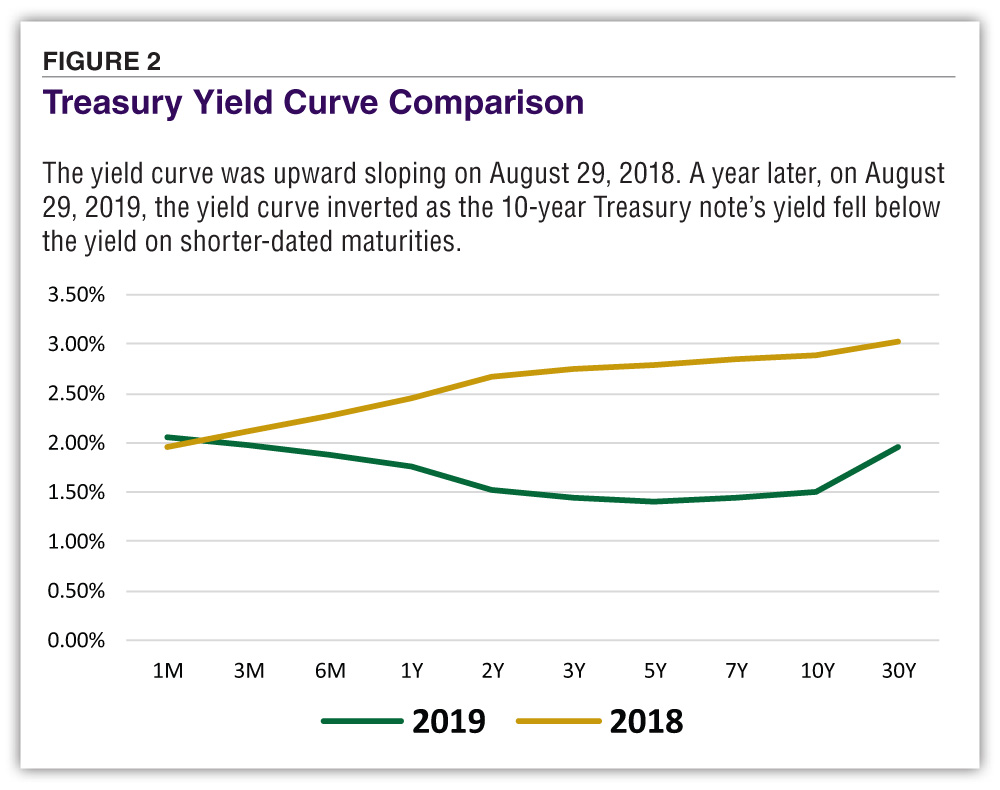
Figure 2 shows yield curves for August 29, 2018, and August 29, 2019. On August 29, 2019, the 10-year rate was 1.50%, lower than the two-year rate of 1.52%.
Why Does the Yield Curve Invert?
As with many economic phenomena, there are a variety of explanations for an inverted curve, but an intuitive one is based on expectations. Suppose investors think that interest rates are likely to drop in the future and remain low for several years. In that case, they may seek to lock in the current rate by buying, say, a 10-year note, prior to the anticipated rate drop. If this expectation is shared by many investors, who then decide to follow the same strategy, there will be an increase in the supply of cash available for 10-year notes, driving down the real rate of interest for that tenor, or maturity. This will be reflected in the market, with the increased demand for 10-year notes causing an increase in their prices and a corresponding decrease in their yields. (Remember, for most fixed-income investments, including Treasury notes and bonds, prices and yields move inversely).
Note that if some of these investors would, in other circumstances, have invested in short-term (for example, two-year) notes, then their move to 10-year notes will result in a reduction in the demand for—and therefore a decrease in the prices of—two-year notes, and so yields on two-year notes will increase.
These changes in demand that result in an increase in two-year yields and a decrease in 10-year yields will drive a flattening of the yield curve and, in extreme cases, result in an inverted curve.
Does an Inverted Yield Curve Herald a Recession?
As Harvey discussed, an inverted yield curve is often a harbinger of a recession. It is not, of course, that the inverted curve causes a recession, but rather that bond investors who anticipate a slowdown may shift their asset allocation, thereby causing the yield curve to invert.
There are various reasons that might lead an investor to expect lower rates in the future. During a recession, for example, economic activity slows down, with a concomitant reduction in the demand for credit. Companies respond by reducing their capital spending, and so have less need to issue bonds to finance their investment in assets, while reduced consumer spending also reduces the demand for credit. Inflation is also likely to decrease because of reduced demand for goods, reducing the inflation premium demanded by investors. Meanwhile, central banks such as the Federal Reserve generally respond to recessions by cutting short-term rates.
Since asset reallocations by bond market investors who anticipate a drop in rates can lead to an inversion of the yield curve, it’s not surprising that such inversions often presage recessions.
Why Might Inversion Not Signal a Recession?
While in the past an inverted yield curve has a good, although not perfect, track record of predicting recessions, it is possible that current expectations for low interest rates in the future may be based, at least in part, on other factors.
For example, faced with negative rates at home, foreign investors in countries such as Germany may choose to buy U.S. notes or bonds, placing upward pressure on prices and downward pressure on rates. Similarly, baby boomers in the U.S. nearing retirement might choose to reallocate from equities to fixed income, also placing downward pressure on rates.
 As we discussed, if investors expect low or negative inflation (the latter referred to as deflation) in the relatively near future, then the inflation premium that they demand will tend to decrease, driving down rates. An important question is whether this reduced inflation will be in response to an economic slowdown, as is typically the case, or whether this time there is some more benign cause.
One factor to consider is the unprecedented pace of technological change that is taking place. One can look at the “Amazon effect,” for example, to see the downward pressure on prices caused by the growth in online shopping. A related phenomenon is the ability of customers shopping in department stores or in car showrooms, for example, to use their mobile phones to compare the prices of displayed goods with those available at other locations. Along with the growth in U.S. energy supplies, this increase in price transparency and competition has helped to dampen inflation, while the growth in robotics, data analytics and machine learning, for example, are likely to make firms more efficient, also helping to curb inflationary pressures.
Negative Interest Rates
The current 10-year note in Germany pays no interest (the coupon rate is 0%). Investors who purchased the note when it was issued in July 2019 paid a price of 102.64 euros for a note that returns 100 euros in 10 years. Since there are no coupon payments, we can calculate the return to a buy-and-hold investor as follows:
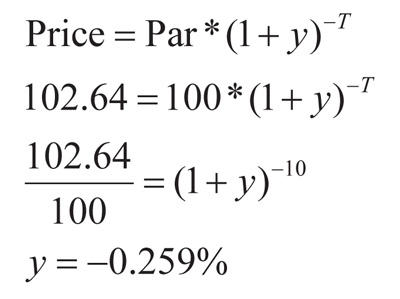
This means that an investor who purchased the note at issuance and holds it to maturity can expect to earn a return of –0.259% per year, losing 2.64% over 10 years. (On September 30, 2019, the German 10-year yield had dropped further, to about –0.57%).
Even if a recession were not to materialize, in a world where negative interest rates were common, risk-averse investors such as retirees who would traditionally invest in safer bonds to provide income would no longer be able to do so. They would instead have to move to riskier alternatives to seek portfolio income. This would be the same as insurance companies and pension funds that currently have been forced to assume significantly more risk than in the past in order to earn the return they require to fund their commitments.
 While institutional investors such as banks may be forced by regulators to purchase government securities, even those that offer negative returns, no one can currently force an individual investor to invest in securities that offer negative yields. Rather, we could simply keep our savings in a bank account, which traditionally never offered negative rates on deposits. However, that has the potential to change. In Denmark, for example, one bank is now quoting an interest rate of –0.75% on deposits in excess of 750,000 Danish kroner (slightly more than $100,000). We could conceivably keep our savings in paper money stashed under the mattress, but this is impractical and risky for all but trivial amounts.
However, we should note that in a deflationary world (one in which prices, on average, decrease), an individual investor could safely tap into their principal for income and still preserve purchasing power. There is little difference between earning a 4% return in a world where prices rise 2% a year, for example, and earning –1% in a world where prices fall by an average of 2.9% a year; in both cases the retiree will have the same effective purchasing power at the end of the year.
The Stock Market
Equity investors should remember that stocks typically benefit from falling interest rates, since the value of a stock is the present value of future earnings. If rates were to decrease, the present value would increase, all else equal. However, as we have seen, a drop in interest rates is often a response to—or a harbinger of—reduced economic activity. When a near-term recession appears to become more likely, stocks will turn bearish, so a further decrease in rates may have negative consequences for equities. Conversely, while a rate increase has negative consequences for stocks due to the reduction in present values that result, if that rate increase is accompanied by economic growth (for example, during emergence from a recession) then stocks and interest rates would tend to move in the same direction, with a rate increase being bullish.
Implications for Allocation Strategies
Whether the yield curve predicts it or not, the current economic expansion is destined to end. Prudent investors should monitor economic indicators to gauge the state of the economy and prepare their portfolios for a recession when one appears imminent. However, strategies that worked in the past may not be optimal in the future. For example, when a change in asset allocation appears warranted, moving from equities to cash rather than into bonds may be the more prudent option, given that arguably the bond market is currently riskier than it has ever been before. (I shall discuss this in a future article.)
Even buy-and-hold investors, who tend not to reallocate based on market expectations, should reexamine their asset allocation. The conventional advice from many financial advisers is to maintain a significant fixed-income allocation, with a 60% stock/40% bond mix often being recommended, while others recommend a “life cycle” strategy with an equity allocation of 100 (or 120) minus your age in stocks and the remainder in bonds. We should remember, however, that bond market performance has benefited since the early 1980s by a decline in rates; that decline is highly unlikely to continue to the same extent over the next 40 years, although it is too early to predict if rates will decrease and become negative or will begin to increase significantly. Nevertheless, the diversification benefit traditionally provided by bonds may be muted in the future and cash may, at least in the short term, be worth considering as part of the asset mix.
Retirees and others who depend on bond income should prepare for the possibility of a continued decrease in rates and the specter of negative rates. An allocation to dividend-paying stocks may be worth considering as an alternative to an allocation to bonds.
For investors who do wish to maintain a fixed-income allocation, it is noteworthy that the yield curve for municipals, for example for AAA and AA securities, remains upward sloping. On a tax-equivalent basis, these may prove attractive, particularly for investors in a high tax bracket such as those paying the top combined federal rate of 40.8%. For example, on August 29, 2019, AAA-rated 10-year municipal bonds yielded about 1.27%, equivalent on a tax-adjusted basis to 2.14%, an advantage of about 64 basis points (0.64%) relative to U.S. Treasuries.