

Related

Portfolio Strategies
An interview with the professor who developed the yield curve model for forecasting recessions.

Charles Rotblut leads a class in AAII's new Essential Investing Video Course. Go to https://www.aaii.com/ves for more information and to subscribe.
Campbell Harvey is a professor of finance at Duke University and a research associate of the National Bureau of Economic Research (NBER). His 1986 University of Chicago dissertation was the first paper to identify inverted bond yield curves as preceding recessions. We spoke in early April 2019, just after the yield curve inverted, about his model and how investors should interpret it.
—Charles Rotblut, CFA
As a bit of background for those unfamiliar with the concept, could you explain what the yield curve is?
First, there are different names for the yield curve. Sometimes it is called the term structure of interest rates. The idea is that there is no single interest rate in the economy. Obviously, interest rates are different across different risky investments, with a government bond having a different interest rate than a corporate bond. But if you look within one particular class—for example, government bonds—there are also many different interest rates. There’s an interest rate for a three-month Treasury bill (T-bill). There is an interest rate for a five-year Treasury note. There is an interest rate for a 10-year Treasury bond.
We often look at the shape of those interest rates. Usually, a shorter-term bond has a lower yield to maturity than a longer-term bond. So, we say that the term structure of interest rates, or the yield curve, is sloping upward (Figure 1). That simply means that the longer the maturity of the bond the higher the interest rate.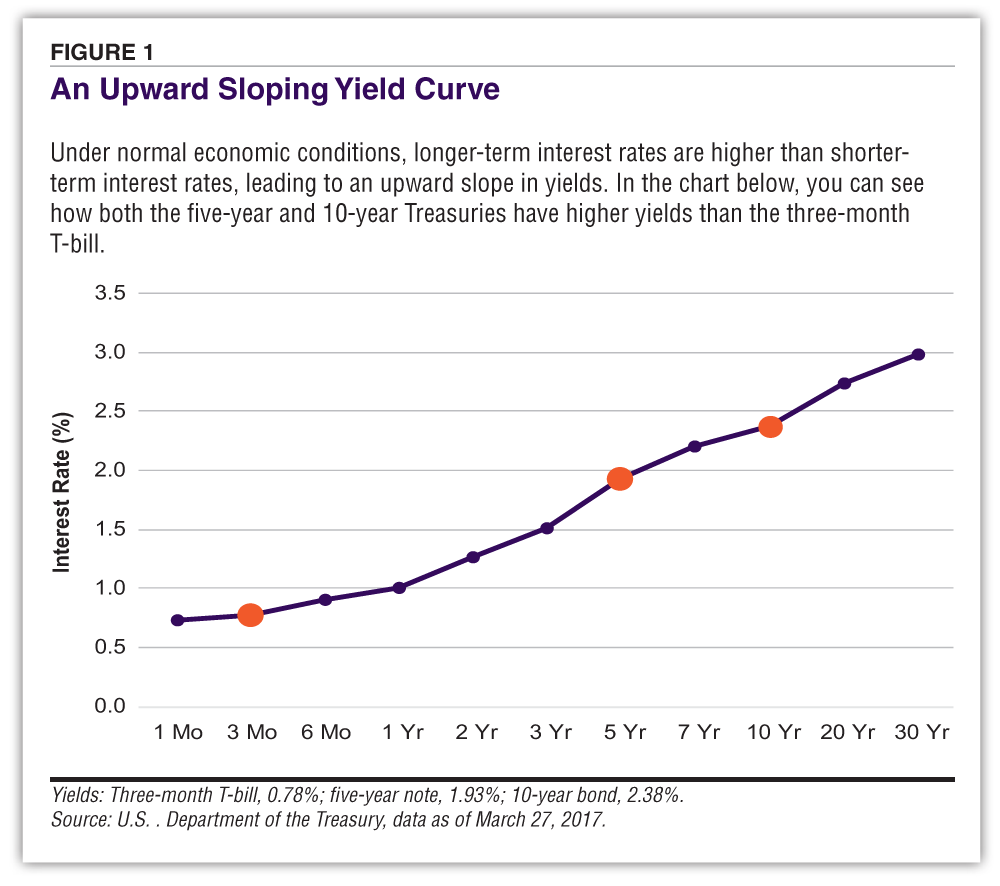
Sometimes the yield curve inverts with short-term rates being higher than the longer-term rates. You found a link between such occurrences and the economy.
The normal behavior for the yield curve is that short-term interest rates have a lower yield than longer-term interest rates. We see this all the time. If you go into your bank to buy a certificate of deposit (CD), you know that the rate is going to be higher if you go for five years versus one year.
The difference between the long-term and the short-term rates tends to vary through time and the business cycle. Sometimes the term structure is really steep. It is possible—not frequently, but possible—that the term structure becomes very flat or even inverted. Inverted term structures mean that the short-term interest rates—such as those for the three-month Treasury bill—are higher than long-term rates—such as those for a 10-year Treasury bond (Figure 2). Such occurrences are unusual because we usually think of a premium being paid to investors for locking their money up for a longer period of time. Investing in a longer-maturity bond is riskier than investing in a shorter-maturity bond.
 The usual behavior is upward sloping, but on rare occasions we get these inversions. In my dissertation at the University of Chicago in 1986, I showed that there is a predictive relation: When the yield curve gets inverted, it precedes economic downturns and recessions. My dissertation studied the four previous recessions from 1968 through 1986 and found that my model did a surprisingly good job at predicting these recessions. One of the things in my dissertation that my committee was impressed with was that this single variable—the difference between the 10-year Treasury bond rate and the three-month Treasury bill rate—could deliver precision in predictability that rivaled commercial econometric services, some of them with hundreds if not thousands of equations. The simple model did as well or better.
I was motivated by an idea that both stocks and bonds should have information about the future. If you think about a stock, it is basically the present value of the expected future profits of a company. It reflects what we believe will happen in the future. The bond is kind of similar but let me explain the differences. The stock market is notoriously prone to false signals. The joke is that the stock market has forecasted nine of the last five recessions.
Why does the stock market have all these false signals? If you think about what a stock’s price is today, it is the present value of the expected profits. But those profits are uncertain. Companies could be profitable or they could incur losses. We don’t know what the magnitudes are. We don’t even know how many years there will be profits for. And then we discount those profits with a discount rate that is appropriate for the risk of those cash flows. So, there’s a lot of stuff going on. If there is, for example, a surprise increase in risk, that could drive the stock market down and have nothing to do with the future course of the economy. The idea is that expected profits are correlated with the health of the economy. So, there are many reasons to think that the stock market is a very noisy predictor of real GDP (gross domestic product).
Now let’s compare the stock market with the bond market. Number one, government bonds are as close to risk-free as anything that we have. It is not a risky corporation; it is the government and we know the government can always pay off its nominal bonds. Even if the government got into trouble, it could literally just print the money to pay off the bonds. So, effectively, we don’t have this variation of risk that could cause false signals. Number two, bonds have a fixed maturity, such as 10 years. For a stock, who knows what that maturity is: It could be 10 years, it could be 100 years. We have no way of knowing. The bond is a fixed contract, such as 10 years. In addition, the bond has a coupon, and the coupon is fixed. That again makes a bond different from a stock. Stocks can pay dividends, but dividends are totally at the discretion of management. They are not fixed. They could be zero, and who knows how long they will actually be paid.
So that’s what motivated me to look at bonds. Bonds should reflect the future. If you think of what interest rates actually are, they have three components. An interest rate has a component that’s linked to expected inflation. Interest rates have a component that’s linked to the expected real rate of return. There’s also a risk premium that’s in the interest rates. So that expected real rate of return is what I focus on.
The expected real rate of return is closely linked by economic theory to real growth in the economy. And that’s how I theoretically show that there’s a relation between the slope of the yield curve and the future path of economic growth.
In your original research, did you just look at end-of-quarter data or did you look for yield curve inversions lasting a full 90 days?
In my dissertation, I thought it was important to match what I was forecasting—which is real GDP growth—with the interest rates. GDP is measured over a calendar quarter, so the interest rate measures that I looked at for the yield curve were calculated over a calendar quarter. Empirically, my model has done well in predicting recessions.
In response to my dissertation, you might have said, “Well, it’s only four recessions, maybe Campbell Harvey got lucky in forecasting those.” Often what happens with scientific research is that you publish the research and then all of a sudden when it goes to the real world—which we call the out-of-sample experience—the effect is degraded or totally disappears.
In my case, that’s not what happened. I was able to successfully predict the 1990/1991 recession, the 2001 recession and, perhaps most notably, the Great Recession of 2007–2009. Also, this is not an indicator that predicted six of the last three recessions. Extraordinarily, there have been no false out-of-sample signals.
The stock market had many false signals, with perhaps the most famous being the October 1987 crash. I was put on the spot since it occurred less than a year after my graduation from the University of Chicago and most people were calling for a recession as a result of the massive drop in the stock market. The average forecast from economists was for negative real growth to occur in 1988. I looked at my measure, the term structure (or yield curve), and it was sloping upward fairly strongly. So, going with my model, I said that real economic growth in 1988 would be 4%. That was far, far away from the consensus. So, they thought, “He’s just an academic in the ivory tower, what does he know?” It turned out in 1988 that my forecast was incorrect, but it wasn’t incorrect by that much; the real growth was 4.2%, even greater than my forecast of 4%. At that point, my model started to get some attention.
Data about Treasury yields is widely available at no cost. If an individual is monitoring the yield curve and it inverts for say one or two days during a quarter, it’s not predictive. Does the yield curve have to stay inverted for the full quarter or most of the quarter? What’s the rule?
The idea with the model is that I calibrate a yield curve measure to the real GDP measure. Real GDP is quarterly, so my model uses a quarterly measure of interest rates.
If the yield curve inverts for a few days or a few weeks and then becomes normally shaped again, then within the quarter you’ll still have a positive yield curve. So that would not signal an immediate recession. Just because we invert for a day or a week, that’s not good enough for this measure.
Let me make another important point. My model links the slope of the yield curve to economic growth. So even though the yield curve might not be inverted for the full quarter, if the slope is very flat, then that suggests slower growth. Empirically, if you look at the track record of my model, it is the case that recessions have been preceded by yield curve inversions that last one quarter. The empirical track record of my model suggests that we look for the average of the yield curve slope over the quarter to be negative.
Regarding bond maturity, I know you looked at the three-month yield versus the five- and 10-year yield. I’ve seen others compare the yield on the two-year Treasury note to the 10-year bond. Any comments? Should investors just stick to comparing the three-month bill to the five-year note or the 10-year bond?
Well, investors need to make the choice.
My original measure has got a long period of out-of-sample validation from 1986 to today. That’s a long period for this particular measure to work and not have a false signal.
Many have looked at other pieces of the yield curve—for example, the 10-year yield minus the two-year yield—and noticed that it maybe does a slightly better job of fitting the data. However, it’s easy to find some combination of yields that does a little better than what I have forecast in my model. So, the idea here is that if you try enough different yield curve measures, just by pure luck something might look better. When you do that, it’s unlikely that it will perform out of sample.
Let’s say for example that somebody suggests based upon data through 2019 that they can get a better fit. By that, I mean a better forecast of real GDP one year ahead using the yield curve of the 9.5-year bond minus the 3.75-year note. And they’ve tried essentially thousands of different combinations. You should be very leery of that because there is just no guarantee that it will work in the future. It’s best to go with the measure that’s got the maximum validation out of sample, number one. And number two—and this is important—the measure is suggested by economic theory. My dissertation has both a theoretical part and an empirical part.
So, the yield curve using the 9.5-year note versus the 3.75-year note, or another combination, just isn’t justified in terms of economic rationale. That to me screams risk. Go with what you’ve got for the long track record. There’s no economic reason to believe that the original measure is broken. If there were a good reason to look at it and reexamine it—for example, if it failed to forecast the last two recessions—maybe then it would be time to go back to the drawing board and determine whether something structurally has changed enough that you would abandon the original measure. There is no reason to do that right now.
What about the timing of recessions? The average length of time between a yield curve inversion and the start of a recession has been, I think, about 11 months (Table 1). There’s variance around the number, however. Any thoughts or explanations?
Yes. Think of the prediction as having three components. One is the timing of the recession—when does it start? Number two is the length of the recession, and number three is the depth of the recession. Those are the components.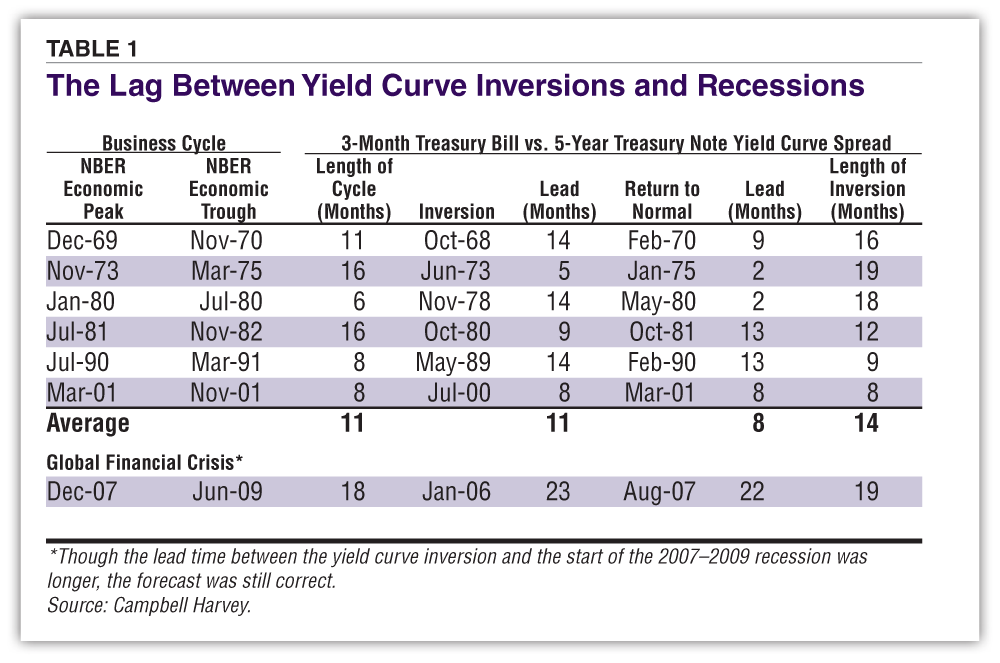
I saw a few months ago that a blogger pulled up my prediction of a recession in 2007 and criticized it because I successfully predicted the global financial crisis and exactly the number of months it lasted. It was surprising to me that the inversion was the identical length of the global financial crisis. The one thing that I didn’t get correct was the severity of the recession. So, yes, the model didn’t get the severity correct and they were criticizing this model. But that is a single variable; this is just one piece of information. And if you can get two out of three, you’re doing a fairly good job.
This is just a model. It’s a very simple model. It gives a lead time to a recession and that lead time varies. But the important thing is that the recession is realized, whether it’s a recession nine months from now or a recession 18 months from now. It gives us lead time. The lead time is not consistent but you’re asking for too much. This is a simple model and it seems to have delivered fairly well so far, but you’re correct that the lead time is somewhat variable.
What about Federal Reserve policy? Some bond market commentators have said that the unwinding of quantitative easing is having an impact. What role do unconventional monetary policies have on your model?
This is within the category of “well, maybe your model is not going to work because this time is different.” There are many reasons why my model will not work. The prime reason it may not work is because it’s just so simple and the economy is more complex.
But let’s focus on the Fed and the unconventional monetary policy, the unwinding of quantitative easing (QE). These Fed actions impact the shorter end of the yield curve. They don’t impact the longer end of the yield curve in the same way. And the Fed actions are nothing new—part of the QE program was something called Operation Twist, which they had also done in the 1960s.
The Fed is taking actions that are not in my simple model, so my simple model abstracts from this fact. So, you can think of the Fed as adding noise to my signal. The question is whether that noise is any different than in the past. Actually, I think that the Fed has less impact in the bond market today than it had in the 1960s and 1970s. The reason is that the bond market is so gigantic. Given the deficits that the federal government has been running and the necessity of funding those deficits with borrowing, the bond market is just massive compared to what the Fed is capable of doing.
Put another way, the Fed could confound the yield curve signal, but they’ve already had a long history of doing this. At this point, given the history, given the accuracy of the signal, I’m not ready to say, “well, this time is different because the Fed has been doing this throughout the time of my examination of the data.” Yes, they add some noise, but it’s not clear that the signal has been degraded.
Returning to the link between yield curve inversions and recessions, is there a self-fulfilling prophecy at play?
Perhaps. This is a very interesting point. In the past, the yield curve really hasn’t gotten much attention. This is a measure that I developed, and it certainly wasn’t believed in the 1980s. It did call the 1990/1991 recession, but the inverted yield curve was not that popular. In addition, that recession wasn’t that deep. During the 2000/2001 recession, most people focused on the tech bubble, not on the yield curve. The yield curve got more attention after successfully calling the global financial crisis and now it’s on everybody’s radar. So, it is possible that people looking at this actually strengthens the predictability because people are taking it seriously as an early warning signal for a recession.
How does that work? People see the yield curve as inverted. That’s never good news. The last time it inverted—with the 10-year yield below the three-month yield—was in July 2007, and we know what happened after that.
So, people look at it and say to themselves, “Hey it’s got a good track record, I think I’m going to delay that capital investment. I’m going to delay the new hiring for my company and see how this plays out.” And indeed, those actions potentially could lead to a slowdown or a recession. Let me add that managers are looking not just at the yield curve but at many things. They can listen to what the Fed has to say in warning about slower growth next year. They can look at the degree of uncertainty in markets, and I’m not just talking about volatility but general uncertainty.
Managers are looking at many things. Frankly, the way I look at it is that I want them to have the best possible information, because if they go ahead and pull the trigger on a project and the economy goes into recession, then that could cost them their company. All of those people who work for that company are out of a job. So, I would prefer that the managers have the best possible information. You can call that a self-fulfilling prophecy, or you can call that a better tool for risk management that actually preserves employment and dampens the depth of a recession. Deploying tools like the yield curve predictor may moderate a downturn. To me, that’s what we want. If there is going to be a recession in the next few years, ideally it is a soft landing.
Portfolio Strategies

Stock Strategies


Ke-Chih Wu from CA posted over 7 years ago:
Richard Sherman from TX posted over 7 years ago:
Neil from PA posted over 7 years ago:
Zay from Texas posted over 7 years ago:
Charles Rotblut from IL posted over 7 years ago:
Kris Murthy from CO posted over 7 years ago:
John Lambert from NJ posted over 7 years ago:
Gilbert from TN posted over 7 years ago:
MEL K from OH posted over 4 years ago:
MEL K from OH posted over 4 years ago:
You need to log in as a registered AAII user before commenting.
Log InCreate an account