Related

AAII Model Portfolios
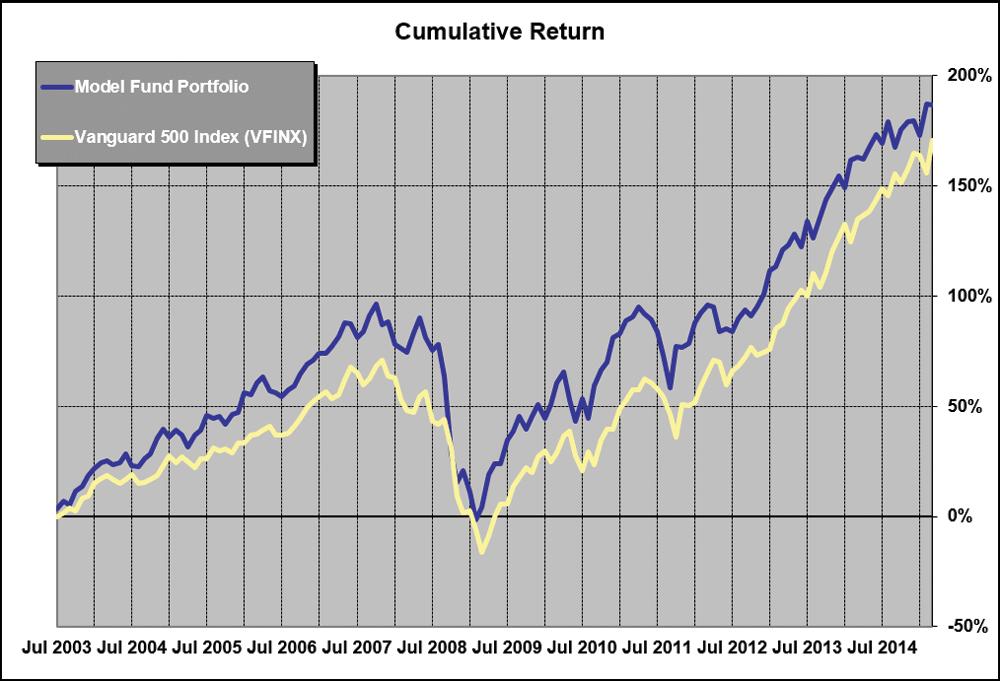
The Model Fund Portfolio continues to lead the S&P 500 index, as measured by the Vanguard 500 Index fund (VFINX).
The Model Fund Portfolio has gained 2.6% year to date as of March 31, 2015, compared to a gain of 0.9% for the Vanguard 500 Index fund. Unlike at the time of our last column in March, both are positive for the year, but not dramatically so.
The alternative subset of the Model Fund Portfolio invested in only the exchange-traded funds (the All-ETF Portfolio) also leads the Vanguard 500 Index fund at 2.5% year to date. The results for longer periods for both portfolios can be seen in Figure 1 and Tables 1, 2, and 3.
Small and mid-cap stocks have begun to come back; they are currently ahead of the general market and appear to be strengthening even more.
The iShares MSCI Frontier 100 ETF (FM) is the poorest-performing fund in the portfolio so far this year. It had a double hit: Many of the frontier stocks are oil-related, which had a negative impact, and the strong dollar has hurt almost all foreign stocks. I still believe that the impact will moderate and that over the long term, these smaller-country stocks will provide a strong growth opportunity.
The performance of the Vanguard REIT Index ETF (VNQ) has moderated a bit since March, but the real estate sector still continues to be one of the strongest sectors for the year.
There are no changes in the Model Fund Portfolio or the subset All-ETF Portfolio. Several of the ETFs have competitors, but there is no reason to change any holdings at this point.
I indicated previously that Aston/Fairpointe Mid Cap fund (CHTTX) might see a performance drop when it closed to new investors, and there is some indication that this is happening. My thinking was based on various research indicating that fund managers are much better at picking stocks to buy with new funds than they are at selecting stocks to sell. It seems the stocks they choose to sell perform better subsequently than those chosen to replace them.
|
|
Fund (Ticker) |
Market Cap Size |
YTD Return % |
Annual Return (%) |
Fund Assets ($Mil) |
Exp Ratio (%) |
Std Dev (36 Mo. Ann'l) (%) | Worst 3-Yr Cal Period (%) | |||
|
|
|||||||||||
|
|
1-Yr | 5-Yr | 10-Yr | Since 6/30/2003 | |||||||
| Type | |||||||||||
| MF | Aston/Fairpointe Mid Cap N (CHTTX)* | Large-Cap | 2.3 | 7.0 | 14.9 | 11.2 | 12.3 | 2,430.9 | 1.11 | 13.4 | (7.9) |
| MF | Fidelity Capital & Income (FAGIX) | na** | 4.0 | 7.0 | 9.1 | 9.0 | 9.4 | 10,985.0 | 0.73 | 5.0 | (7.2) |
| MF | Fidelity OTC (FOCPX) | Large-Cap | 4.8 | 18.4 | 17.6 | 12.8 | nmf | 9,197.5 | 0.77 | 14.0 | (8.3) |
| ETF | First Trust US IPO (FPX) | Large-Cap | 7.1 | 18.0 | 21.6 | nmf | nmf | 610.7 | 0.60 | 12.4 | (13.7) |
| ETF | Guggenheim S&P 500 Equal Weight (RSP) | Large-Cap | 1.7 | 12.8 | 15.5 | 9.5 | 11 | 11,197.7 | 0.40 | 10.2 | (11.4) |
| ETF | Guggenheim S&P MidCap 400 Pure Value (RFV) | Mid-Cap | 1.2 | 8.0 | 12.9 | nmf | nmf | 120.4 | 0.37 | 13.6 | (4.3) |
| ETF | Guggenheim S&P SmallCap 600 Pure Value (RZV) | Small-Cap | 1.1 | 2.3 | 12.6 | nmf | nmf | 175.4 | 0.36 | 16.9 | (7.9) |
| ETF | iShares MSCI Frontier 100 (FM) | Large-Cap | (2.0) | -5.3 | nmf | nmf | nmf | 574.5 | 0.79 | nmf | nmf |
| ETF | Vanguard REIT Index (VNQ)*** | Large-Cap | 4.7 | 24.1 | 15.8 | 9.9 | nmf | 28,835.1 | 0.10 | 13.2 | (11.9) |
| Avg of Funds in Actual Model Fund Portfolio† | 2.8 | 10.3 | 15.0 | 10.5 | 10.9 | 7,125.2 | 0.58 | 12.3 | (9.1) | ||
| Actual Fund Portfolio Performance†† | 2.6 | 9.1 | 12.3 | 7.7 | 9.3 | — | — | 9.3 | (6.4) | ||
| Optional Investment: | |||||||||||
| ETF | iShares Barclays 1-3 Year Treasury Bond (SHY) | 0.5 | 0.9 | 0.9 | 2.5 | 2.9 | 7,739.2 | 0.15 | 0.6 | 1.3 | |
| Comparison: | |||||||||||
| MF | Vanguard 500 Index (VFINX) | Giant-Cap | 0.9 | 12.6 | 14.3 | 7.9 | 8.8 | 28,368.9 | 0.17 | 9.5 | (8.4) |
|
*CHTTX is closed to new investors. Current shareholders can continue to invest in the fund. Other investors should simply use the other eight funds to form their portfolio. Source: Morningstar, Inc. Data as of 3/31/2015. |
|||||||||||
Aston/Fairpointe Mid Cap fund has dropped a bit in assets, from $2.496 billion to $2.431 billion, because of closing. However, it is still one of the top-performing funds over the long run, and we believe that those who own shares should continue to hold the fund at the present time.
Our newest exchange-traded fund, First Trust US IPO (FPX), added in February of 2014, has the best performance of our holdings in 2015 so far. It has been an exceptional performer since it started five years ago, and we hope there won’t be too many copycats fighting over the same holdings.
Table 2. Model Fund Portfolio Annual Performance
| Average Annual Return (%) | Cumulative Return of $10,000 ($) | |||
| Model Fund Portfolio | Vanguard 500 Index (VFINX) | Model Fund Portfolio | Vanguard 500 Index (VFINX) | |
| 2003* | 18.6 | 15.0 | 11,858 | 11,503 |
| 2004 | 17.7 | 10.8 | 13,955 | 12,742 |
| 2005 | 5.4 | 4.8 | 14,711 | 13,350 |
| 2006 | 16.1 | 15.6 | 17,086 | 15,436 |
| 2007 | 10.2 | 5.4 | 18,820 | 16,267 |
| 2008 | -35.9 | -37.0 | 12,071 | 10,245 |
| 2009 | 24.9 | 26.5 | 15,080 | 12,959 |
| 2010 | 20.3 | 14.9 | 18,136 | 14,892 |
| 2011 | -1.7 | 2.0 | 17,827 | 15,186 |
| 2012 | 12.6 | 15.8 | 20,075 | 17,589 |
| 2013 | 26.7 | 32.2 | 25,436 | 23,250 |
| 2014 | 9.9 | 13.5 | 27,962 | 26,390 |
| 2015 YTD** | 2.6 | 0.9 | 28,688 | 26,632 |
| Since Incep** | 9.3 | 8.8 | 28,688 | 26,632 |
|
*June 30 to December 31, 2003. **Through March 31, 2015. Portfolio was started on June 30, 2003. |
||||
Table 3. Alternative All-ETF Portfolio
|
|
YTD Return (%) | Annual Return (%) | ||
|
|
1-Yr | Since 12/31/2012 | ||
| Fund (Ticker) | Weight* | |||
| First Trust US IPO ETF (FPX) | 20% | 7.1 | 18.0 | 76.4 |
| Guggenheim S&P 500 Equal Weight (RSP) | 20% | 1.7 | 12.8 | 49.4 |
| Guggenheim S&P MidCap 400 Pure Value (RFV) | 20% | 1.2 | 8.0 | 51.2 |
| Guggenheim S&P SmallCap 600 Pure Value (RZV) | 20% | 1.1 | 2.3 | 50.6 |
| iShares MSCI Frontier 100 (FM) | 10% | (2.0) | (5.3) | 22.2 |
| Vanguard REIT Index (VNQ) | 10% | 4.7 | 24.1 | 40.9 |
| Avg of ETF Funds in Portfolio† |
|
1.3 | 8.4 | 42.9 |
| Actual ETF Portfolio†† |
|
2.5 | 10.4 | 50.6 |
| Comparison: Spider S&P 500 (SPY) | (3.0) | 12.6 | 50.7 | |
|
* Weights were adjusted at the close of 9/30/2014. †An average of the ETFs in the current Model Fund Portfolio. ††Performance of actual ETF Portfolio including reinvested dividends. Source: Morningstar, Inc. Data as of 3/31/2015. |
||||
Nothing much has changed at the macro level since March. The economy seems to be growing, but not as fast as predicted or hoped. Though the Federal Reserve is still hard to read, the odds seem to favor interest rate expansion beginning this year, likely in the fall. However, the increases may be very gradual. The stock market keeps pushing against record highs but can’t seem to make a sustained run.
We are entering the electioneering phase of our democracy. The Democratic Party seems to have only one candidate, but the Republican Party has legions and we have a year and a half to learn their names. This is “promise them anything” time, and we will see how it affects the stock market. Historically it has pushed the market up, but we will have to wait and see if this time will be different.
Our next column on the Model Fund Portfolio will be in the August AAII Journal, but you can follow it and the Model Shadow Stock Portfolio at AAII.com.
Model Fund Portfolio: Selection Rationale
The fund selection rationale consists of two distinct approaches. The first approach is to select actively managed funds where the managers have shown a long-term ability to outperform the market after allowing for additional portfolio risk, regardless of the sector invested in. A fund must have the following characteristics to be considered for the Model Fund Portfolio:
The above rules apply to new fund selections. Funds will not automatically be eliminated if they later violate the rules without considering other factors.
The second methodology selects investment approaches that have provided excess returns or reduced portfolio risk to investors over the long term and then searches for the best traditional fund or exchange-traded fund (ETF) in that area. Factors to be considered are:
AAII Model Portfolios