



January was a weak period for the stock market in general.
The S&P 500 was down 3.0%, as measured by the Vanguard 500 Index fund  (VFINX), the Model Fund portfolio was down 2.4% and the alternative All-ETF portfolio was down 3.6%. The results for longer periods can be seen in Figure 1 and Tables 1, 2 and 3.
While small and mid-cap stocks have always outperformed the general market over the long run, 2014 was a strong exception, and the relative weakness of smaller-cap stocks has continued into 2015. There is some support for the belief that an upturn in small-cap stocks will be the signal that the overall market has resumed a bullish stance. But it hasn’t happened as yet; the small and mid-cap exchange-traded funds Guggenheim S&P SmallCap 600 Pure Value (RZV) and Guggenheim S&P MidCap 400 Pure Value (RFV) continue to weigh on the model portfolios.
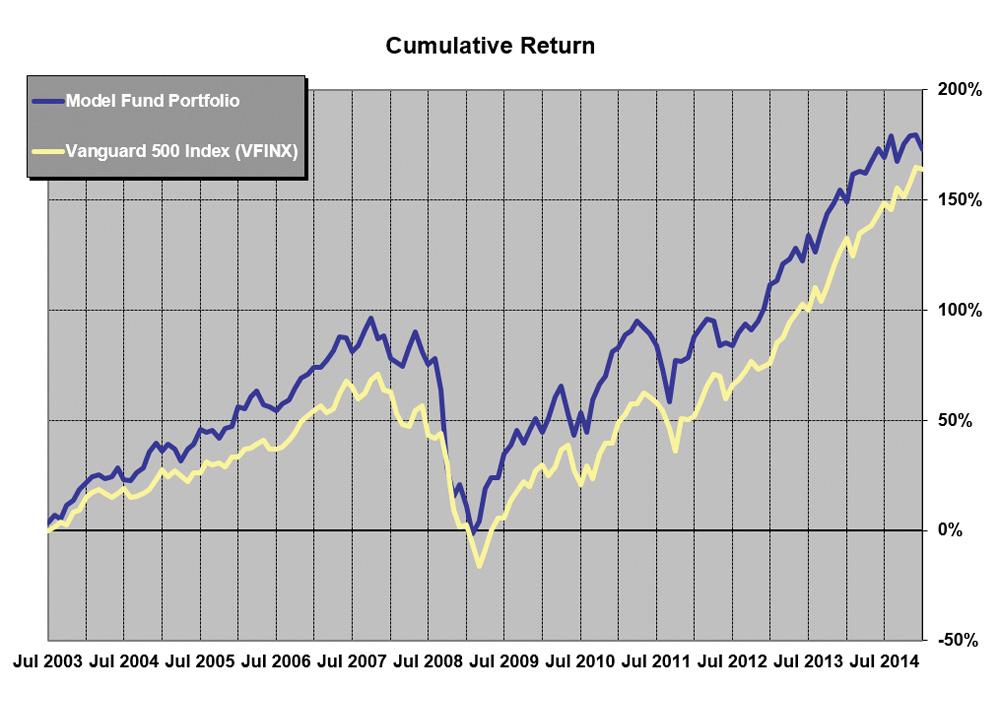
Funds Act Dramatically in Response to Events
There are no changes in either the Model Fund Portfolio or the All-ETF Portfolio.
Dramatic changes in economic factors have impacts far and wide and can be positive and negative. The dramatic change in the price of oil is an example of this. The immediate favorable impact for most of us is lower prices at the gasoline pump.
Oil-producing nations, on the other hand, have less revenue. A large number of the nations in the iShares MSCI Frontier 100 ETF (FM) are oil producers and have had their stocks hit in anticipation of reduced revenue and profit margins. As a result, the fund has fallen quickly from the high levels it had achieved before the oil price decrease.
|
|
Fund (Ticker) |
Market Cap Size |
YTD Return (%) |
Annual Return (%) |
Fund Assets ($ Mil) |
Exp Ratio (%) |
Std Dev (36 Mo. Ann’l) % |
Worst 3-Yr Cal Period % |
|||
| Type | 1-Yr | 5-Yr | 10-Yr | Since 6/30/02 | |||||||
| MF | Aston/Fairpointe Mid Cap N (CHTTX)* | Large-Cap | -3.6 | 7.8 | 15.9 | 10.7 | 12.1 | 2,495.7 | 1.12 | 13.50 | -7.9 |
| MF |
Fidelity Capital & Income (FAGIX) |
na** | 1.0 | 7.1 | 9.5 | 8.6 | 9.3 | 10,549.3 | 0.73 | 5.70 | -7.2 |
| MF | Fidelity OTC (FOCPX) | Large-Cap | -0.1 | 14.7 | 19.4 | 12.1 | nmf | 8,554.1 | 0.76 | 14.60 | -8.3 |
| ETF | First Trust US IPO (FPX) | Large-Cap | -2.3 | 11.0 | 21.5 | nmf | nmf | 536.8 | 0.60 | 14.00 | -13.7 |
| ETF | Guggenheim S&P 500 Equal Weight (RSP) | Large-Cap | -2.9 | 14.2 | 17.0 | 9.0 | 10.7 | 9,664.0 | 0.40 | 9.90 | -11.4 |
| ETF |
Guggenheim S&P MidCap 400 Pure Value (RFV) |
Mid-Cap | -6.0 | 5.6 | 14.4 | nmf | nmf | 120.7 | 0.38 | 13.00 | -4.3 |
| ETF |
Guggenheim S&P SmallCap 600 Pure Value (RZV) |
Small-Cap | -8.2 | -1.0 | 14.3 | nmf | nmf | 172.1 | 0.35 | 16.00 | -7.9 |
| ETF | iShares MSCI Frontier 100 (FM) | Large-Cap | -3.7 | -0.2 | nmf | nmf | nmf | 622.3 | 0.79 | nmf | nmf |
| ETF |
Vanguard REIT Index (VNQ)*** |
Large-Cap | 6.7 | 33.4 | 19.8 | 10.2 | nmf | 29,487.4 | 0.10 | 13.60 | -11.9 |
| Avg of Funds in Actual Model Fund Portfolio† | -2.1 | 10.3 | 16.5 | 10.1 | 10.7 | 6,911.4 | 0.6 | 12.50 | -9.10 | ||
| Actual Fund Portfolio Performance†† | -2.4 | 9.5 | 13.5 | 7.2 | 9.0 | — | — | 12.60 | -6.40 | ||
| Optional Investment: | |||||||||||
| ETF | iShares Barclays 1-3 Year Treasury Bond (SHY) | Bonds | 0.5 | 0.9 | 0.9 | 2.5 | 3.0 | 8,128.6 | 0.15 | 0.40 | 1.3 |
| Comparison: | |||||||||||
| MF |
Vanguard 500 Index (VFINX) |
Giant-Cap | -3.0 | 14.0 | 15.4 | 7.5 | 8.5 | 28,439.1 | 0.17 | 9.00 | -8.4 |
|
*CHTTX is closed to new investors. Current shareholders can continue to invest in the fund. Other investors should simply use the other eight funds to form their portfolio. **Distressed securities - stock and bond. ***VGSIX returns used before October 2004 †A simple average of the funds in the current Model Fund Portfolio. ††Performance of actual portfolio including reinvested dividends. nmf = no meaningful figure. Source: Morningstar, Inc. Data as of 1/31/2015. |
|||||||||||
I believe that the impact from reduced oil profits has been exaggerated and that these pre-emerging countries are where the greatest long-term growth will occur. We will continue holding the iShares MSCI Frontier 100 fund, even though the strengthening dollar creates problems for most foreign corporations.
Our other smaller holding (10%) has also acted dramatically different than the overall market last year and this year to date, but in a positive direction. Vanguard REIT Index ETF (VNQ) has far outpaced the market.
Real estate often performs differently than the general market on a year-by-year basis, but has almost the same long-term return. This helps reduce the volatility of a portfolio and makes REITs (real estate investment trusts) an important part of any portfolio.
Many individuals avoid real estate because the value of their home seems like a sufficient real estate investment. A single home in a specific area is not a real estate investment and is bought for many reasons that have little to do with the general real estate market, which is mainly commercial. Real estate is the rare investment that lets you reduce risk without sacrificing long-term return.
Table 2. Model Fund Portfolio Annual Performance
|
Average Annual Return (%) |
Cumulative Return of $10,000 ($) |
|||
|
Model Fund Portfolio |
Vanguard 500 Index (VFINX) |
Model Fund Portfolio |
Vanguard 500 Index (VFINX) |
|
| 2003* | 18.6 | 15.0 | 11,858 | 11,503 |
| 2004 | 17.7 | 10.8 | 13,955 | 12,742 |
| 2005 | 5.4 | 4.8 | 14,711 | 13,350 |
| 2006 | 16.1 | 15.6 | 17,086 | 15,436 |
| 2007 | 10.2 | 5.4 | 18,820 | 16,267 |
| 2008 | -35.9 | -37.0 | 12,071 | 10,245 |
| 2009 | 24.9 | 26.5 | 15,080 | 12,959 |
| 2010 | 20.3 | 14.9 | 18,136 | 14,892 |
| 2011 | -1.7 | 2.0 | 17,827 | 15,186 |
| 2012 | 15.5 | 15.8 | 20,597 | 17,589 |
| 2013 | 26.7 | 32.2 | 26,097 | 23,250 |
| 2014 | 9.9 | 13.5 | 27,962 | 26,390 |
| 2015 YTD | -2.4 | -3.0 | 27,287 | 25,593 |
| Since Inception** | 9.0 | 8.5 | 25,436 | 23,250 |
|
*June 30 to December 31, 2003 **Through January 31, 2015. Portfolio was started on June 30, 2003. |
||||
Outlook
Last year the market return was above-average at 13.5%. This year it is negative for the month of January. Every time the market weakens, investors seem to take it as a buying opportunity; every time the market starts to move up, other investors want to take profits.
One of these times the market will continue in one direction for a significant run, but no one knows in which direction. I have a bullish bias because the economy looks promising to me, but things can change quickly and the Federal Reserve seems to enjoy keeping us all in suspense.
Table 3. Alternative All-ETF Portfolio
|
|
Weight* |
YTD Return (%) |
Annual Return (%) | |
|
|
1- Yr |
Since 12/31/2012 |
||
| Fund (Ticker) | ||||
| First Trust US IPO ETF (FPX) | 20% | -2.3 | 11.0 | 61.1 |
| Guggenheim S&P 500 Equal Weight (RSP) | 20% | -2.9 | 14.2 | 49.3 |
|
Guggenheim S&P MidCap 400 Pure Val (RFV) |
20% | -6.0 | 5.6 | 41.0 |
|
Guggenheim S&P SmallCap 600 Pure Val (RZV) |
20% | -8.2 | -1.0 | 36.7 |
| iShares MSCI Frontier 100 (FM) | 10% | -3.7 | -0.2 | 23.3 |
|
Vanguard REIT Index (VNQ) |
10% | 6.7 | 33.4 | 40.2 |
| Avg of ETF Funds in Portfolio† | -2.7 | 10.5 | 41.9 | |
| Actual ETF Portfolio†† | -3.6 | 10.7 | 42.2 | |
| Comparison: Spider S&P 500 (SPY) | -3.0 | 14.1 | 45.1 | |
|
* Weights were adjusted at the close of 9/30/2014. †An average of the ETFs in the current Model Fund Portfolio. ††Performance of actual ETF Portfolio including reinvested dividends. Source: Morningstar, Inc. Data as of 1/31/2015. |
||||
The problems with the euro and the possibility of expanded military action against ISIS have not seemed to impact our markets significantly as yet, but major changes in either of these scenarios could affect our economy and our financial markets.
The next column about the Mutual Fund Portfolio and All-ETF Portfolio will be in the May issue of the AAII Journal; in the interim, you can follow any updates at AAII.com.
Model Fund Portfolio: Selection Rationale
First Methodology
The fund selection rationale consists of two distinct approaches. The first approach is to select actively managed funds where the managers have shown a long-term ability to outperform the market after allowing for additional portfolio risk, regardless of the sector invested in. A fund must have the following characteristics to be considered for the Model Fund Portfolio:
- It must be a pure no-load fund. Short-term holding penalties are allowed if paid to the fund and not the manager.
- It must have been active for 10 years. However, exceptions are possible.
- It must have outperformed the S&P 500 index over the past five-year and 10-year periods.
- In its worst three-year (calendar) period, it must not have had a loss; or, in particularly difficult market periods, its loss must have been substantially less than that of the S&P 500 index.
- Its expense ratio must not be above 1.25%. Lower ratios will increase desirability.
- Fund assets must not be over $10 billion. Some exceptions are permitted, depending on fund objectives.
- It must currently be open to individual investors, with a minimum investment of $25,000 or less.
The above rules apply to new fund selections. Funds will not automatically be eliminated if they later violate the rules without considering other factors.
Second Methodology
The second methodology selects investment approaches that have provided excess returns or reduced portfolio risk to investors over the long term and then searches for the best traditional fund or exchange-traded fund (ETF) in that area. Factors to be considered are:
- The liquidity of the fund.
- The resources of the management company, in the case of ETFs.
- The investment returns and risk over as long a term as possible, given the newness of so many ETFs.
-
Selection of areas with demonstrated long-term excess returns: value stocks, small-cap stocks, real estate and special areas where individuals cannot easily invest. An example of a fund in a special area would be Fidelity Capital & Income fund (FAGIX), which invests in distressed securities.
Portfolio Management Notes
- The Model Fund Portfolio is meant to be a portfolio, and we suggest you invest in the entire portfolio on an equal investment basis—that is, invest equal dollar amounts in each fund initially. If you are building an All-ETF Portfolio, see the recommended weightings shown in Table 3.
- If a fund is closed, create your portfolio from the remaining funds.
- You may make adjustments based on your non-fund holdings. For example, if you have partnership or individual holdings in investment real estate (not personal housing), you may reduce or eliminate any REIT funds.
- There is no need to rebalance on a regular basis. Rebalancing can be accomplished when there are portfolio changes or if one holding gets way out of line. We will notify you of any rebalancing in the Model Fund Portfolio.

Related

Growth Investing
The Rationale for Investing in Emerging Markets
Related

Getting Started
The Top 10 Economic Indicators: What to Watch and Why
Discussion
FREE REPORT

Get your free copy of our special
report analyzing the tech stocks
most likely to outperform the
market.
Charles Kanenbley from CA posted over 11 years ago:
You need to log in as a registered AAII user before commenting.
Log InCreate an account