Related

Small Cap Value Investing
The Model Shadow Stock Portfolio was down 2.9% during November 2018, pushing its recent decline into bear market territory.
Over the last three months the Model Shadow Stock Portfolio has declined 20.5%, marking the fifth time it has been down 20% or more over its nearly 26-year existence. In contrast, the S&P 500 index as measured through the Vanguard 500 Index fund (VFINX) has had only two observed bear market periods over the same time frame, but they were much longer on average.
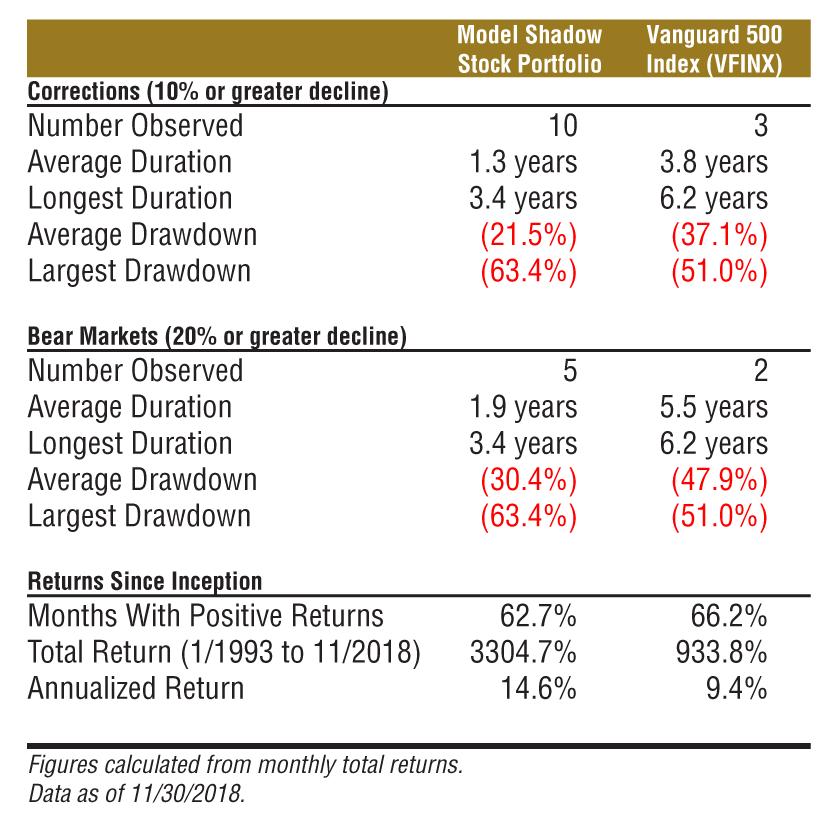
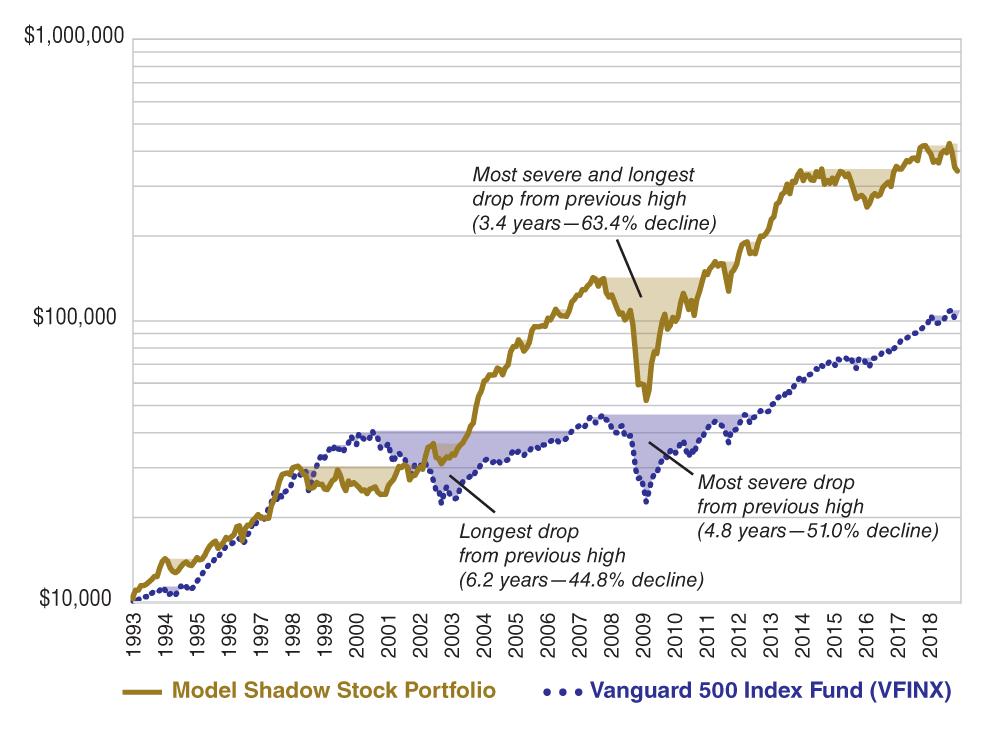
We examined the monthly total returns of the Model Shadow Stock Portfolio along with the VFINX to gain a sense of the frequency, duration and severity of corrections and bear markets. Figure 1 shows the cumulative growth coupled with the drawdowns, which are shaded. The chart provides visual illustration of the severity and duration of the drawdowns for the model portfolio and VFINX fund, while Table 1 summarizes the data. The drawdown is the decline from prior high portfolio or market value.
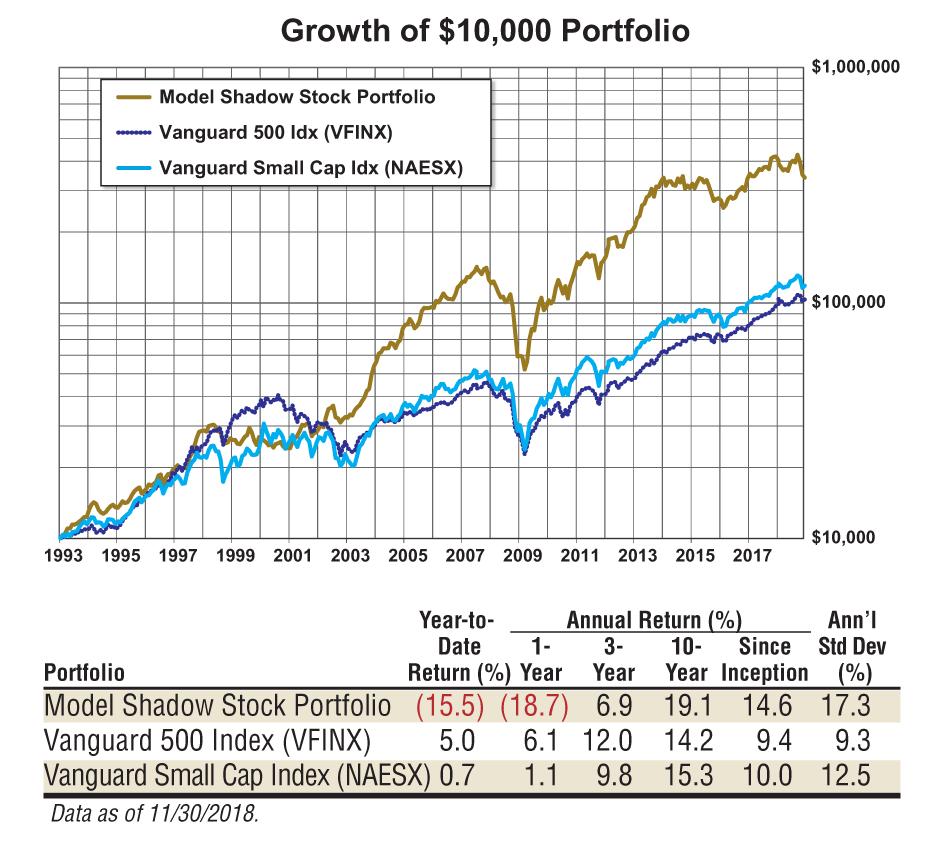
The Model Shadow Stock Portfolio has a cumulative total return of 3,304.7% (14.6% annualized) over its history, compared to the cumulative total return of 933.8% (9.4% annualized) for the VFINX (Figure 2). However, the greater long-term observed return has come with greater short-term volatility. On average, the Model Shadow Stock Portfolio has been up 62.7% of individual months during its existence. This means of course that it has had negative months 37.3% of the time. In contrast the VFINX has had positive monthly returns 66.2% of the time, or down months 33.8% of the time over the same time period.
Corrections are generally classified as declines of 10% or greater. The Model Shadow Stock Portfolio has had 10 observed corrections, and five of them have turned into bear markets of 20% or greater. The average correction has been 1.3 years in length, with an average drawdown of 21.5%. The drawdowns in Table 1 are the maximum losses sustained during a given downturn. The duration is the time it takes the portfolio to return to its level just before the downturn began. The longest correction (July 2007 to November 2010) was 3.4 years and had a drawdown of 63.4%.
The Vanguard 500 Index fund has had three observed corrections and two of them have gone on to become bear markets of 20% or greater over the same time period. The average correction has been 3.8 years in length with an average drawdown of 37.1%. The longest correction (September 2000 to October 2006) was 6.2 years with a drawdown of 44.8%, but the greatest drawdown of 51.0% was with the 2007 bear market that lasted 4.8 years (November 2007 to July 2012.)
As shown in Table 1 and Figure 1, the Model Shadow Stock Portfolio has more frequent corrections and bear market cycles than the S&P 500, but the down periods have generally been shorter in duration and bull market reversals stronger.
If you are tempted to time the market, we suggest that you consider the issues raised in our May 2018 Model Portfolios article titled “Model Shadow Stock Portfolio: Staying Invested All 12 Months.” The article examines the impact on your returns if you should miss one month during the year in the which the market has its best return. Market movements are often very sudden and strong both to the up side and down side.
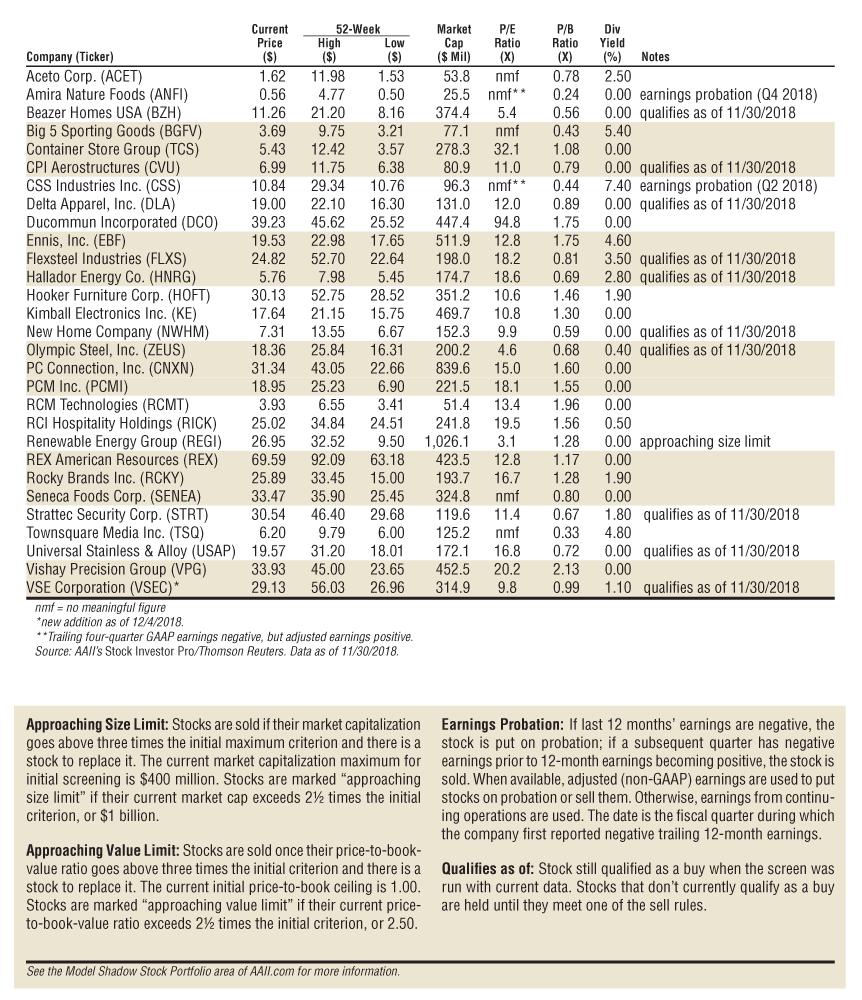
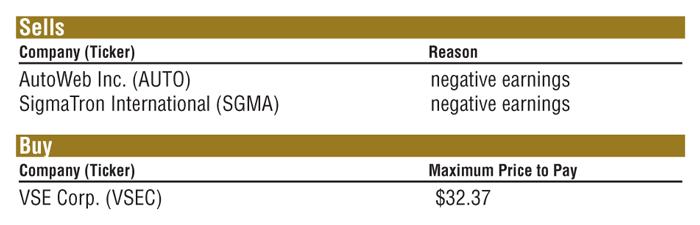
Table 2 shows the current holdings in the Model Shadow Stock Portfolio. After conducting the quarterly review of the Model Shadow Stock Portfolio in early December, two stocks were removed from the portfolio—AutoWeb Inc.(AUTO) and SigmaTron International (SGMA). With the cash on hand and the proceeds from the two sells, there was enough to purchase one new stock with a position size roughly equal to the average position size for the portfolio holdings: VSE Corp. (VSEC). Table 3 summarizes the changes. The detailed Model Shadow Stock Portfolio Rules note the purchase and sell rules.
AutoWeb Inc. was on earnings probation since it announced its second-quarter 2018 earnings on August 2, 2018. With the second-quarter results, the company’s trailing 12-month adjusted earnings fell to a loss of $0.10 per share, placing it on earnings probation. The company announced a third-quarter loss of $0.19 per share on November 8. If a Shadow Stock that is on earnings probation reports a subsequent quarterly loss, it is removed from the portfolio.
SigmaTron International was on earnings probation since it announced its fourth-quarter 2018 earnings on July 20. With the fourth-quarter results, the company’s trailing 12-month adjusted earnings fell to a loss of $0.64 per share, placing it on earnings probation. The company announced a first-quarter 2019 loss of $0.85 per share on September 12. If a Shadow Stock that is on earnings probation reports a subsequent quarterly loss, it is removed from the portfolio.
With the market pullback, a greater number of stocks has been passing the value and size filters for the Model Shadow Stock Portfolio. As of the end of November, 25 stocks met the initial selection criteria, but the portfolio already held nine of them. Applying liquidity requirements to the remaining stocks reduced the number to four candidates. After ranking the four by their four-week relative strength, our additional analysis found that the top option had significant trust and partnership interests. Another potential selection had a significant joint-venture in China; companies whose primary business is in China are not purchased for the Model Shadow Stock Portfolio.
This led to VSE Corp. being purchased for the portfolio. VSE Corp. is a services and supply chain management company to the U.S. Department of Defense (DOD), the U.S. Postal Service (USPS), federal civilian agencies and commercial and other customers. The company’s service offerings include supply chain and inventory management services; vehicle fleet sustainment programs; vehicle fleet parts supply and distribution; maintenance, repair and operations (MRO) of aircraft engines and engine components; aircraft engine parts supply and distribution; engineering support for military vehicles; military equipment refurbishment and modification and ship MRO and follow-on technical support.
Based on VSE Corp.’s closing price of $29.13 on November 30, we suggest paying no more than $32.37, which provides a 10% cushion given that its price-to-book-value ratio was very close to the 1.0 cutoff for the Model Shadow Stock Portfolio. To calculate the maximum buy price based on the price-to-book-value ratio, multiply the current share price by the ratio of the maximum price-to-book ratio to be considered for the Model Shadow Stock Portfolio (currently 1.0) to the current price-to-book ratio of the stock. The price-to-book ratio for VSE Corp. as of November 30 was 0.99, so the calculation, including the 10% cushion, is:
[$29.13 × (1.0 ÷ 0.99)] × 1.1 = $32.37.
The next portfolio review will take place at the end of February, and any changes made then will be reported in the April 2019 AAII Journal. You can keep abreast of the Model Shadow Stock Portfolio on AAII.com in the Model Portfolios area. To receive monthly email updates along with alerts to any changes made to the portfolio, please sign in to AAII.com and go to www.aaii.com/email.
Model Shadow Stock Portfolio: Staying Invested All 12 Months, by John Bajkowski, May 2018
The Cost of Panicking, by AAII Staff, March 2018
How Much Small Cap Should Be in Your Portfolio?, by John McDermott, Ph.D. and Dana D’Auria, CFA, July 2014
Small Cap Value Investing

Portfolio Strategies