

If you feel like you have struggled this year to realize good or even positive returns, you are not alone. This has been a very tough year for investors. Though yesterday’s comments by Federal Reserve chair Jay Powell helped, returns for most asset classes and categories range from being down to only modestly up year to date. Through yesterday’s close, large-cap stocks have a small gain, small-cap stocks are down, most foreign stock indexes are in the red, intermediate- and long-term bonds are lower, gold has lost some of its luster, oil is near its 2018 lows and bitcoin has short-circuited.
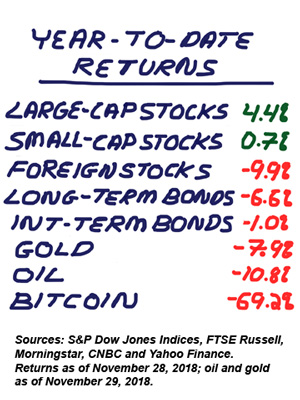 Among U.S. stocks, the headline numbers mask what’s going on underneath the surface. The S&P 500 Equal Weighted index’s year-to-date return continues to be below that of the traditional market-cap weighted S&P 500 index (2.0% versus 4.4%, as of yesterday). The same holds true for smaller companies. The Russell 2000 Equal Weight index lags the Russell 2000 index, falling 2.63% year to date versus a 0.75% gain for its market-cap brother.
This year has been more about frustration than doom and gloom. The declines for many asset classes and indexes are in the single digits. The S&P 500 has rebounded back into positive territory, though its year-to-date gains can be wiped out by a few bad sessions. Bitcoin is a disaster, but the plunge was preceded by a massive upward run.
Decent gains can be found in some corners of the financial markets. Domestic large-cap stocks, as a category, remain firmly in positive territory. Amazon.com Inc. (AMZN), Microsoft Corp. (MSFT) and UnitedHealth Group (UNH) have been key contributors to the S&P 500 Growth index’s returns. Large-cap health care and utilities—traditional safe havens during periods of market turbulence—are also among this year’s better performers. If we look abroad, India’s BSE Sensex still has a comparitively good single-digit year-to-date gain.
Cash and cash equivalents are beating many other asset classes year to date. Yields on savings accounts, money market accounts and the like have risen this year in response to the Federal Reserve’s rate hikes. If you are not earning at least 1% interest on your cash savings and don’t mind moving your account, shop around. It’s not too hard to find savings accounts and money market accounts with yields near or above 2%. (AAII members who are willing to bank online can get a 2.05% yield on their savings accounts through Discover, for instance.)
While there is always a temptation to switch to what’s working now, don’t give into it. If you were not able to correctly predict the optimal allocation for this year, you won’t know when to change it in the future until after the fact. Plus, this year is on track to be an outlier in terms of aggregate asset class performance. Last Sunday, The Wall Street Journal said 90% of the 70 asset classes tracked by Deutsche Bank were down on a year-to-date total return basis through mid-November. This has not happened since 1920, when 84% of 37 asset classes were negative.
We are going to get years where desired gains are tough to come by. This year is one of them. When frustration and/or concern is rising, it can be tough to sit idle. Yet, this may be the best course of action for many investors. Reacting to short-term performance often leads to lower returns than does adhering to a well-thought-out long-term course of action.

- Diversification: A Failure of Fact or Expectation? – The benefits of diversification were questioned during the 2007–2009 financial crisis. In this 2010 AAII Journal article, Sam Stovall explained why diversification didn’t fail.
- The Importance of Diversification in Retirement Portfolios – There’s another reason for staying diversified: It can help increase the amount withdrawn from a portfolio each year.
- Time in the Market Influences Millennials’ Investing Attitudes – Younger investors, influenced by the last bear market, are more conservative than older investors who have more investing experience.
- Investment Knowledge and Age Associated With ETF Ownership – Individual investors who own exchange-traded funds (ETFs) tend to be both more knowledgeable and younger than those who don’t.
Third-quarter earnings season is mostly done, though there will still be a few third-quarter stragglers reporting. Among them are 10 members of the S&P 500, including Broadcom Inc. (AVGO), Kroger Co. (KR) and Ulta Beauty Inc. (ULTA). All three will report on Thursday.
The week’s first economic reports will be the November Purchasing Managers’ Manufacturing Index (PMI), the November Institute for Supply Management (ISM) manufacturing index and October construction spending—all three will be released on Monday. Tuesday will feature November motor vehicle sales. The November ADP employment report, revised third-quarter productivity and costs, the November ISM non-manufacturing index and the Federal Reserve’s periodic Beige Book will be released on Wednesday. Thursday will feature October international trade data and October factory orders. November jobs data—including the change in nonfarm payrolls and the unemployment rate. The University of Michigan’s preliminary December consumer sentiment survey will be released on Friday.
Five Federal Reserve officials will make public appearances: New York president John Williams on Monday and Tuesday; Dallas president Robert Kaplan on Monday; Governor Lael Brainard on Monday and Friday; Federal Reserve Chairman Jerome Powell on Wednesday; and Atlanta president Raphael Bostic on Thursday.
- Revisiting the Risks of Retirement Spending Rules
- My Investment Letter: Words of Advice for My Grandchildren
- Actions to Take During the Five Years Prior to Retirement
Pessimism among individual investors pulled back from a 33-month high but remains well above average. The latest AAII Sentiment Survey also shows a rebound in optimism and a decline in neutral sentiment.
Bullish sentiment, expectations that stock prices will rise over the next six months, rose 8.6 percentage points to 33.9%. The increase was not large enough to prevent optimism from staying below its historical of average 38.5% for the 10th time in 12 weeks.
Neutral sentiment, expectations that stock prices will stay essentially unchanged over the next six months, declined 1.0 percentage points to 26.6%. Neutral sentiment was last lower on January 31, 2018 (26.5%). Neutral sentiment is below its historical average of 31.0% for the fifth consecutive week.
Bearish sentiment, expectations that stock prices will fall over the next six months, fell 7.7 percentage points to 39.5%. Even with the drop, pessimism is above its historical average of 30.5% for the eighth consecutive week and the 11th time in 12 weeks.
Last week, bearish sentiment surged to 47.1%. This was the highest level of pessimism recorded by our survey since February 10, 2016 (48.7%). This week’s pullback puts bearish sentiment back within its typical range, though just barely so. The breakpoint between normal and unusually high readings is 39.8%.
Also last week, bullish sentiment fell to an unusually low level of 25.3%. Optimism was last lower on August 31, 2017 (25.0%). Bullish sentiment is now back within its typical range.
Historically, the S&P 500 index has realized above-average and above-median returns following unusually low bullish sentiment readings. Returns have been higher following unusually high readings for bearish sentiment, though the magnitude of outperformance is much smaller.
The ongoing volatility in stock prices is affecting the short-term outlook for individual investors. Many AAII members are not altering their strategies, however. Also influencing individual investor sentiment is Washington politics (including President Trump and the midterm elections), tariffs (particularly the ongoing trade war with China), corporate earnings, the Federal Reserve, valuations and concerns about the pace of economic growth.
This week’s special question asked AAII members how they think the average consumer is faring relative to a year ago. More than half of all respondents (56%) think the average consumer is doing better. Credit is given to the strong job market, rising wages, tax cuts and lower gasoline prices. Almost 15% think the average consumer is faring about the same as last year. About 14% of respondents think the average consumer is faring worse, with inflation and debt given as reasons. Approximately 7% say the average consumer is doing well now but could be hurt next year if the trade war intensifies and/or interest rates continue to rise.
Here is a sampling of the responses:
- “Much better. More are employed, wages are up and gasoline is down.”
- “I think the average consumer is faring better because unemployment and inflation are low, and wages are rising.”
- “Better due to the reduction in income taxes, generally. Consumer spending is up.”
- “I think the average consumer is overextended with too much household debt.”
- “About the same. The adverse impact of the tariffs and trade wars haven’t been felt yet.”

Bullish: 33.9%, up 8.6 points
Neutral: 26.6%, down 1.0 points
Bearish: 39.5%, down 7.7 points
Bullish: 38.5%
Neutral: 31.0%
Bearish: 30.5%
Local Chapter Meetings

November 22, 2018 Reasons for Individual Investors to Be Grateful
November 15, 2018 How Many Accounts Should You Have?
November 8, 2018 How Much Can You Withdraw From a Portfolio and Not Outlive It?
November 1, 2018 How We Define Risk

