

John Bajkowski
is the president of AAII.
 AP
BSET
BZH
DCO
GSL
HURC
KE
KTCC
NAESX
ORN
PANL
PERI
RCKY
RYAM
SIF
STRT
TITN
VFINX
VPG
AP
BSET
BZH
DCO
GSL
HURC
KE
KTCC
NAESX
ORN
PANL
PERI
RCKY
RYAM
SIF
STRT
TITN
VFINX
VPG
The coronavirus pandemic laid waste to expectations for the world to smoothly return to something resembling a pre-pandemic way of life this year. It feels that every time we start to see the impact of coronavirus cases declining, we are introduced to a new variant of concern that makes the market pause and reevaluate the situation. Many of us first heard about the ominous sounding omicron variant on Thanksgiving, dampening the prospect of the pandemic’s impact becoming a thing of past. Initial reports held that omicron had the possibility of being more contagious than the alpha, beta, gamma or delta variants that had already contributed to the deaths of over five million people worldwide. While it is likely that the coronavirus pandemic has changed the work environment permanently for many, the prospect of continued worldwide travel restrictions, uncertainty over the long-term effectiveness of vaccinations and cumulative impact of the fatigue from dealing with the pandemic without any certain end point have become chilling concerns.
The market’s reaction continues to be swift and sharp as it oscillates between a risk-on and risk-off state of mind. The discovery of the omicron variant during November helped fuel a broad market decline, with the S&P 500 index down by 4.0% over the course of four trading days after Thanksgiving.
The S&P 500 was down 0.7% during November, which does not seem very significant, but the breadth of the index has been weakening. The S&P 500 ended the month down only 3.7% from its 52-week high, but 23.2% of the companies that make up the index were down 20% or more from their 52-week high. The proportion of stocks experiencing a bearish decline is greater as you examine smaller firms. In the S&P MidCap 400 index, 36.8% of the constituents were down 20% or more at the end of November and 50.5% of the stocks in the S&P SmallCap 600 were down at least 20% from their 52-week high.
Large-cap growth stocks posted a 1.4% gain during November, building up their year-to-date gain to 28.8%. Large-cap value stocks lost 3.3% during the month, trimming their gain for the year to 16.7% through the end of November. The outperformance of the large-cap growth segment was fueled by the strong performance of the companies in the Nasdaq 100 index, which was up 1.9% during November.
Growth stocks underperformed value stocks in the other market-capitalization areas. In the mid-cap segment, growth stocks were down 3.6% for the month, lowering their 2021 year-to-date performance to a gain of 14.2%. Mid-cap value stocks were down 2.4% during November and are now up 23.3% year to date.
Small-cap growth stocks lost 4.9% during November, compared to a 3.4% loss for small-cap value stocks. For the year, small-cap growth stocks are up only 2.4%, while small-cap value stocks are up 23.2% year to date through November.
Only two sectors posted gains during November: technology and consumer discretionary. The technology sector was up 4.4% during the month, while the consumer discretionary sector gained 1.7% during November. Communications services was the weakest sector during the month with a 6.1% loss followed by financials (down 5.7%) and energy (down 5.1%).
Even with the large decline during November, the energy sector has the strongest gain for the first 11 months of the year, up 48.9%, followed by real estate (up 32.6%) and financials (up 30.7%).
Sectors that are lagging this year include consumer staples (up 6.1%), utilities (up 7.3%) and communications services (up 12.4%).
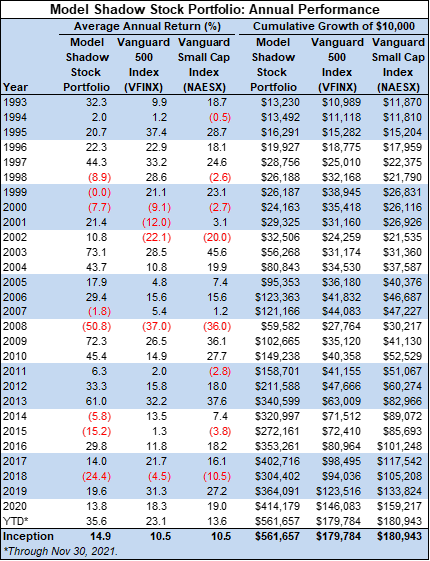
The Model Shadow Stock Portfolio lost 5.3% during the month, reducing its year-to-date gain to 35.6%. The S&P 500 as measured by the Vanguard 500 Index fund  (VFINX) lost 0.7% during November and is now up 23.1% for the year. The Vanguard Small Cap Index fund (NAESX) lost 4.3% in November and is up 13.6% year to date.
Since its inception in 1993, the AAII Model Shadow Stock Portfolio has a compound annual average return of 14.9% versus the Vanguard 500 Index fund’s gain of 10.5% per year on average over the same period. Over the same period, the Vanguard Small Cap Index fund also posted an average annual gain of 10.5%.
The Model Shadow Stock Portfolio’s volatility as measured by its standard deviation has been 21.6% annualized since inception, compared to 14.6% for the Vanguard 500 Index fund and 18.8% for the Vanguard Small Cap Index fund.
The primary Model Shadow Stock Portfolio selection criteria target the intersection of the smallest 10% of domestic stocks as measured by market capitalization and the “cheapest” 10% of domestic stocks as measured by the price-to-book-value (P/B) ratio. These decile breakpoints are determined by examining domestic companies that are listed on the New York Stock Exchange (NYSE) and change over time.
We used AAII’s Stock Investor Pro to examine the decile maximums and are leaving them unchanged. The NYSE price-to-book cutoff was 1.04 on December 10, 2021, down from 1.06 in August, not significant enough to warrant a revision. The highest minimum initial price-to-book ratio for determining qualifying stocks remains at 1.10. Stocks are sold for valuation if they exceed three times the minimum initial price-to-book ratio at the time of a quarterly portfolio review. A price-to-book cutoff of 1.10 is used to screen for stocks to add to the Model Shadow Stock Portfolio and 3.30 (1.10 × 3) is the maximum price-to-book ratio to keep stocks in the portfolio.
As of December 10, 2021, Perion Network Ltd. (PERI) had the highest price-to-book ratio in the Model Shadow Stock Portfolio. While its ratio of 2.84 is approaching the value limit for the portfolio, it is below the 3.30 level used to remove a security due to valuation. Perion Network is an Israel-based global technology company that delivers online advertising solutions and search monetization to brands and publishers. Perion Network was down 15.0% during November but was still up 89.7% year to date through the end of November.
The NYSE market-cap cutoff for the lowest decile was $479 million at the time of review, compared to $460 million in August. Here again the size change was not significant enough merit an adjustment. The highest minimum initial market cap for determining qualifying stocks remains at $500 million. Stocks are sold for valuation if they exceed three times the minimum initial market cap at the time of a quarterly portfolio review. A market-cap cutoff of $500 million is used to screen for stocks to add to the Model Shadow Stock Portfolio and $1.5 billion ($500 million × 3) is the maximum market cap to keep stocks in the portfolio.
Ranger Oil Corp. (ROCC) has the highest market-cap in the Model Shadow Stocks Portfolio with a value of $1.25 billion as of December 10. Ranger Oil, formerly Penn Virginia Corp., is an independent oil and gas company. The company is engaged in the development and production of oil, natural gas liquids (NGLs) and natural gas, with operations in the Eagle Ford shale in South Texas. Ranger Oil’s market is approaching the size limit for the portfolio but was below the $1. billion maximum level currently used to manage the portfolio.
Thirty-five stocks met the initial selection criteria for the Model Shadow Stock Portfolio as of December 10, 2021, up from 26 passing stocks one month ago. AAII members can see and research which companies are currently passing the initial selection criteria in the Shadow Stock Ideas table on AAII.com. The list of Shadow Stock Ideas is updated daily—Tuesday through Saturday.
Of the 35 qualifying companies, six are currently held in the Model Shadow Stock tracking portfolio: Bassett Furniture Industries Inc. (BSET), Hurco Companies Inc. (HURC), Key Tronic Corp. (KTCC), Mesa Air Group (MESA), Strattec Security Corp. (STRT) and VOXX International Corp (VOXX).
Bassett Furniture Industries is a holding recently added to the list of qualifying stocks and operates in the home furnishing industry. It last qualified on November 29, 2019.
Pangaea Logistics Solutions Ltd. (PANL) came off the list of qualifying stocks when its share price fell below $4.00 per share. Pangaea Logistics provides seaborne dry bulk logistics and transportation services.
SIFCO Industries Inc. (SIF) came off the list of qualifying stocks when it reported negative quarterly earnings that also pushed its trailing 12-month earnings per share into the red. SIFCO Industries is engaged in the production of forgings and machined components primarily for the aerospace and energy markets. The processes and services include forging, heat-treating, coating and machining. Its results were hurt by continued logistics and operational issues related to the coronavirus pandemic.
The other major factor that leads to portfolio turnover is tied to negative earnings. If a company reports trailing 12-month earnings from continuing operations that are negative, the stock is placed on probation; if a subsequent quarter has negative earnings prior to trailing 12-month earnings becoming positive, the stock is sold. When available, adjusted (non-GAAP) earnings are used to put stocks on probation or sell them. These are earnings that have been adjusted to eliminate the impact of nonrecurring events such as markdown of inventory or goodwill. These are earnings reported in the media and firms reporting consensus estimates. The I/B/E/S adjusted earnings reported in Stock Investor Pro are used for Model Shadow Stock Portfolio decisions when they are available. These profitability rules act as a basic quality measure to help filter out the many weak companies found amid the pool of stocks trading with low price-to-book ratios.
Three stocks were placed on earnings probation this past quarter: Orion Group Holdings Inc. (ORN), Rayonier Advanced Materials Inc. (RYAM) and SIFCO Industries. These companies will remain on probation until their trailing 12-month earnings from continuing operations turn positive, and they will be removed from the portfolio if they report negative earnings while still on probation.
Upon completion of our quarterly review, no stocks met our quantitative valuation, size or earnings quality sell rules.
The next quarterly review of the Model Shadow Stock Portfolio will take place following the end of February 2022. Any changes to the portfolio will be announced at the time they are made in our Model Shadow Stock Portfolio Update emails (sign up at www.aaii.com/email).
Dixie Group Inc. (DXYN) was the best-performing stock in the portfolio for the month of November, up 36.4%. During the month, Dixie Group reported its third-quarter fiscal-2021 results with large gross profit growth. Read more about Dixie Group’s earnings below.
Titan Machinery Inc. (TITN) was the second-best-performing stock in the portfolio for the month of November, up 17.0%. During the month, Titan Machinery reported its third-quarter fiscal-2022 results and beat expectations. Read more about Titan Machinery’s third-quarter results below.
Kimball Electronics Inc. (KE) was the second-worst-performing stock in the portfolio for the month of November, down 26.2%. During the month, Kimball Electronics reported its first-quarter fiscal-2022 results, missing the consensus earnings estimate. Read more about Kimball Electronics’ earnings performance below.
Rocky Brands Inc. (RCKY) was the worst-performing stock in the portfolio for the month of November, down 34.9%. During the month, Rocky Brands reported its third-quarter 2021 earnings, and missed expectations heavily. Read more about Rocky Brands’ third-quarter results below.
Here are some news highlights from November for the holdings in the Model Shadow Stock Portfolio:
Ampco-Pittsburgh Corp. (AP) reported a third-quarter 2021 loss of $0.08 per share, which compared to earnings of $0.07 per share in the same quarter last year. The company reported sales of $81.2 million, reflecting a 7% increase from the same quarter last year. Additionally, the firm saw its forged and cast engineered products backlog increase by 16%.
In the third quarter, the company reported an operating loss of $2.4 million compared to $0.2 million operating income in the prior-year quarter. This is primarily attributed to recovering from increasing production costs along with more frequent maintenance expenditures, due to longer machine outages in the forged and cast engineered products segment.
“While I am proud of how our team has been able to navigate and mitigate much of the supply chain issues that nearly all manufacturers are now facing, we have seen significant inflationary pressures impacting our business,” said CEO Brett McBrayer. “Our sales agreements with index-based surcharges do not uniformly cover all inflationary cost elements and our pricing is under-recovering the rapid rise in operating costs in the forged and cast engineered products segment. As a result, we are now implementing price increase actions across the business. As we look to the future, our recently announced pricing actions should help improve our margins and the increase in the backlog for the forged and cast engineered products segment points to top-line growth in 2022.”
Beazer Homes USA Inc. (BZH) reported fourth-quarter earnings of $1.57 per share, which beat the I/B/E/S consensus estimate of $0.75 per share by 92%. Earnings grew by 92% year over year. Homebuilding revenue was $589.1 million, a decrease of about 13%. Net income from continuing operations was $48.4 million, while homebuilding gross margin rose 240 basis points to 19.5%.
“We had a very successful fiscal year, driven by strong operational execution and continued strength in the housing market,” said chairman and CEO Allan Merrill. “We generated significant gains in operating margin and adjusted EBITDA [earnings before interest, taxes, depreciation and amortization], leading to full-year net income that was more than double the prior year. We also significantly grew our total active lot position and reduced leverage. The new home market continues to be characterized by strong demand and limited supply, supported by growth in both employment and household income. While affordability and supply chain challenges are expected to persist, we believe our strong backlog and operational momentum will allow us to generate earnings per share above $5.00. We also expect further growth in our active lot position and to achieve our multi-year goal of reducing total debt below $1 billion.”
Big 5 Sporting Goods Corp. (BGFV) reported third-quarter 2021 earnings of $1.07 per share, which missed the I/B/E/S consensus estimate by 5%. Earnings decreased year over year by 18%. Net sales were $289.6 million, compared to $305 million for the third quarter of 2020.
The company’s gross profit for the third quarter was $108 million. Its gross margin for 2021 was 37.3%, reflecting a 1.52% year-over-year increase.
“We are pleased to report another strong quarter of sales and earnings,” said CEO Steven Miller. “Despite a significant impact from the California wildfires, same-store sales largely kept pace with last year’s peak pandemic-related sales surge, while comping very positively against 2019. While earnings were slightly down on a year-over-year basis primarily due to fiscal calendar shifts, sales were strong across our product mix, especially compared to pre-pandemic levels. We were particularly excited to see a resurgence in our team sports business as leagues and schools throughout our markets returned to more normal activities. As we continue to manage through the widespread supply chain disruptions and labor challenges impacting the retail industry, we feel well-positioned to produce fourth-quarter results that significantly exceed pre-pandemic levels. In the fourth quarter to date, we are continuing to see strength across a broad array of categories.”
The company declared a quarterly cash dividend of $0.25 per share, payable on December 15 to shareholders of record as of December 1. The board of directors also declared a special cash dividend of $1.00 per share, payable on December 1 to shareholders of record as of November 17.
Container Store Group Inc. (TCS) reported second-quarter 2021 earnings of $0.54 per share, which beat the I/B/E/S consensus estimate by 84%. Consolidated net income was $27.2 million, increasing by 34.6% year over year. Consolidated net sales were $276 million, reflecting an 11.2% increase year over year and a 16.7% increase compared to the second quarter of 2019.
This marks the company’s best second quarter for both consolidated net sales and earnings per share on record. The company’s gross profit for the third quarter was $163.5 million.
“Our results reflect continued momentum as we delivered record-breaking fiscal second-quarter performance on both the top and bottom line,” said president and CEO Satish Malhotra. “We were particularly pleased with the 22% sales increase in our custom closets business, and our other product categories increased 3% despite being up against a 10% sales increase in the second quarter last year. This performance in a dynamic operating environment is a testament to the execution of our incredible teams across the organization. As we look ahead, we continue to see great opportunity to double the size of our business over time, and the progress we are making against our strategic initiatives has us firmly on the path to achieving our goals.”
Delta Apparel Inc. (DLA) reported fourth-quarter 2021 earnings of $0.96 per share, which beat the I/B/E/S consensus estimate by 71%. Earnings increased by 35% year over year. Net sales were $436.8 million, reflecting a 14.6% increase from last year. Net sales for the quarter were $114.7 million, decreasing by 1.7% year over year.
“We ended the fiscal year on a positive note, with broad-based fourth-quarter top-line performance and solid margin expansion,” said chairman and CEO Robert Humphreys. “I am incredibly proud of our entire organization whose hard work has enabled us to post these extraordinary results. Brand awareness and consumer engagement with Salt Life is at an all-time high, which is driving exceptional growth in our branded retail stores as well as our wholesale business. Within our Delta Group, we continue to see strong demand from brands, retailers and retail license accounts utilizing our comprehensive and diverse services. With record-level manufacturing output, we are rebuilding our inventory levels and I am confident we are poised to continue to deliver outstanding results in fiscal 2022 and beyond.”
Dixie Group Inc. (DXYN) reported third-quarter 2021 earnings of $0.40 per share, which increased year over year from earnings per share of $0.05. Net sales for the quarter were $89.3 million, reflecting a 27% increase year over year.
The company’s gross profit for the year grew 49% to $101.8 million from $68.4 million last year. Its gross margin for 2021 was 27.9%, compared to 24.5% from the third quarter of 2020.
“During the quarter, we continued to gain market share and began significant changes, which we believe will enhance our future prospects,” said chairman and CEO Daniel Frierson. “Net sales of our residential floorcovering products were up 26%, comparing favorably to the industry which we believe was up approximately high-single digits. For the first nine months of the year, our total net sales of residential products was up 49% over the same period in the prior year. This significant year-over-year increase in the net sales of our residential floor covering products was the result of the impact of the COVID-19 pandemic in 2020 and strong growth in new and existing home sales and home remodeling in 2021.”
Ducommun Incorporated (DCO) reported third-quarter 2021 earnings of $0.78 per share, beating the I/B/E/S consensus estimate by 6%. Earnings were up 44% year over year. Net sales for the quarter were $163.23 million, increasing by 8.6% year over year.
Operating income was $13.4 million, reflecting 8.2% of revenue. Adjusted operating income was $14.4 million, encompassing 8.6% of revenue. Net cash provided by operations was $5.5 million. The company’s gross profit for the quarter was $35.3 million, representing 21.6% of revenue as opposed to gross profit of $33.5 million and 22.3%. This decrease as a function of revenue is mainly attributed to a less-than-desirable product mix.
“Our performance this quarter came in essentially as expected, with another solid performance in Ducommun’s defense business along with steadily increasing commercial aerospace demand driving top-line growth both sequentially and year over year,” said CEO Stephen Oswald. “Revenue rose to $163.2 million, up 9% over 2020, as large commercial aircraft platform sales climbed more than 50% due to increased build rates from Boeing and Airbus. At the same time, the company’s backlog increased to $836 million, the highest level since the COVID-19 pandemic began in first-quarter 2020, reflecting improving commercial order trends and solid demand across the board.”
Global Ship Lease Inc. (GSL) reported third-quarter 2021 earnings of $1.74 per share, missing the I/B/E/S consensus estimate by 83%. Earnings were up year over year from $0.45 per share. Net sales for the quarter were $138.6 million, increasing by 96.5% year over year.
Operating income was $79.6 million, reflecting 57.4% of revenue. Adjusted operating income was $3.3 million, encompassing 1.1% of revenue. Net cash provided by operations was $44.7 million.
“We have taken numerous steps to translate this extraordinary market environment into sustainable, long-term benefits for GSL, adding 48 charters in the year to date for incremental contracted revenues of $1.25 billion of contracted revenues and almost $930 million of expected Adjusted EBITDA over durations ranging from 21 months to five years,” said CEO Ian Webber. “Notably, we have grown our fleet by more than 50% while maintaining strict pricing discipline and selectivity in regard to vessel specifications, condition and chartering prospects. All of the vessels that we agreed to acquire earlier in the year have now been delivered with attractive charters in place and are set to provide full earnings contribution from mid-October, when the twenty-third vessel was delivered.”
Global Ship Lease also announced that it will declare a dividend of $0.375 in the first quarter of 2022, an increase of 50%.
Hurco Companies Inc. (HURC) declared a regular quarterly dividend of $0.14 per share, in line with the previous payment. The dividend is payable on January 17 to shareholders of record as of January 3.
Key Tronic Corp. (KTCC) reported first-quarter fiscal-2022 earnings of $0.07 per share, which decreased year over year by 56%. Net sales for the quarter were $132.8 million, increasing by 7.8% year over year.
Operating income was $2.1 million, with an operating margin of 1.6%. Cash and cash equivalents for the quarter were $1.5 million. The company’s gross profit for the quarter was $10.1 million and gross margin was 7.6%.
“We’re pleased with the strong customer demand during the first quarter of fiscal 2022 and our successful launch of major new programs in spite of continued headwinds from worldwide component shortages, transportation bottlenecks and the global pandemic,” stated president and CEO Craig Gates. “During the first quarter of fiscal 2022, we won new programs involving industrial testing equipment, medical diagnostic products and pharmaceutical water treatment. Moving further into fiscal 2022, component shortages, logistic delays and the COVID-19 crisis continue to present multiple business challenges, but we continue to see the favorable trend of contract manufacturing returning to North America. With our recent investments in new capacity in both North America and Vietnam, we’re well-prepared for long-term growth when supply chains improve.”
Separately, Key Tronic announced a contract for the design and manufacturing aspect of an industry-leading power equipment product. Initial production is expected to begin in 2022. Revenue is projected to be $80 million when at maximum production.
Kimball Electronics Inc. (KE) reported first-quarter fiscal-2022 earnings of $0.06 per share, missing the I/B/E/S consensus estimate by 82%. Adjusted earnings compared to $0.65 per share in the same period last year. Net sales for the quarter were $292.7 million, decreasing by 12% year over year.
Operating income was $4.8 million, reflecting 1.6% of revenue. Net cash provided by operations was negative $8.2 million. The company’s gross profit for the quarter was $15.6 million, representing 5.3% of revenue as opposed to gross profit of $30.6 million and 9.2% for the same quarter of 2020.
“Component shortages, which are impacting companies worldwide, continue to make it challenging to keep pace with strong market demand,” chairman and CEO Donald Charron. “We were disappointed by the lack of improvement in the overall situation in the September ending quarter, when we were actually expecting some level of recovery. As supply constraints ease, we are well-positioned to ramp production on our record backlog and support our strong funnel of new product introductions. We are reiterating our guidance for fiscal 2022, although the bifurcation between the first and second halves will be more pronounced.”
Orion Group Holdings Inc. (ORN) announced at the end of the month that they had won contracts, totaling around $28 million. These contracts are broken down into three key projects: construction of a cold storage facility valued at $5.6 million, building two retirement residential houses at $4.3 million, and a data center expansion initiative for $3.8 million. The company’s marine segment also won contracts totaling $16 million.
Pangaea Logistics Solutions Ltd. (PANL) reported third-quarter 2021 earnings of $0.60 per share, beating the I/B/E/S consensus estimate by 20%. Earnings increased year over year from $0.17 per share. Net sales for the quarter were around $213 million, increasing by 105.4% year over year.
“Our third-quarter and year-to-date results set a record for us,” said interim CEO Mark Filanowski. “The summer surge in rates worked in our favor, with our new vessels adding to our operating profits as we generated adjusted EBITDA of $33.6 million for the quarter and net income of $27 million. In addition to our three shuttle vessels moving bauxite from Jamaica to the Mississippi River, we also had eight ice-classed vessels in the Arctic trade for most of the quarter. In the past nine months, we have added six vessels to our fleet, including three newbuilding 95,000 dwt [deadweight ton] ice-class 1A vessels, with one more new building scheduled to be delivered in late November. We are also pleased to announce today the acquisition of a 2009 built Panamax vessel to support our core contract business, expected to deliver in the first quarter of next year. Over the past two years, we have renewed our owned fleet and decreased the average age by 25%, to less than nine years.”
The company also declared a regular quarterly dividend of $0.035 per share, in line with previous declarations. The dividend is payable on December 15 to all shareholders of record as of December 1.
Ranger Oil Corp. (ROCC) reported third-quarter 2021 adjusted earnings per diluted share of $1.15, which increased year over year from the $1.14 adjusted earnings per diluted share reported in the third quarter of 2020. Earnings beat the I/B/E/S consensus estimate of $1.13 per share by 1.77%. Net sales of $141.1 million increased by 103.3% over the same quarter of 2020.
Net income was $17.4 million, an increase over the net loss of $243.4 million in the third quarter of 2020. Gross income for the quarter was $117.2 million, a 129.8% increase over the comparable quarter of 2020. The massive gains can be partially attributed to the increased revenue, but the company also posted large impairments of oil and gas properties of $236 million on its third-quarter 2020 income statement.
“The last several months have marked an incredible period of positive transformation,” said president and CEO Darrin Henke. “I’m so proud of the many accomplishments we’ve made—closing our Lonestar acquisition, strengthening our balance sheet with our unsecured notes offering, outperforming the midpoint of our guidance for both production and capital and generating our eighth consecutive quarter of free cash flow.”
Ranger Oil provided an outlook for fourth-quarter 2021 sales, revising as well as narrowing guidance of anticipated sales volumes for the fourth quarter from a range of 25,700 to 27,700 barrels of oil per day to a range of 26,700 to 28,000 barrels per day. Ranger Oil sold 25,483 barrels per day in third-quarter 2021.
Rocky Brands Inc. (RCKY) reported third-quarter 2021 earnings per diluted share of $0.34, which decreased year over year from $1.04 adjusted earnings per diluted share reported in the third quarter of 2020. Earnings missed the I/B/E/S consensus estimate of $1.37 per share by 75.1%. Net sales of $125.5 million represented a 61.3% increase compared to the same quarter of 2020.
The net loss reported by the company totaled $0.4 million, a 105.3% decrease from the $7.6 million net income in the third quarter of 2020. Gross income for the quarter was $47 million, a 57.7% increase over $29.8 million in the comparable quarter of 2020. Total operating loss was $0.1 million, a decrease over operating income of $9.7 million for the comparable period of 2020.
“While we are disappointed that our near-term growth potential is being limited by fulfillment headwinds, I am confident we’re positioning the business for further market share gains and increased profitability even as the operating environment remains volatile,” said president and CEO Jason Brooks. “Our enviable inventory position and relative insulation from industry-impacting global supply chain issues enabled through our Caribbean-based manufacturing facilities, provide key competitive advantages that are driving shelf space gains and new market opportunities. We are excited to complete the integration of the Boston Group so we can turn our full attention to unlocking the earning power of our combined organizations.”
The company also declared a dividend during the month of $0.155 per share, in line with the previous declaration. The dividend is payable on December 16 to shareholders of record as of December 2.
Rayonier Advanced Materials Inc. (RYAM) announced a third-quarter 2021 loss per diluted share of $0.21, missing the I/B/E/S consensus estimate for earnings of $0.02 per share. The company had net sales of $374 million during the quarter, up from $323 million in the comparable period of 2020.
The company reported a net loss of $4.8 million, a sharp decline from the $29 million reported in the comparable period of 2020. Gross income for the quarter tallied $19.3 million, a 41.9% increase over the third quarter of 2020.
“We made great progress on our strategic initiatives in the quarter including completion of the portfolio optimization initiative,” said president and CEO Paul Boynton. “Along with our sale of the lumber and newsprint assets, we repaid a significant amount of debt and built cash reserves, which will be used to make investments in lowering cost, improving reliability and growing our BioFuture over the coming years. As we experience significant cost inflation and strong demand for cellulose specialties products, which are expected to continue into 2022, it is imperative that we capture fair value for our products to maintain our capital-intensive assets and service our customers. As such, we expect significant price increases on our majority of cellulose specialties contracts in 2022. With the completion of portfolio optimization, the company is well-positioned to drive price increases for cellulose specialties, lower costs, improve reliability, drive returns on strategic investments and fund attractive research and development and innovation initiatives. With these investments, we expect to grow consolidated EBITDA margins significantly over the next three to five years.”
Titan Machinery Inc. (TITN) reported fiscal-2022 third-quarter diluted earnings per share of $0.96, beating the I/B/E/S consensus estimate of $0.68 per share by 42.2%. Total revenues tallied $454 million for the quarter, a 25.8% increase over the comparable quarter of fiscal 2021.
The company reported net income of $21.5 million, a 121.6% increase year over year. Gross income for the quarter was $92.5 million, compared to $72.6 million reported in the third quarter of 2021.
“The ongoing strength of the broader agriculture sector continues to fuel demand for equipment across our business and equipment revenue grew 37% on a consolidated basis in the third quarter,” said chairman and CEO David Meyer. “At the segment-level, this operating leverage is visible in our agriculture segment, which benefited from better-than-expected crop yields across our footprint, and produced a pretax margin of 7%, which is a record quarterly high margin for the segment. Our construction and international segments are also generating strong gains in profitability, each producing another solid quarter and building upon the improvements made fiscal year to date.”
The company did not disclose any outlook for the rest of 2021, but I/B/E/S currently estimates the company to have diluted earnings per share of $2.55 for the full year of fiscal 2022.
Vishay Precision Group Inc. (VPG) reported third-quarter 2021 adjusted diluted earnings per share of $0.52, which increased year over year from $0.40 adjusted earnings per diluted share reported in the third quarter of 2020. Earnings per share beat the I/B/E/S consensus estimate of $0.51 per share by 1.6%. Net sales of $82 million increased 21.5% over the same quarter of 2020.
The company reported a net income of $5.4 million, a 3.6% decrease over $5.6 million net income in the third quarter of 2020. Gross income for the quarter was $31.9 million, a 16.8% increase over $27.3 million in the comparable quarter of 2020.
“In the third quarter of 2021, we continued to operate under excellent economic conditions, resulting in a further increase of our record backlogs,” said president and CEO Gerald Paul. “During the quarter we experienced localized shortages of labor impacting the manufacturing output. The automotive sector is expected to increase over the next quarters as the current supply chain problems are getting resolved step by step. We also continued to strategically increase prices to offset the increased inflationary costs for metals, materials and transportation.”
The company expects to grow quarter over quarter, projecting revenues in the range of $80.5 million to $84.5 million for the third fiscal quarter of 2021.
 Get updates about the portfolio that has outperformed the market by 211.9%
since inception!
Get updates about the portfolio that has outperformed the market by 211.9%
since inception!