PRESENTED BY THE AMERICAN ASSOCIATION of INDIVIDUAL INVESTORS
For over 30 years the AAII Model Shadow Stock Portfolio has been explaining investing principles and techniques to our members with an actual stock portfolio that has been able to outperform the market and most mutual funds. Groundbreaking academic studies revealed that there were investment strategies producing hypothetical returns that outperformed the market. Many of these promising studies were being ignored by professional investors, however, because they were too difficult for large institutions to develop into investment products that they could scale into multibillion-dollar portfolios. James Cloonan, the late founder of the American Association of Individual Investors, was frustrated by this disregard.
Cloonan started the Model Shadow Stock Portfolio in June 1993 with several objectives. He didn’t set out to prove any one theory of investing, but he wanted to design an evidence-based investment approach that could be easily followed by the typical individual investor. A narrative of the process of managing this portfolio is presented in the AAII Journal and on AAII.com. This special report summarizes the rationale behind the approach and its benefits for AAII members.
Cloonan wanted to use a rmodel portfolio to implement the historically simulated results of many studies showing that, on average, the smaller the market capitalization of a company’s stock, the higher the expected return over the long run; and the deeper the value of a company’s stock price, the greater the expected long-term return.
As we show in this special report, there has been considerable research showing that micro-cap stocks have provided higher returns, and the excess returns are more than might be explained by any additional risk. Further research has also revealed that the cheaper a stock’s price relative to values such as book value, the higher the return over the long term.
There was very much a practical goal as well when Cloonan and AAII started the Model Shadow Stock Portfolio. We wanted to examine and share with individual investors the real-world issues of managing a portfolio of smaller-company stocks. What we experienced and learned from running an actual portfolio of less-frequently traded stocks was adapted into portfolio management rules that have been shared with our members over time. These rules continue to evolve as market conditions change and additional knowledge is gained.
Cloonan wanted to show that it was possible to manage a portfolio of stocks, following precise procedures with a minimum time commitment. In the case of the Model Shadow Stock Portfolio, this time amounts to only about six to eight hours per quarter. Portfolio reviews, and any necessary adjustments to portfolio holdings, are made once a quarter after companies report their quarterly financial results.
The Model Shadow Stock Portfolio reflected the investment philosophy of Cloonan, which held that:
If you are to believe much of what is written in the popular press today, it would seem that individual investors cannot compete against big-money professional investors such as hedge funds and high-frequency traders. However, at the American Association of Individual Investors we have helped over two million individual investors become skilled at managing their own portfolios. When James Cloonan founded AAII in 1978, he did so with the belief that individual investors—armed with education, a well-defined investment plan and patience—are able to outperform professional money managers. Nearly 50 years later, this belief still holds true.
At AAII, we are always on the lookout for promising academic research that can be translated into practical investment strategies for the individual investor. There is a mountain of evidence showing that small companies with very low stock valuations have outperformed larger, higher-valued stocks over the long term. We have come to call them “shadow stocks” because they are too small to garner the attention of most professional money managers and analysts and thus live in the shadows of Wall Street.
Welcome to the American Association of Individual Investors
AAII is a nonprofit association dedicated to investment education.
For full access to our award-winning content, classrooms, model portfolios and stock screens,
please take a moment to join AAII today for only $1.
|
|
||
One can go back to the breakthrough 1981 paper by Rolf Banz showing that small-cap stocks outperformed large-cap stocks on both an absolute and risk-adjusted basis. The true genesis for the creation of the Model Shadow Stock Portfolio, however, was research from Eugene Fama and Kenneth French. Their oft-cited study, “The Cross-Section of Expected Stock Returns,” found that company size, as measured by market cap, helped explain future market returns.
Market cap is simply calculated by multiplying the number of shares a company has issued by the share price. It is a common measure of company size and represents the market consensus of a company’s worth. The largest companies have a market cap of over $1 trillion, while smaller companies have a market cap of $500 million or less.

As shown in the table above, between 1926 and the end of 2022, the smallest companies in the 10th decile have, on average, generated an annual return of 12.9% over that period. By comparison, the companies in the S&P 500 index—the 500 largest companies traded on U.S. exchanges based on market cap—generated an average annual return of 10.1% over the same period. So if you invested $100 in these 10th-decile stocks at the beginning of 1926, your investment would have grown to $12,810,937 at the end of 2022, compared to only $1,130,759 if you had invested the same $100 in the S&P 500 over that period.
Again, one of the reasons Cloonan started the Model Shadow Stock Portfolio was to see whether the theoretical results of these landmark studies carried through to the real world.
Small Cap Versus Micro Cap
The investment community today uses the term “small cap” to describe companies up to a market cap of $2.5 billion or $3.0 billion. The Russell 2000 index, considered by many to be a comprehensive index of small-cap stocks, has an average dollar-weighted market cap of $2.90 billion, although its median or midpoint market cap is $0.97 billion. However, as of the end of March 2023, the index’s largest constituent had a market cap of $11.20 billion, definitely not what most would consider a small-cap stock.
The S&P SmallCap 600 index, another popular small-cap index, had an average market cap of $1.65 billion as of March 31, 2023, and a median market cap of $1.41 billion. The range of market caps for its constituents was $132 million to $5.82 billion.
However, the original research on small-cap stocks was done on the smallest 20% of stocks ranked by market cap on the New York Stock Exchange (NYSE). Subsequent research continued to use the NYSE stocks to determine market-cap ranges but did not require that stocks be traded on the NYSE. And that is still the market-cap range used by academic researchers today when examining the “small-cap effect.” At current market valuations, this would include stocks with market caps of up to $374 million—too small for most mutual funds to invest in.
As a result of this divergence between the academic and real-world definitions of the term small cap, stocks in the smallest range today are termed micro caps.
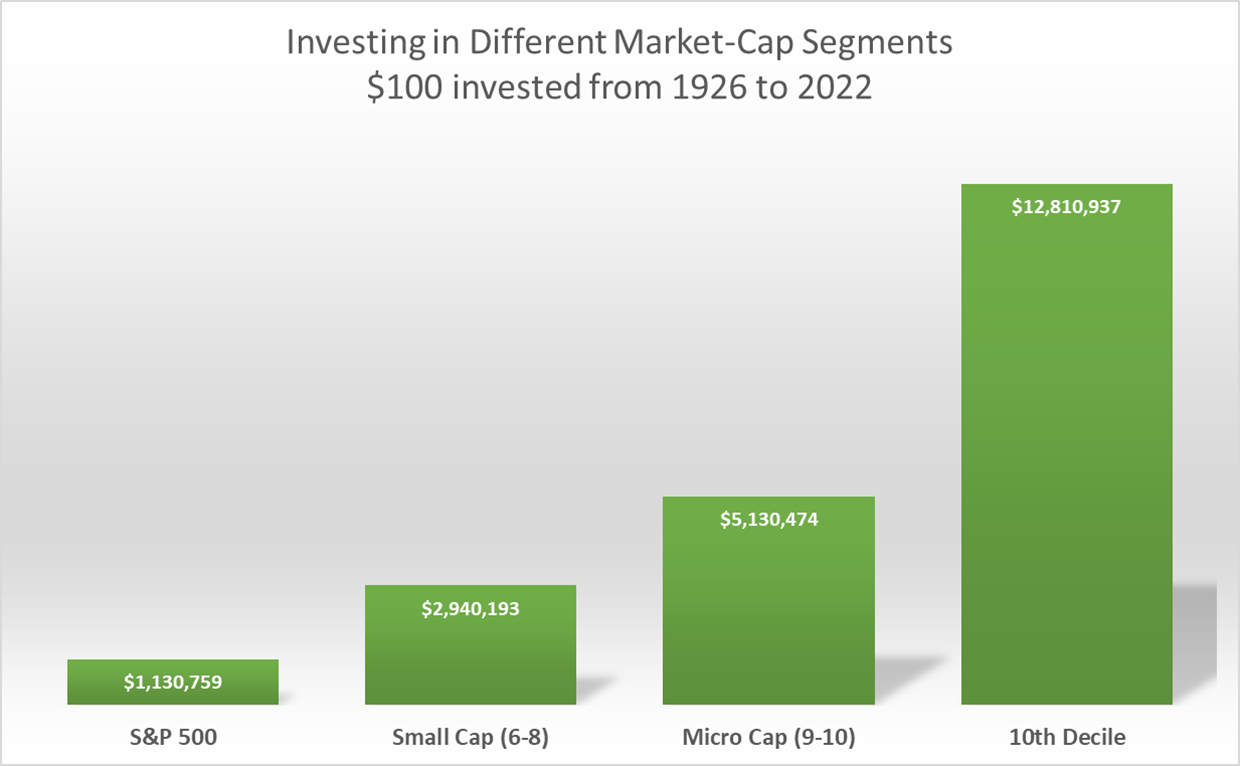
As the chart above shows, though, the impact of investing in the small-cap segment versus the micro-cap segment isn’t merely a matter of semantics. Between 1926 and the end of 2022, investing in small-cap stocks—those in the sixth, seventh and eighth deciles of market cap on the NYSE—generated an average annual return of 11.2%. Investing in only stocks in the 10th decile—the smallest 10% of stocks—generated an average annual return of 12.9%. That difference of less than two percentage points resulted in over $9.87 million more wealth over that period on a $100 investment.
Another way to think of it is this: 2.0 percentage points better annual performance means that, over a 35-year investing period, the value doubles on the same initial investment.
In one of his early columns discussing the Model Shadow Stock Portfolio, Cloonan wrote: “There are numerous individuals who can earn for themselves that 1% to 2% advisory fee they are paying to someone else in a mutual fund.” As these numbers show, one shouldn’t discount that extra 1% to 2% per year.
Welcome to the American Association of Individual Investors
AAII is a nonprofit association dedicated to investment education.
For full access to our award-winning content, classrooms, model portfolios and stock screens,
please take a moment to join AAII today for only $1.
|
|
||
Realistic Expectations
While the performance data we have presented makes a strong case for investing in micro-cap stocks, it is not always easy. A great deal of evidence supports the notion that over the long term, stocks of smaller companies tend to have greater returns than those of larger companies. To realize those higher long-term gains, however, you have to be willing to expect periods of underperformance. You also have to be able to accept greater short-term volatility from small-cap stocks with the understanding that your long-term wealth accumulation should benefit from your patience. These are likely considerations that have helped preserve the micro-cap advantage over the long term.
If you invest in small-cap stocks, you have to expect periods of underperformance. Large-company stocks outperformed small-company stocks in each of the four years from 2017 through 2020 but then small-company stocks outperformed large-company stocks in 2021. The Ibbotson Stocks, Bonds, Bills and Inflation (SBBI) Yearbook reveals that large-company stocks have outperformed small-company stocks in close to half the years since 1926. However, the outperformance of small stocks in their good years is greater than the outperformance of large stocks in their stronger years, as the data we’ve presented illustrates. It is also noted that as the holding period increases, the likelihood of small-cap stocks outperforming large-cap stocks increases.
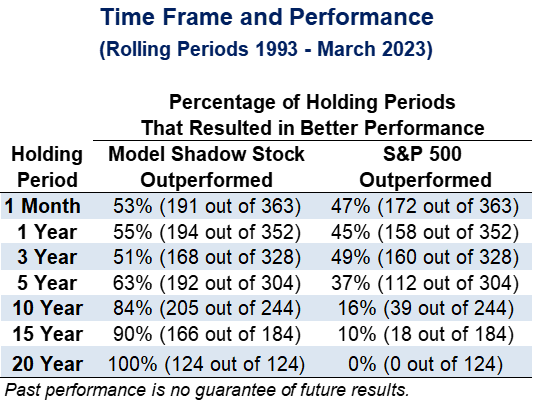
Over its 30-year existence, the Model Shadow Stock Portfolio outperformed the Vanguard 500 Index fund (VFINX) in 17 of the 30 calendar years, or 57% of the years.
Since calendar years are somewhat arbitrary start and end dates, rolling periods are often used to smooth out seasonality. There have been 344 rolling 12-month time periods over the 30-year history of the Model Shadow Stock Portfolio.
The Model Shadow Stock Portfolio has outperformed the Vanguard 500 Index fund in 55% of the one-year periods. When it comes to five-year holding periods, the Model Shadow Stock Portfolio has outperformed the Vanguard 500 Index fund in 63% of the periods, while outperforming the Vanguard 500 Index fund in 84% of the rolling 10-year periods over last 30+ years.
You have likely read that stock returns follow a “random walk,” so you cannot predict next year’s performance using the prior-year performance. Academics use a statistical measure called serial correlation to measure the degree to which the return from one period relates to the return in the next period. Serial correlation helps to reveal if the year-by-year returns of an investment are random (no relationship), trending (move in the same direction) or cycle (reverse direction). Serial correlations range from +1 to –1. A serial correlation near zero suggests no pattern, or randomness. Highly positive numbers near 1 indicate a strong trend, while negative numbers near –1 indicate a cycle to the series. The annual returns of large-company stocks have a serial correlation near zero (+0.01), but that does not hold true for the annual returns of small-company stocks. The annual returns themselves of micro-cap stocks have a slight positive serial correlation (+0.14).
When you examine annual small-cap excess return, the serial correlation is +0.40, indicating a likely trend. The trend is not perfect, but the trend pattern of outperformance and then underperformance of small caps tends to occur in patterns.
We have observed this pattern with the annual returns of the AAII Model Shadow Stock Portfolio. During the 30 complete annual years of its operation, the Model Shadow Stock Portfolio has outperformed the large-cap S&P 500 as represented by the Vanguard S&P 500 Index fund in 17 years and underperformed the index in 13 years. What is interesting is that the years of underperformance have come in groups of two or more consecutive years (1995–1996, 1998–1999, 2007–2008, 2014–2015 and 2017–2020). The bear market year of 2022 was one single year during which the AAII Model Shadow Stock Portfolio lagged the Vanguard 500 Index fund.
One cannot predict when the current cycle of underperformance will reverse itself, but history suggests that the patient investor is rewarded over the long term by investing in small-cap stocks. Small-cap stocks have strongly outperformed large-cap stocks during 2021 and the start of 2023.
Low Valuation
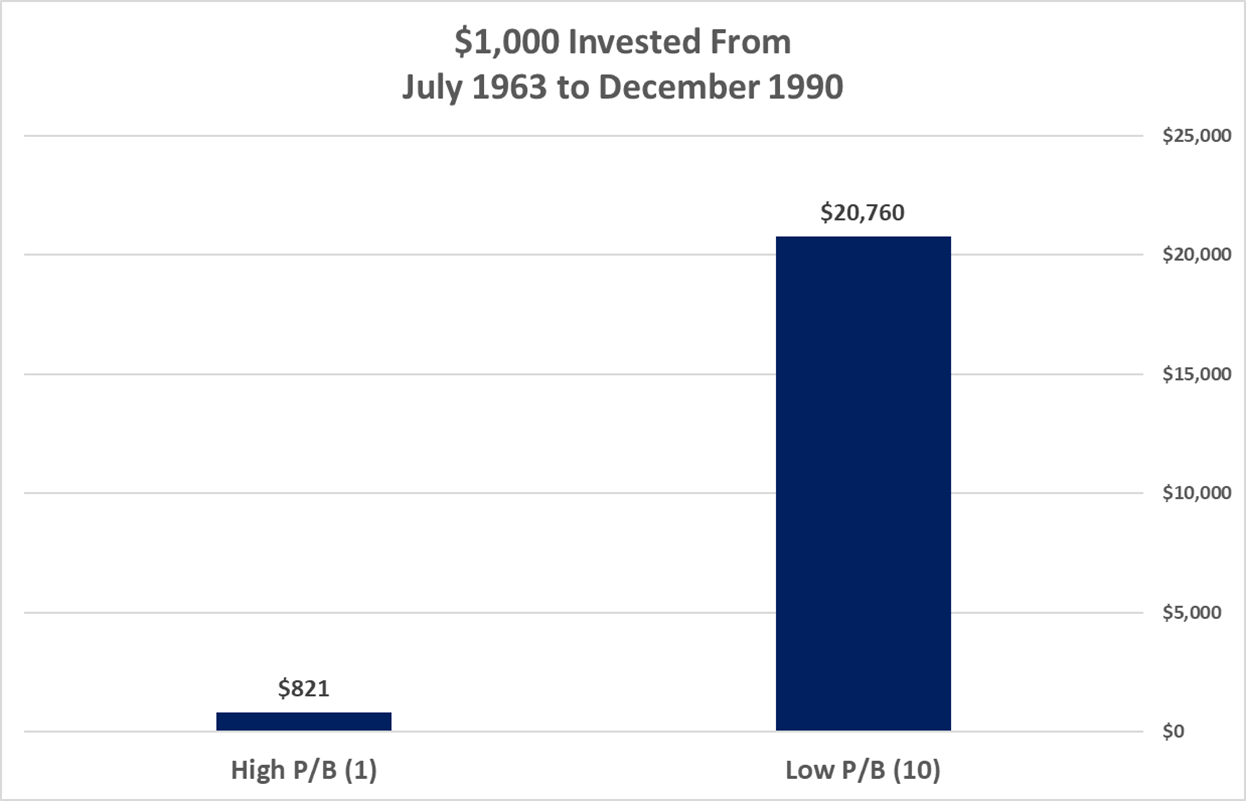
Fama and French’s research also found that companies with high market-to-price ratios [the inverse of the price-to-book-value (P/B) ratio] performed better than those with low measures. The stocks with the lowest price-to-book ratios had the best average annual returns between July 1963 and December 1990, as shown in the table below.

The lowest price-to-book stocks, on average, returned 21.4% per year versus 8.0% for those with the highest price-to-book ratios. This means that the lowest price-to-book stocks outperformed the highest price-to-book stocks by roughly 13.5 percentage points per year between July 1963 and December 1990. So, a $100 investment at the beginning of July 1963 in the stocks with the lowest price-to-book ratios would have grown to $20,760 by the end of 1990, compared to $821 from investing in the highest price-to-book stocks.
A Multi-Factor Strategy
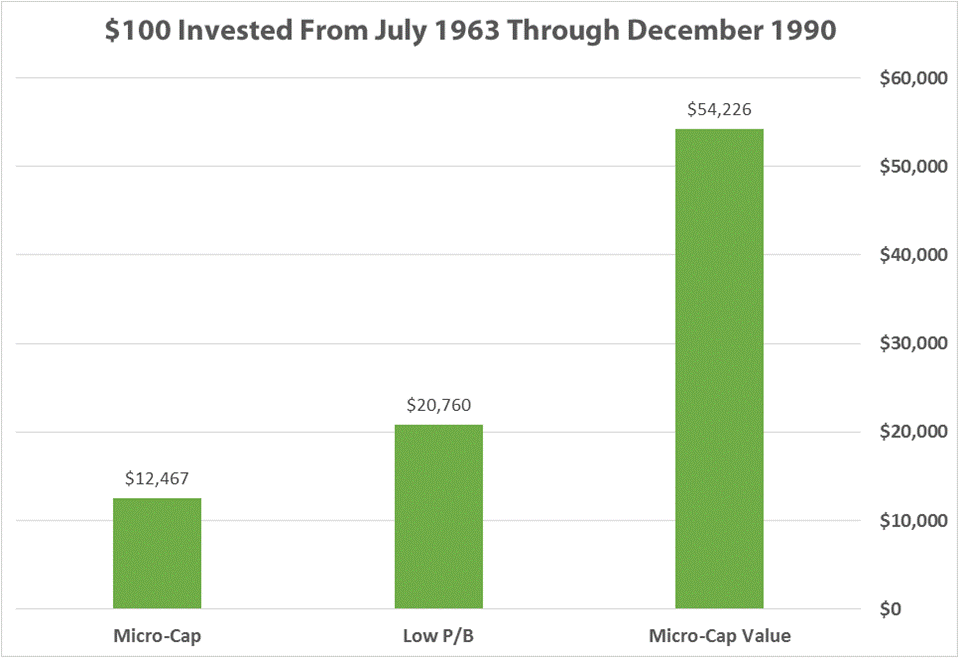
Taken individually, company size and valuation are criteria investors can use to select stocks that, historically, have outperformed the broader market. However, they capture different elements. What Fama and French also discovered in their research is that, when combined, micro-cap and low price-to-book value yield even better performance, as illustrated in the previous table.
Compared to just low price-to-book stocks, a low price-to-book ratio and small-company approach outperformed, on average, by 4.2 percentage points a year (21.4% versus 25.6%). This means that, between July 1963 and the end of 1990, a micro-cap value strategy would have turned $100 into $54,226 versus $20,760 for the lowest price-to-book stocks and $12,467 with only micro-cap stocks.
One counter argument to investing in smaller companies is that they are riskier, and this added risk is the reason for their higher returns. Some argue that, even though the returns of smaller stocks are higher than those of larger stocks, the added risk of smaller companies is not worth the extra returns.
Small-company stocks possess more risk than large-cap stocks on an absolute level. Micro-cap stocks—those in the 10th decile based on market cap—had an average annual standard deviation of 41.5% from 1926 to 2022, compared to 18.9% for the largest stocks in the first decile.
However, Banz and others found that, when adjusted for risk, the returns for small-company stocks still outperformed those of larger-cap stocks. For his research, Banz created five portfolios containing the largest to smallest stocks listed on the NYSE. Over the 50-year period he studied, Banz found that the four portfolios containing the largest NYSE firms generated an average risk-adjusted excess annual return of –0.72%. On the other hand, the portfolio containing the smallest NYSE companies provided a risk-adjusted excess rate of return of nearly 6% per year.
While Banz’ research focused only on NYSE-listed stocks, Thomas Cook and Michael Rozeff from the University of Iowa examined the small-firm effect using stocks listed on the NYSE, American Stock Exchange (AMEX) and those traded over the counter (OTC) over the period of 1968 to 1978. They divided 3,130 stocks into 10 portfolios, each containing an equal number of stocks, on the basis of market cap. What they found was that the four portfolios with the lowest market caps provided risk-adjusted average annual excess returns of 1.69% to 5.54%, while the remaining six portfolios (with the larger stocks) all generated negative annual excess returns ranging from –0.12% to –4.12%.
Beyond the performance benefits of investing in small stocks that we have just covered, research also suggests that there are diversification benefits to adding small-firm stocks to portfolios of large-firm stocks.
The following table illustrates the cross correlations of annual returns for the same deciles in the previous table. In this context, correlation measures how well the stocks in the various market-cap deciles move in relation to each other. Correlation coefficients range between –1 and +1. Perfect positive correlation (a correlation coefficient of +1) implies that as one security moves, either up or down, the other security will move in lockstep, in the same direction. Alternatively, perfect negative correlation means that if one security moves in either direction, the security that is perfectly negatively correlated will move in the opposite direction. If the correlation is 0, the movements of the securities are said to have no correlation; they are completely random.
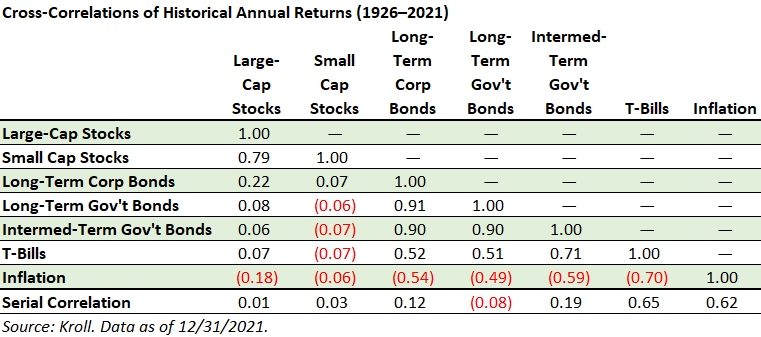
The correlation between micro-cap and large-cap stocks is 0.79. This means that, while the returns of micro-cap and large-cap stocks tend to move in the same direction, they do not do so in lockstep. In addition, the volatility in micro-cap stocks that is attributable to the volatility in the S&P 500—a common measure of the overall market—is 62%.
By creating a portfolio of small-cap and large-cap stocks, you are able to boost the diversification benefits while increasing the expected return.
At the start of this discussion, we mentioned how difficult it is for individual investors to compete with Wall Street professionals. Generally speaking, that is true. However, we have just outlined a segment of the stock market that has yielded significantly greater returns and is nearly impossible for these same Wall Street behemoths to participate in.
To help individual investors gain access to these promising stocks, AAII started its Model Shadow Stock Portfolio in 1993. The portfolio invests in small-company stocks with underlying values that are overlooked by institutions and not covered by many analysts. The Model Shadow Stock Portfolio provides educational guidance for investing in the promising micro-cap value sector of the market. The portfolio was initially conceived to show the membership of AAII how to profit from the most promising academic research to manage a stock portfolio without having to commit a great deal of time and effort in day-to-day monitoring. In fact, AAII manages this stock portfolio by simply reviewing holdings on a quarterly basis.
The Model Shadow Stock Portfolio reflects the following beliefs:
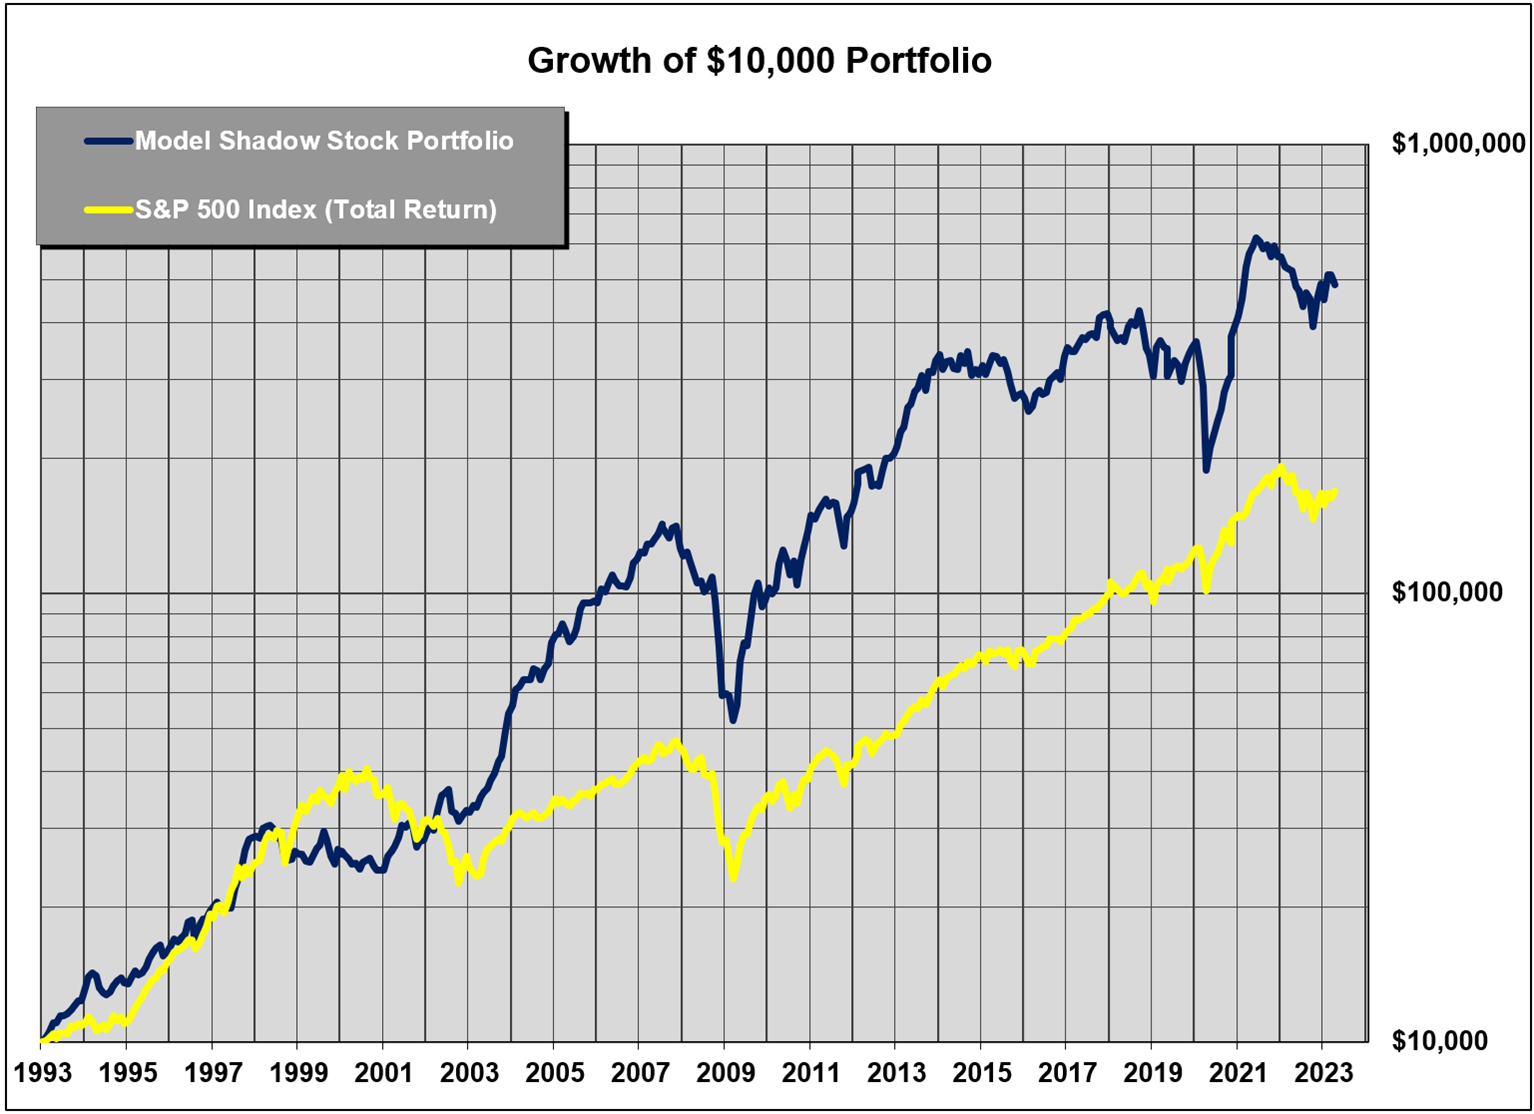
By following a straightforward approach with defined buy and sell rules, the AAII Model Shadow Stock Portfolio has outperformed the S&P 500 significantly—1,290.4% cumulative gain versus 614.4%—over the 20-year period ended March 31, 2023. Since its inception in 1993, the Model Shadow Stock Portfolio has, on average, outperformed the S&P 500 by 390 basis points (3.90 percentage points) per year.
Welcome to the American Association of Individual Investors
AAII is a nonprofit association dedicated to investment education.
For full access to our award-winning content, classrooms, model portfolios and stock screens,
please take a moment to join AAII today for only $1.
|
|
||
Investing in individual stocks isn’t easy, and without a defined plan for when to buy and when to sell, it can be even more difficult. That is why the AAII Model Shadow Stock Portfolio follows a strict set of buy and sell rules that have been developed over time to help eliminate the guesswork from the investment process. We also realize that everyone’s time is precious, so there is only a need for a quarterly review of the purchase, sell and management criteria for your own portfolio of shadow stocks. The regimented nature of the Model Shadow Stock Portfolio means you should only have to commit six to eight hours per quarter to manage your own portfolio of micro-cap value stocks.
Before earning the name “shadow stock,” a stock must meet AAII’s selection rules. These rules are based largely on the research from Fama and French: focusing on those stocks that rank in the bottom 10% of all stocks based on market cap (micro-cap), and in the bottom 10% in terms of price-to-book ratio (value). In addition, these stocks must trade on either the NYSE, AMEX or Nasdaq exchanges (OTC stocks are excluded), and the company must have positive earnings as a measure of financial strength. Lastly, the company must be current in its filings with the U.S. Securities and Exchange Commission (SEC), so the portfolio decisions are based on up-to-date and reliable data.
For many investors, knowing when it’s time to sell a stock is even more difficult than knowing when to buy. Luckily, AAII is with you during both the buy and sell process with the Model Shadow Stock Portfolio. Once again, we have explicit, time-tested sell rules that allow prices to climb yet will also get you out of a stock once it becomes too big or too richly valued.
As an AAII member, you have access to all of the buy and sell rules needed to manage your own shadow stock portfolio. In addition, you can view the actual holdings of our own real-money Model Shadow Stock Portfolio. Then, each quarter, get portfolio updates as well as alerts to any changes that have been made.
By now, we hope we have shown you that micro-cap value stocks have a place in a well-diversified investment portfolio. Academic research and our own real-world experience have shown that investing in micro-cap value stocks—over the long run—will outperform the overall market. Not only can investing in micro-cap value stocks help you outperform the market, but you can also do so with added diversification to your portfolio.
While the S&P 500 returned a total of 614.4% (10.2% annually) over the 20-year period ended March 31, 2023, AAII’s Model Shadow Stock Portfolio guided our members to an impressive return of 1,290.4% (14.1% annually).
Of course, you don’t live on percentage points. You live on MONEY. By following AAII’s members-only Model Shadow Stock Portfolio, a $10,000 investment in 1993 could have earned you $317,471 more than the S&P 500 over the 30-year period. And don’t forget, these are not theoretical or backtested numbers. These values are based on our actual, documented portfolio performance versus the S&P 500 with its dividends reinvested.
By investing the AAII way, you have the opportunity to find promising small-cap value opportunities. As an AAII member, you have access to the very best shadow stock companies along with unbiased direction and assistance to help you make the best investment decisions for YOUR portfolio.
For our special trial rate of just $1, you will be in total control of your investments and more informed about the situations that make them profitable.
We make no representations or warranties that any investor will, or is likely to, achieve profits similar to those shown, because past, hypothetical or simulated performance is not necessarily indicative of future results. Before making an investment decision, you should consider your circumstances and whether the information on our content is applicable to your situation. This information was prepared in good faith and we accept no liability for any errors or omissions. The full disclaimer can be read here.

