

John Bajkowski
is the president of AAII.
 BSET
BZH
CVLG
DFSCX
EBF
GSL
HURC
KTCC
NAESX
PANL
PERI
STRT
ULBI
VFINX
VSEC
BSET
BZH
CVLG
DFSCX
EBF
GSL
HURC
KTCC
NAESX
PANL
PERI
STRT
ULBI
VFINX
VSEC
The Model Shadow Stock Portfolio lost 8.0% during April, lowering its year-to-date performance to a negative 14.2%. The S&P 500 index as measured through the Vanguard 500 Index fund  (VFINX) was down 8.7% in April and is down 13.0% year to date, while the Vanguard Small Cap Index fund (NAESX) lost 8.2% in April and is down 13.5% for the year. The DFA U.S. Micro Cap fund (DFSCX) was down 7.9% during April and is down 12.1% during the first four months of the year.
Value segments held up better than growth-oriented stocks. In the large-cap segment, growth stocks were down 12.5% for the month and are now down 20.0% for the year. Large-cap value stocks were down 4.9% during April and are now down 5.0% year to date.
In the mid-cap segment, value stocks are down 7.2% for the year, after losing 6.6% during April. Mid-cap growth stocks are down 16.0% for the year, after losing 7.6% during the month.
Small-cap value stocks are down 10.0% year to date, while small-cap growth stocks are down 23.4% for the year. Small-cap value stocks lost 7.8% during April, while small-cap growth stocks lost 12.3% during the month.
As the numbers show, market weakness continued during April, with meaningful declines extending to all the main market segments. The market correction observed in the first quarter of the year has extended to a bear market for a number of segments and sectors. A correction is usually defined as a 10.0% to 19.9% decline in the price of a security or index from its most recent peak, while a bear market is a decline of 20% or more.
The Model Shadow Stock Portfolio has been trending down over the last 11 months. With its 8.0% decline during April, it is now down 22.3% from its month-end high level at the end of June 2021. This is now the sixth bear market we have observed for the Model Shadow Stock Portfolio. The Model Shadow Stock Portfolio has had 11 corrections that extended into six bear markets. The average bear market drawdown was 35.1% and lasted an average of 25.5 months.
We thought it might be enlightening to examine the recent price performance, valuation levels and earnings estimate revisions for a cross section of the market. We use AAII’s Stock Investor Pro stock screening and analysis program to capture the data and present a color gradient of the data to more easily spot trends and patterns.
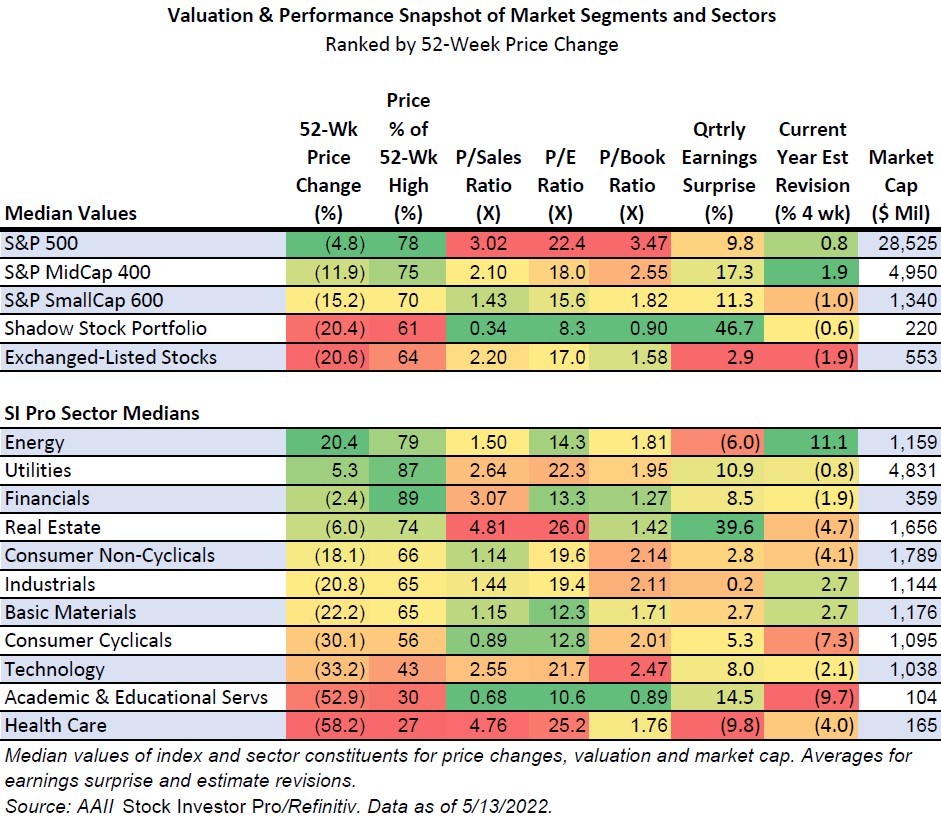
In the top portion of the table, we examined the constituents of the S&P index segments, as well as the current Model Shadow Stock Portfolio and all exchange-listed stocks. The lower portion of the table examines the exchange-traded constituents of the 11 sectors tracked by Refinitiv. Each segment is ranked by median performance over the last 52 weeks of the stocks that make up each index or group.
The typical stock is down over the last 52 weeks, but larger companies have fared better than smaller companies. The median price change for the stocks in the S&P 500 is down 4.8% and the index is trading at 78% of its 52-week high. In the S&P SmallCap 600 index, stocks are down 15.2% over the last year and are trading at 70% of their 52-week high. The Model Shadow Stock Portfolio is down 20.4% over the last 52 weeks and trading at 61% of its 52-week high—closer to the levels for all exchange-listed stocks.
Looking at valuation, larger companies are trading with significantly higher multiples of sales, earnings or book value compared to smaller-cap stocks. The median price-earnings (P/E) ratio is 22.4 for the stocks in the S&P 500 compared to 15.6 for stocks in the S&P SmallCap 600 and 8.3 for stocks in the Model Shadow Stock Portfolio.
It is interesting to note that smaller-company stocks had generally strong positive earnings surprises last quarter. while suffering from downward revisions in estimates for the current fiscal year
Within the sector area, only the companies in the energy and utility sectors showed median price increases over the last 52 weeks. The stocks in the health care sector had the weakest performance, down 58.2% over the last year and consisting of stocks that are down over 70% from their 52-week high.
Within the sector groups, the valuation pattern is not as related to return as seen within the size-based market indexes. For example, the stocks in the health care sector have among the highest price-to-sales (P/S) ratio of 4.76 and price-earnings ratio of 25.2. Energy’s 1.50 price-to-sales ratio is near the midpoint for all sectors, while the median price-earnings ratio of 14.3 is relatively low.
The stocks in the real estate sector had the best positive earnings surprises with a median value of 39.6%, while health care had the largest negative surprises with a median value of –9.8%. There seems to be a stronger connection between estimate revisions and price changes than between earnings surprises and price change. Generally, sectors with stronger upward revisions have stronger 52-week price performance.
The sector and size components reveal the strong impact that these factors can have on the performance of your portfolio.
Twenty-eight stocks met the initial selection criteria for the Model Shadow Stock Portfolio as of May 12, 2022, up from 19 passing stocks one month ago. AAII members can see and research which companies are currently passing the initial selection criteria in the Shadow Stock Ideas table on AAII.com. The list of Shadow Stock Ideas is updated daily—Tuesday through Saturday.
Of the 28 qualifying companies, six are currently held in the Model Shadow Stock tracking portfolio: Container Store Group Inc. (TCS), Fonar Corp. (FONR), Hurco Companies Inc. (HURC), Key Tronic Corp. (KTCC), Pangaea Logistics Solutions Ltd. (PANL) and Strattec Security Corp. (STRT).
Qualifying companies are those held in the Model Shadow Stock Portfolio that currently meet the initial purchase rules. (They are designated as “currently qualifies” in the notes column of the Model Shadow Stock Portfolio table on AAII.com. However, if you go online, the notes may not match the list discussed here since the notes on the website table are dynamically updated daily.)
Advanced Emissions Solutions Inc. (ADES) came off the list of qualifying stocks over the course of the month after it reported negative GAAP earnings per share during the quarter. Covenant Logistics Group Inc.’s (CVLG) price-to-book-value ratio moved above the 0.90 initial limit for qualifying companies.
Two current Model Shadow Stock Portfolio holdings have started passing the initial list of qualifying companies again after not passing since February 11, 2022—Container Store and Pangaea Logistics.
As of May 12, 2022, Perion Network Ltd. (PERI) had the highest price-to-book-value ratio in the Model Shadow Stock Portfolio. Its ratio of 1.65 is above the 0.90 maximum value used for initially qualifying a stock for inclusion in the portfolio. However, stocks are not removed from the portfolio until their price-to-book-value ratio rises to three times the initial maximum value (2.70). Ennis Inc. (EBF) had the second-highest price-to-book ratio in the portfolio of 1.51.
Perion Network also had the highest market capitalization in the portfolio, with a value of $802.1 million as of May 12, 2022. The Model Shadow Stock Portfolio looks for stocks with a market cap (share price times shares outstanding) greater than $30 million but less than $400 million when adding stocks to the portfolio. Shadow stocks with a market cap three times the initial market cap maximum ($400 million × 3 = $1.2 billion) at the time of a quarterly review are removed from the portfolio, assuming there is a suitable replacement. Global Ship Lease Inc. (GSL) has the second-largest market cap of $791.7 million.
Mesa Air Group (MESA) and Ultralife Corp. (ULBI) both reported negative earnings during the quarter, pushing their trailing 12-month adjusted earnings into the red. They have been placed on earnings probation. Once a company is placed on earnings probation, we will monitor its quarterly results and if a subsequent quarter has negative adjusted earnings prior to 12-month adjusted earnings becoming positive, the stock will be sold.
Click here to see the current purchase and sell rules for the portfolio.
The next quarterly review of the AAII Model Shadow Stock Portfolio will take place around the beginning of June 2022, after most of the holdings have announced their quarterly earnings. Any changes to the portfolio will be announced at the time they are made in a special Model Shadow Stock Portfolio Update email (sign up at www.aaii.com/email).
Bassett Furniture Industries Inc. (BSET) was the top-performing stock in the portfolio for the month with a performance of 0.0%. Despite being a consumer cyclical business, the stock scraped through April without the price plunge that affected other stocks, most likely due to its positive earnings report at the end of March.
Beazer Homes USA Inc. (BZH) was the second-best-performing stock in the portfolio, down only 0.9% in April. The company reported earnings and revenue results for the second quarter that beat expectations; more details are below.
VOXX International Corp. (VOXX) was the worst-performing stock in the portfolio for the month, down 24.1% for the month. There was no news for the company during the month, and it is expected to release its fourth-quarter and full-year 2022 financial results on May 17.
Mesa Air Group (MESA) was the second-worst-performing stock in the portfolio, down by 22.7% for April. As a company within the airlines industry—with both personal and freight transportation business—a slowing economy would potentially hurt short-term results. The stock’s price plunge reflects investors’ bearish sentiment in April.
Here are some news highlights from April for the holdings in the Model Shadow Stock Portfolio:
Beazer Homes USA Inc. (BZH) reported second-quarter earnings of $1.45 per share, beating the I/B/E/S consensus estimate by $0.40 per share. Revenue was $508.5 million, reflecting a 7.5% decrease but beating expectations by $19.5 million year over year.
Net income for the quarter was $44.7 million. Adjusted earnings before interest, taxes, depreciation and amortization (EBITDA) were $77.4 million for the quarter, up 20.5%.
“Increases in both home prices and margins allowed us to significantly improve profitability despite continuing supply chain challenges,” said CEO Allan Merrill. “We also increased our lot position and reduced leverage as we continued to demonstrate positive results from our balanced growth strategy.”
The company did not provide a forward-looking statement for the rest of 2022, but I/B/E/S analysts currently expect the company to earn $6.013 per share for full-year 2022.
Covenant Logistics Group Inc. (CVLG) reported first-quarter earnings of $1.35 per share, beating the I/B/E/S consensus estimate by $0.48 per share. Revenue was $291.6 million, reflecting a 32% increase and beating expectations by $27.5 million year over year.
“Despite economic indicators pointing to a slowing freight economy, the first quarter’s freight environment remained robust as a result of strong economic activity, low inventories and supply chain disruptions, accompanied by constrained capacity due to a national driver and equipment shortage,” said CEO David Parker.
The company did not provide a forward-looking statement for the rest of 2022, but I/B/E/S analysts currently expect the company to earn $4.22 per share for full-year 2022.
Ennis Inc. (EBF) reported fourth-quarter earnings of $0.26 per share, missing the I/B/E/S consensus estimate by $0.06 per share. Revenue was $99.7 million, reflecting a 10.9% year-over-year increase but missing expectations by $885,000. Net income for the quarter was $6.6 million.
“While we experienced increased demand for our products during the fiscal year, we were confronted with rising raw material and logistics costs, delayed delivery times, and labor shortages, all of which continued throughout the year,” said CEO Keith Walters.
The company did not provide a forward-looking statement for the rest of 2022, but I/B/E/S analysts currently estimate the company to earn $1.38 per share for full-year 2022.
Global Ship Lease Inc. (GSL) reported first-quarter 2022 earnings per share of $1.91, in line with the I/B/E/S consensus estimate. Net income totaled $70.1 million, compared to $4.2 million a year ago.
Revenue for the quarter totaled $153.6 million, up 110% over the $73 million reported in the same period of 2021. The company had an operating income of $86.1 million for the period, up from $30.2 million reported a year ago.
The company did not provide a forward-looking statement for the rest of 2022, but I/B/E/S analysts currently estimate the company to earn $7.684 per share for full-year 2022.
The company also declared a dividend of $0.375 per share for the first quarter of 2022, payable on June 2 to shareholders on record of as of May 24.
Perion Network Ltd. (PERI) reported second-quarter 2022 earnings of $0.44 per share, which beat the I/B/E/S consensus estimate of $0.28 per share by 57%. This represents a 132% increase in earnings from the same period last year. The company reported quarterly sales of $125 million, which beat the analyst consensus estimate of $122 million by 2.7%.
“Our exceptional financial performance is a direct result of our diversification strategy, our continuing investment in high-impact innovation and our ability to connect the supply and demand sides of the open-web to our central iHub, an intelligent control system,” said CEO Doron Gerstel. “The iHub embodies our diversification strategy, which was built through significant organic innovation and successful strategic acquisitions.”
The company did not provide a forward-looking statement for the rest of 2022, but I/B/E/S analysts currently expect the company to earn $1.343 per share for full-year 2022.
Strattec Security Corp. (STRT) reported third-quarter fiscal-2022 earnings per share of $0.80, missing the I/B/E/S consensus estimate of $0.86 per share. Net income totaled $3.1 million, compared to $4.5 million a year ago.
Revenue for the quarter totaled $115.9 million, down 4.7% over the $121.6 million reported in the same period of 2021. The company had operating income of $3.4 million for the period, down from $6.7 million reported a year ago. Gross profit was $14.6 million, or 12.6% of revenue, compared to $18.6 million, or 15.3% of revenue, for the same quarter a year ago.
“We have effectively dealt with supply chain challenges and cut expenses to align with lower production volumes forced upon our customers,” said CEO Frank Krejci. “While facing inflationary material costs, we have implemented efficiency improvements to somewhat offset the spikes in costs. Those efficiency improvements will provide long-term benefits for us.”
The company did not provide a forward-looking statement for the rest of 2022, but I/B/E/S analysts currently expect the company to earn $2.51 per share for full-year 2022.
Ultralife Corp. (ULBI) reported a first-quarter 2022 loss per share of $0.10, beating the I/B/E/S consensus estimate for a loss per share of $0.50 by 80%. Net loss totaled $0.2 million, compared to net income of $0.7 million a year ago.
Revenue for the quarter totaled $30.4 million, up 16.9% over the $26 million reported in the same period of 2021. The company had an operating loss of $0.3 million for the period, down from $1 million reported a year ago. Gross profit was $7.0 million, or 22.9% of revenue, compared to $7.0 million, or 26.9% of revenue, for the same quarter a year ago.
“Strong order flow in commercial end-markets, particularly medical and oil & gas, along with a lift from recently acquired Excell Battery Group, more than offset supply chain constraints that continued to delay our government/defense revenues,” said CEO Michael Popielec. “Robust demand across the business boosted backlog at quarter-end to approximately $92 million, of which approximately $74 million is due to ship in 2022 representing a 26% increase over the comparable backlog exiting 2021.”
The company did not provide a forward-looking statement for the rest of 2022, but I/B/E/S analysts currently estimate the company to earn $0.24 per share for full-year 2022.
VSE Corp. (VSEC) reported first-quarter 2022 earnings per share of $0.72, beating the I/B/E/S consensus estimate of $0.54 per share by 33%. Net income for the quarter was $6.2 million, a 21.6% increase over the first quarter of 2021.
Total revenue for the quarter totaled $231.2 million, a 40.1% increase over the comparable quarter of 2021. The company had gross profit of $17.5 million representing a gross profit margin of 7.5%, compared with sales of $165 million and a gross profit margin of 8.4% a year ago. Operating income for the quarter was $11.9 million representing an operating profit margin of 5.1%, compared to $9.6 million and 5.8% a year ago.
The company did not provide a forward-looking statement for the rest of 2022, but I/B/E/S analysts currently expect the company to earn $2.79 per share for full-year 2022.
 Get updates about the portfolio that has outperformed the market by 211.9%
since inception!
Get updates about the portfolio that has outperformed the market by 211.9%
since inception!