


John Bajkowski
is the president of AAII.
“The real key to making money in stocks is not to get scared out of them.”
—Peter Lynch
As investors, our convictions are frequently tested. We may understand intellectually that the stock market offers the greatest opportunity to maximize our long-term wealth, but we must have the emotional strength to live with the short-term volatility that helps to boost long-term stock returns.
The domestic stock market officially fell into a bear market during the second quarter of the year. A bear is normally defined as a 20% or more price decline from the most recent market peak. The Model Shadow Stock Portfolio declined 7.6% during June and is now down 22.3% year to date for the first half of the year. The S&P 500 index as measured by the Vanguard 500 Index fund  (VFINX) has lost 20.0% during the first six months of the year after giving up 8.3% during June. The Vanguard Small Cap Index fund (NAESX) is down 21.7% year to date after falling 9.4% during the month. June was certainly a brutal month for investors.
As the headlines have noted, it was the worst first half of the year since 1970. The Nasdaq 100 is down 29.2% year to date. The S&P MidCap 400 index is down 19.6% and the Russell 2000 small-cap index is down 23.5% for the year. Value stocks have generally held up better than growth stocks this year.
Large-cap value stocks are down 11.4% for the year, after losing 8.2% during June. Lage-cap growth stocks are down 27.6% for the year, after falling 8.3% during the month.
In the mid-cap segment, value stocks are down 14.0% for the year, after giving up 9.3% during June. Mid-cap growth stocks are down 25.0% for the year, after losing 10.0% during the month.
Small-cap value stocks are down 17.3% year to date, while small-cap growth stocks are down 29.5% for the year. Small-cap value stocks lost 9.9% during June, while small-cap growth stocks lost 6.2% during the month.
The Model Shadow Stock Portfolio is down 29.6% since the end of May 2021. A 10% decline is considered a correction. On average, the market has had a 10% correction once per year over the long term. Most corrections last around two months. Historically, the stock market has had a bear market every three to five years. No matter how severe the bear market, the stock market has eventually turned around and gone on to hit new highs.
It may be tempting to think that you can improve your rate of return by getting out of the market during declines and jumping back in when the market improves. However, it has been shown that the best and worst trading days tend to be clustered together. Missing the worst days typically also means missing the best days. Note that six of the 10 best trading days of the market occurred within two weeks of the 10 worst trading days.
A JPMorgan study notes that as of year-end 2021, “seven of the best days have occurred within two weeks of their corresponding worst day; often the spread is much closer than that ... Moreover, the worst days overwhelmingly occur before the best days: over the last 20 years, six of the seven best days occurred after the worst day.”
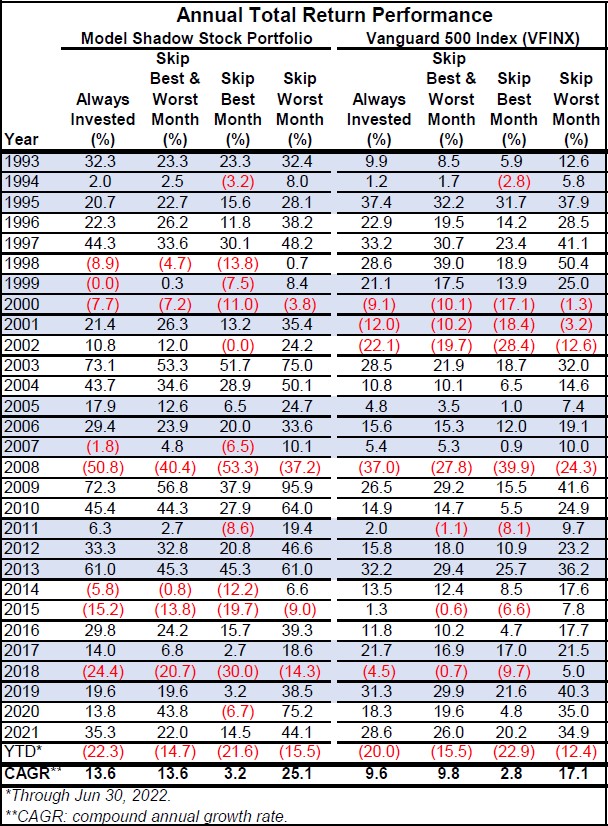
We thought it would be revealing to see what impact simply missing the best-performing month of a given year would have on the return realized by the Model Shadow Stock Portfolio for the year and how that would impact its long-term rate of return. The table below displays the year-by-year returns for the Model Shadow Stock Portfolio and the Vanguard 500 Index fund. The first column shows the annual return for each year and then the annual return if both the worst month and the best month is ignored each year followed by impact on return if the best month during the year was ignored for each year and the worst month of each calendar year is excluded.
For example, the Model Shadow Stock Portfolio gained 32.3% during 1993. The greatest monthly gain during 1993 came in December, when the portfolio gained 7.32%. Due to the impact of compounding, the annual return for the Model Shadow Portfolio is reduced from 32.3% to 23.3% when the impact of gaining 7.32% during December of that year is taken out of the equation [(1 + 0.323) ÷ (1 + 0.0732) – 1]. June 1993 saw the weakest performance during 1993, but the portfolio only lost 0.04%, so the impact of excluding the loss for the year was minimal, improving the return from 32.3% to 32.4%.
Being out of the market during the best-performing month each year over the 29.5-year history of the Model Shadow Stock Portfolio reduced the compound annual growth rate (CAGR) from 13.6% to 3.2%.
If you were out of the market during the worst month of each year, the compound annual growth rate is increased from 13.6% to 25.1%.
Even more surprising was the impact of being out of the market for both the best and worst month of each year. The 13.6% return of the Model Shadow Stock Portfolio as a result of skipping both the best and worst month matches the 13.6% of being fully invested.
The total annual return of the Vanguard 500 Index fund is reduced from 9.6% to 2.8% when out of the market during its best month each year, while jumping to 17.1% if the worst month is ignored each calendar year. Ignoring both the best and worst month results in an annual return of 9.8%, just above the 9.6% compound annual return of being fully invested over the last 29.5 years.

The allure of market timing is certainly strong. The reality is that it is very difficult to successfully time entry and exit points. Many successful trend-following investors acknowledge that the primary benefit of market timing is reducing extreme volatility, not boosting long-term rates of returns.
To visually illustrate the year-by-year impact of removing the best-performing month for each year, we created a bar chart that shows the total gain for each year and how much lower the annual return would be if it is reduced by being out of the market during the best month of the year. The green portion of each bar represents the contribution of the best month of each year to the annual performance of the Model Shadow Stock Portfolio.
Running the numbers, 38 stocks met the initial selection criteria for the Model Shadow Stock Portfolio as of July 13, 2022, up from 28 passing stocks one month ago. AAII members can see and research which companies are currently passing the initial selection criteria in the Shadow Stock Ideas table on AAII.com. The list of Shadow Stock Ideas is updated daily—Tuesday through Saturday.
Of the 38 qualifying companies, seven are currently held in the Model Shadow Stock Portfolio: Container Store Group Inc. (TCS), Fonar Corp. (FONR), Hooker Furnishings Corp. (HOFT), Hurco Companies Inc. (HURC), Key Tronic Corp. (KTCC), Pangaea Logistics Solutions Ltd. (PANL) and Strattec Security Corp. (STRT). Qualifying companies are those held in the Model Shadow Stock Portfolio that currently meet the initial purchase rules. (They are designated as “currently qualifies” in the notes column of the Model Shadow Stock Portfolio table on AAII.com. However, if you go online, the notes may not match the list discussed here since the notes on the website table are dynamically updated daily.)
Big 5 Sporting Goods Corp. (BGFV) came off the qualifying list over the course of the month when its price-to-book level went above 0.90 to 0.96. Pangaea Logistics Solutions started to pass the initial list of qualifying companies again when its price-to-book level went back below 0.90.
As of July 13, 2022, Ennis Inc. (EBF) had the highest price-to-book ratio in the Model Shadow Stock Portfolio with a ratio of 1.67. Shadow stocks with a price-to-book ratio three times the initial market-capitalization maximum (0.90 × 3 = 2.70) at the time of a quarterly review are sold from the portfolio, assuming there is a suitable replacement.
Perion Network Ltd. (PERI) has the highest market-cap value of $804.0 million as of July 13, 2022. The Model Shadow Stock Portfolio looks for stocks with a market cap (share price times shares outstanding) greater than $30 million but less than $400 million when adding stocks to the portfolio. Shadow stocks with a market cap three times the initial market-cap maximum ($400 million × 3 = $1.2 billion) at the time of a quarterly review are sold from the portfolio, assuming there is a suitable replacement.
Click here to see the current purchase and sell rules for the portfolio.
The next quarterly review of the AAII Model Shadow Stock Portfolio will take place around the beginning of September 2022, after most of the holdings have announced their quarterly earnings. Any changes to the portfolio will be announced at the time they are made in a special Model Shadow Stock Portfolio Update email (sign up at www.aaii.com/email).
Ennis Inc. (EBF) was the highest-performing stock in the portfolio during June, increasing 11.5%. During the month, Ennis reported quarterly earnings. Read more about it below.
Basset Furniture Industries Inc. (BSET) was the second-best-performing stock in the portfolio for June, up by 11.3%. During the month, Ennis reported quarterly earnings. Read more about it below.
Mesa Air Group (MESA) was the second-worst-performing stock in the portfolio for June, down 28.7%. There was no company-specific news during June.
Dixie Group Inc. (DXYN) was the worst-performing stock in the portfolio for June, down 36.0%. There was no company-specific news during the month of June.
Here are some news highlights from June for the holdings in the Model Shadow Stock Portfolio:
Bassett Furniture Industries Inc. (BSET) announced the financial results for second-quarter 2022. The company reported diluted earnings per share of $4.94, beating the I/B/E/S consensus estimate of $0.45 per share. The company reported net income of $47.1 million.
The significantly elevated net income and earnings per share are a direct result of Bassett Furniture’s sale of Zenith Logistics in February 2022 for $87 million. Earnings per share from continuing operations totaled $0.81, compared to $0.51 per share in the comparable quarter of 2021. Revenue totaled $128.7 million, a 17% increase over the comparable quarter of 2021. Retail sales grew faster than wholesale, at 21% and 15.3% respectively.
The company did not disclose any estimations for the remainder of fiscal-year 2022. I/B/E/S currently estimates that the company will have diluted earnings per share of $6.62, up from $4.33 per share projected three months ago.
Ennis Inc. (EBF) reported first-quarter 2023 earnings per share of $0.45, which increased year over year from $0.28 per share. Earnings beat the I/B/E/S consensus estimate of $0.30 per share by 50.0%. Net sales of $107.7 million increased by 11.1% over the same period.
Gross profit increased to $34.0 million from $29.2 million in the first quarter of 2022. The company made pricing adjustments to cover inflationary costs and improved efficiency which led to gross margin increasing from 30.1% a year ago to 31.6%.
“North American paper markets remain extraordinarily tight, and further substantial price increases will continue to be a very real possibility until demand declines return in enough force and for long enough to rebalance the short-supplied market,” said CEO Keith Walters. “Our profitability and strong financial condition will allow us to continue operations and fund acquisitions without incurring debt.”
Ennis repurchased approximately 64,000 shares of common stock in the first quarter at an average price of $17.46 per share. The company also declared a regular quarterly dividend of $0.25 per share, in line with its previous declaration. The dividend is payable on August 8 to shareholders of record as of July 8.
Hooker Furnishings Corp. (HOFT) reported first-quarter 2023 earnings per share of $0.26, which decreased year over year from $0.78 per share. Earnings missed the I/B/E/S consensus estimate of $0.28 per share by 3.6%. Net sales of $147.3 million decreased by 9.5% over the same period.
Sales and profitability reductions versus the comparable prior-year periods were largely driven by COVID-related factory shutdowns in Asia beginning late summer 2021. Gross profit decreased to $29.4 million from $33.6 million in the first quarter of 2022.
“Despite continued supply chain disruptions and high transit costs, we are pleased to have started fiscal 2023 with very strong backlogs, a leaner portfolio focused on our most profitable channels and products and with the acquisition of Sunset West, a leading player in the growing outdoor furnishings market,” said CEO Jeremy Hoff.
The company expects its variable cost business model to allow them to adjust to changing economic conditions.
Hurco Companies Inc. (HURC) reported first-quarter 2022 earnings per share of $0.30, which decreased year over year from $0.36 per share. Net sales of $62.8 million increased by 8.0% over the same period.
Gross profit increased to $15.6 million from $14.8 million in the first quarter of 2021. The company saw margins decrease due to inflationary pressures.
“The improvement in sales and operating income have come at a time when we face many challenges including unusually high inflation, vendor delays, competitive labor markets, continued COVID-19 lockdowns in certain markets and volatility of foreign currencies,” said CEO Greg Volovic. “Our year-to-date sales reflect strong sales, with all regions contributing to this overall growth in sales.”
The company declared a regular quarterly dividend of $0.15 per share, in line with its previous declaration. The dividend is payable on July 11 to shareholders of record as of June 27.
 Get updates about the portfolio that has outperformed the market by 211.9%
since inception!
Get updates about the portfolio that has outperformed the market by 211.9%
since inception!