

John Bajkowski
is the president of AAII.
 AP
DCO
DFSCX
EBF
GSL
HOFT
HURC
KE
KTCC
NAESX
NC
PANL
PERI
RCKY
STRT
TITN
ULBI
VFINX
VPG
AP
DCO
DFSCX
EBF
GSL
HOFT
HURC
KE
KTCC
NAESX
NC
PANL
PERI
RCKY
STRT
TITN
ULBI
VFINX
VPG
The Model Shadow Stock Portfolio is reviewed quarterly to determine portfolio sales and additions, a practice put in place since the portfolio’s inception in 1993.
The quarterly review cycle of the Model Shadow Stock Portfolio is tied to the reporting cycle of most domestic publicly traded firms. After the reporting cycle is complete, holdings are examined for violating the size, valuation, earnings and age rules of the Model Shadow Stock Portfolio.
The review begins with an examination of the breakpoints for the smallest and cheapest deciles of domestically listed stocks. The primary Model Shadow Stock Portfolio selection criteria target the intersection of the smallest 10% of domestic stocks as measured by market capitalization, along with the “cheapest” 10% of domestic stocks as measured by the price-to-book-value (P/B) ratio. These decile breakpoints are determined by examining domestic companies that are listed on the New York Stock Exchange (NYSE) and then applying the size and value breakpoints for stocks listed on all domestic exchanges. Professor Kenneth R. French provides a historical review of the breakpoints on his Dartmouth faculty website. We also calculate these breakpoints using AAII’s Stock Investor Pro stock screening and analysis software program.
The price-to-book cutoff has decreased slightly from 0.89 in June to 0.88. With the current initial qualifying maximum price-to-book ratio at 0.90, we are leaving it unchanged. Qualifying stocks must have a price-to-book ratio of 0.90 or lower. Stocks in the model portfolio are sold for valuation if they exceed three times the minimum initial price-to-book ratio at the time of a quarterly portfolio review. In other words, for this quarter’s review we use a price-to-book cutoff of 0.90 to screen for stocks to add to the Model Shadow Stock Portfolio and 2.70 (0.90 × 3) as the maximum price-to-book ratio to keep stocks in the portfolio.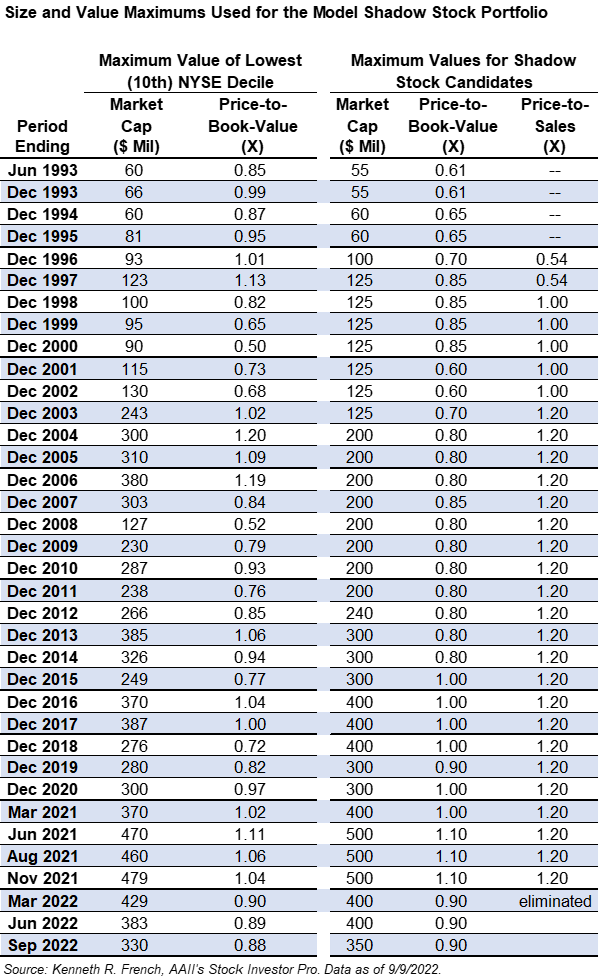
As of September 9, 2022, Perion Network Ltd.  (PERI) had the highest price-to-book-value ratio in the Model Shadow Stock Portfolio. Perion Network is an Israel-based technology company that delivers online advertising solutions and search monetization to brands and publishers. Its price-to-book ratio of 1.92 is below the 2.70 value used to remove stocks from the model portfolio. Therefore, no stocks are being sold this quarter for exceeding the valuation limit of the model portfolio.
We then examined market-cap levels of the companies listed on the NYSE to determine the size cutoff for the lowest decile. Here the market-cap level maximum was $330 million, compared to $383 million in June 2022. With the current initial qualifying market-cap level of $400 million, we are reducing the maximum initial market cap value to $350 million. The maximum market cap for inclusion in the Model Shadow Stock Portfolio is $350 million, and holdings are sold if their market cap goes above three times the initial criterion at the time of the quarterly review: $1.05 billion.
Perion Network also had the highest market cap in the portfolio, with a value of $948.6 million as of September 9, 2022. Its market cap was just below the removal level of $1.05 billion, so no stocks are being removed this quarter for exceeding the size limit of the model portfolio.
The other major factor that leads to portfolio turnover is tied to negative earnings. If a company has trailing 12-month earnings from continuing operations that are negative, the stock is placed on probation; if a subsequent quarter has negative earnings prior to trailing 12-month earnings becoming positive, the stock is sold. When available, adjusted (non-GAAP) earnings are used to put stocks on probation or sell them. These are earnings that have been adjusted to eliminate the impact of nonrecurring events such as markdown of inventory or goodwill. These are earnings reported in the press and firms reporting consensus estimates. The I/B/E/S adjusted earnings reported in Stock Investor Pro are used for Model Shadow Stock Portfolio decisions when they are available.
Dixie Group Inc. (DXYN) reported a normalized earnings loss of $0.29 per share for its 2022 second quarter, compared to a gain of $0.21 per share for the same period one year ago. The quarterly loss moves its trailing 12-month earnings into the red and places the firm on earnings probation.
Coming into this quarter, Ampco-Pittsburgh Corp. (AP), Mesa Air Group (MESA) and Ultralife Corp. (ULBI) were on earnings probation.
Ampco-Pittsburgh and Ultralife both reported positive quarterly earnings from continuing operations. They both remain on probation until trailing 12-month earnings turn positive.
Mesa Air Group, however, reported an earnings loss of $0.20 per share on August 8, 2022, and is being removed from the Model Shadow Stock Portfolio.
After conducting the quarterly review of the Model Shadow Stock Portfolio, Mesa Air Group was removed from the tracking portfolio during regular trading hours on Monday, September 12. With the proceeds from the sale, as well as the cash held in the portfolio, there were enough funds to purchase one new holding at a level roughly matching the average position—NACCO Industries Inc. (NC).
Mesa Air Group (MESA)
Headquartered in Phoenix, Arizona, Mesa Air Group is the holding company of Mesa Airlines, a regional air carrier providing scheduled passenger service to 121 cities in 41 states, the District of Columbia, the Bahamas and Mexico, as well as cargo services out of Cincinnati/Northern Kentucky International Airport. As of June 30, 2022, Mesa Air operated a fleet of 168 aircraft with approximately 360 daily departures and 2,600 employees. Mesa Air operates all of its flights as either American Eagle, United Express or DHL Express flights.
Mesa Air Group noted that while demand remained strong, its financial results were hurt by a lack of pilots, both from attrition of existing pilots and fewer new pilots in the “commercial pilot pipeline” who must complete 1,500 flight hours before they can work at an airline. Many senior pilots took early retirement packages at the major airlines, allowing regional pilots move up, but leaving the regional airlines with a shortage of pilots. In 2013 the flight requirement for new airline pilots was increased from 250 hours to 1,500 hours, following the 2009 crash of Colgan Air flight 3407, which crashed primarily due to pilot error.
It is the policy of the Model Shadow Stock Portfolio to sell a stock once its trailing 12-month adjusted earnings go negative and the company reports a quarterly loss in a subsequent quarter while trailing earnings are still negative.
Mesa Air Group is being removed from the portfolio because of the Model Shadow Stock Portfolio’s negative earnings rule. Mesa Air Group reported an adjusted earnings loss of $0.20 per share, while trailing adjusted earnings per share remained in the red. Adjusted trailing 12-month earnings per share first turned negative on May 9, 2022, when the company reported a loss of $0.29 per share on adjusted quarterly earnings.
Mesa Air Group was purchased for the Model Shadow Stock Portfolio on June 4, 2019, at a purchase price of $8.95. It was sold on September 12, 2022, for $2.40 per share, for a loss of 73.2%.
As of September 9, 35 stocks met the initial selection criteria for the Model Shadow Stock Portfolio. This is up from 28 passing companies last month, even after tightening the maximum market-cap level from $400 million to $350 million. AAII members can see and research which companies are currently passing the initial selection criteria in the Shadow Stock Ideas table on AAII.com. The list of new Shadow Stock Ideas is updated daily—Tuesday through Saturday.
Nine stocks already in the Model Shadow Stock Portfolio passed the updated criteria at the time of the review: Container Store Group Inc. (TCS), Delta Apparel Inc. (DLA), Fonar Corp. (FONR), Hooker Furnishings Corp. (HOFT), Hurco Companies Inc. (HURC), Key Tronic Corp. (KTCC), Pangaea Logistics Solutions Ltd. (PANL), SigmaTron International Inc. (SGMA) and Strattec Security Corp. (STRT).
The remaining 26 stocks were examined to ensure adequate liquidity, timely financial filings and appropriate industry and foreign considerations. Four securities were eliminated because they were limited partnerships or had ties to China. Seven stocks were also excluded from consideration because their average daily dollar trading volume was too low, indicating that they might be difficult to purchase without severely impacting the share price.
The Shadow Stock Portfolio Rules on AAII.com provides guidance on factors to consider when selecting stocks for your portfolio.
Price momentum is used as the tiebreaker among qualifying stocks. The remaining 15 stocks were ranked using the weighted relative strength ranking, which considers price performance over the last year but places a higher weight on the most recent quarterly price performance.
With the proceeds from the Mesa Air Group sale and the existing cash position of the Model Shadow Stock Portfolio, there were enough funds to take a position in one company at roughly the average position size for the existing holdings in the tracking portfolio. The portfolio addition is:
NACCO Industries, Inc. (NC)
NACCO Industries is a holding company operating through three business segments: coal mining, North American Mining and minerals management. The coal mining segment operates surface coal mines for power generation companies and an activated carbon producer. The North American Mining segment is a mining partner for producers of aggregates, lithium and other minerals. The minerals management segment acquires and promotes the development of mineral interests. The company also provides stream and wetland mitigation solutions.
NACCO Industries has a book value per share of $54.93 as of June 30. If you wish to stay within the 0.90 price-to-book-value maximum, you should pay no more than $49.44 per share ($54.93 × 0.90). However, if the stock price has moved up after being added to the portfolio, you can still purchase the stock unless the price-to-book ratio goes above 1.00, which equates to a price of $54.93 per share. To calculate the maximum purchase price based on the maximum desired price-to-book ratio, multiply the current book value per share ($54.93 for NACCO Industries) by the maximum price-to-book ratio to be considered for the Model Shadow Stock Portfolio (currently 0.90, or 1.00 for loosened consideration).
The next quarterly review of the Model Shadow Stock Portfolio will take place following the end of November 2022. Any changes to the portfolio will be announced at the time they are made in our Model Shadow Stock Portfolio Update emails (sign up at www.aaii.com/email).
A hawkish tone from Federal Reserve chair Jerome Powell helped to fuel a stock sell-off in August. Investors considered a greater likelihood of economic slowdown as the Fed seeks to rein in inflation. Small-cap and value stocks held up better in August than the broad market. The Model Shadow Stock Portfolio lost 2.8% during August 2022 and is now down 19.1% for the year. The S&P 500 index as measured by the performance the Vanguard 500 Index fund (VFINX) had a loss of 4.1% during August and is down 16.2% for the first eight months of the year. The Vanguard Small Cap Index fund (NAESX) is down 15.7% for the year after shedding 2.6% in August. The DFA U.S. Micro Cap fund (DFSCX) lost 3.1% during August and is down 12.5% for the year.
In the large-cap segment, growth stocks were down 5.3% during August, contributing to a 22.7% loss year to date for 2022. Large-cap value stocks were down 2.8% during August and are now down 8.9% year to date.
In the mid-cap segment, growth stocks are down 18.3% for the year, after losing 3.4% during August. Mid-cap value stocks are down 8.8% for the year, after losing 2.9% during the month.
Small-cap growth stocks are down 22.3% year to date, while small-cap value stocks are down 12.2%. Small-cap growth stocks lost 0.9% during August, while small-cap value stocks lost 3.2% during the month.
Since its inception in 1993, the AAII Model Shadow Stock Portfolio has a compound annual average return of 13.7% versus the Vanguard 500 Index fund’s gain of 9.7% per year on average over the same period. Over the same period, the Vanguard Small Cap Index fund also posted an average annual gain of 9.7%.
We first presented a table of market-cap and industry sector performance, valuation and fundamentals in the May Model Shadow Stock Portfolio update.
The table below provides an updated perspective while supplying additional information on profit margins. We used AAII’s Stock Investor Pro stock screening and analysis program to capture the data and present a color gradient of the data to more easily spot trends and patterns across the various segments.
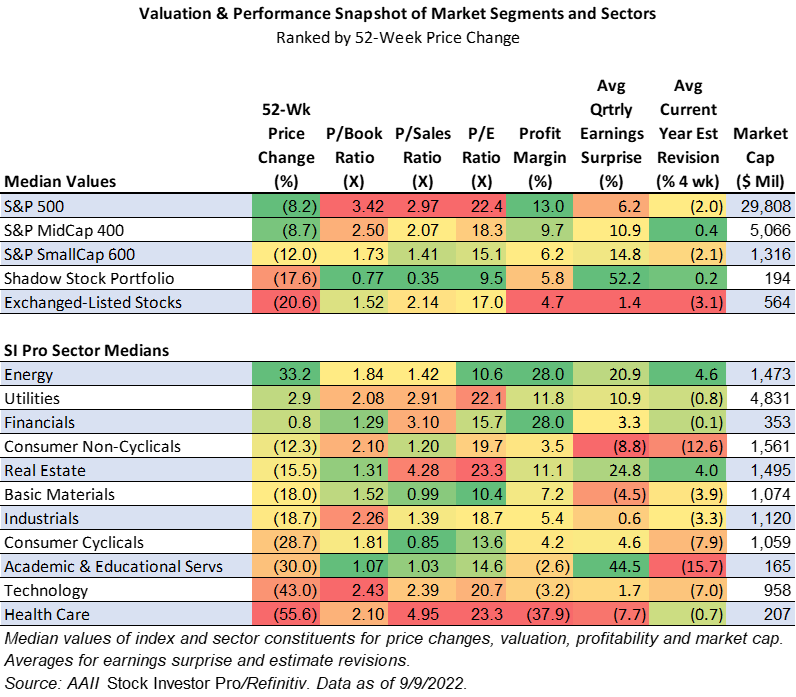
The top portion of the table examines the constituents of the S&P market-cap groupings, as well as the current Model Shadow Stock Portfolio and all stocks. The lower portion of the table examines the exchange-traded constituents of the 11 sectors used by Refinitiv to provide broad industry groupings. Each section is ranked by the median performance over the last 52 weeks of the stocks that make up each index or sector.
The typical stock is down over the last 52 weeks, but larger companies have fared better than smaller companies. The median price change for the stocks that make up the S&P 500 is down 8.2% over the last year. In contrast, the constituents of the S&P SmallCap 600 index are down 12.0% over the last year, while stocks in the S&P MidCap 400 index are down 8.7%. The stocks in the Model Shadow Stock Portfolio are down 17.6% over the last 52 weeks—closer to the level for all exchange-listed stocks, which are down 20.6%.
Looking at valuation, larger companies continue to trade with significantly higher multiples of book value, sales or earnings compared to smaller-cap stocks. The median price-earnings (P/E) ratio is 22.4 for the stocks in the S&P 500 compared to 15.1 for stocks in the S&P SmallCap 600 and 9.5 for stocks in the Model Shadow Stock Portfolio. Stocks normally trade with higher price-earnings ratios if investors anticipate higher future earnings growth as well as lower risk of achieving growth.
We have added a column that looks at the median profit margin, which is net income divided by revenue. Profit margin relates the ability of a company to convert top-line sales into bottom-line earnings. One can argue that if earnings drive stock prices, stock prices will go up as revenue increases, more of that revenue is converted into earnings (profit margin) and investors are willing to pay a greater multiple for a given level of earnings. The table confirms a strong connection between recent profitability and price strength. With the economic uncertainty, investors have emphasized investing in companies with high quality of earnings and greater financial strength. It is also interesting that while smaller companies had stronger positive earnings surprises than larger companies last quarter, the positive surprises did not translate to better stock price performance.
That reward for companies with greater profitability and stability can also be seen within the sector table section. Only the companies in the energy, utility and financial sectors showed median price increases over the last 52 weeks. The stocks in the health care sector had the weakest performance, down 55.6% over the last year.
The health care sector is one of the largest groups, with 1,226 exchange-listed companies. Only the financial sector is larger, with 1,383 stocks. As group, the health care sector consists of many small companies ($207 million median market cap) which have been very unprofitable recently (net profit margin of negative 37.9%). Yet the stocks in the group have among the highest valuations (median price-earnings ratio of 23.3 times trailing earnings.) The stocks in the health care sector also have some of the largest average negative earnings surprises (averaging negative 7.7% last quarter). The poor recent fundamental performance may help to explain the recent weak stock performance. But keep in mind that we have seen the weakest-performing sector one year become the best-performing sector in the next year, if the factors hurting their fundamental performance change.
It is not generally good advice to simply chase last year’s hot sector or hot mutual fund without first assessing if the environment that led to its success will continue going forward. Energy had the strongest performance over the last 52 weeks, yet the stocks trade with relatively low valuations, high profit margins and positive earnings surprises and revisions. Energy prices have been boosted by the war in Ukraine, which restricted the flow of oil and natural gas. Energy supply has been restricted, but now the market is concerned about reduced demand if we have a global recession. It is common for cyclical stocks to trade with low price-earnings ratios near the end of an economic expansion if investors anticipate a slowdown in profits going forward.
Ultralife Corp. (ULBI) was the best-performing stock in the portfolio for August, up by 11.6%. There was no specific news to account for the stock’s rise, but the company reported a positive earnings surprise for the second quarter of 2022 at the end of July.
Vishay Precision Group Inc. (VPG) was the second-best-performing stock in the portfolio for the month, up 10.0%. During the month, Vishay Precision Group released second-quarter 2022 financial results. Read more below.
Advanced Emissions Solutions Inc. (ADES) was the worst-performing stock in the portfolio for August, down 23.5%. During the month, Advanced Emissions Solutions released second-quarter 2022 financial results and a merger agreement. Read more about both news items below.
Rocky Brands Inc. (RCKY) was the second-worst-performing stock in the portfolio for the month, down 20.5%. During the month, Rocky Brands released second-quarter 2022 financial results. Read more below.
Here are some news highlights from August for the holdings in the Model Shadow Stock Portfolio:
Advanced Emissions Solutions Inc. (ADES) reported a loss per diluted share of $0.02 for the second quarter of 2022, down from earnings of $0.90 per diluted share in the same period of 2021. Total revenue increased 42.1% for the second quarter to $24.7 million from $17.4 million a year ago.
The year-over-year earnings comparison is notably influenced by the company’s previously announced decision to wind down operations of its former refined coal segment, composed of Tinuum Group and Tinuum Services. Advanced Emissions Solutions’ margins are generally under pressure due to tight inventory conditions and an expected full-year impact of incremental carbon purchases to supplement inventory. In the background, supply chain and inflationary challenges are applying upward pressure on costs related to transportation, freight and other necessary product inputs. Favorable macroeconomic dynamics continue to support strong demand for Advanced Emissions Solutions’ activated carbon products. While the company continues to face margin headwinds, it is becoming more comfortable with its production volume growth and its ability to service record-high customer demand.
The company also announced a definitive agreement on its merger with Arq Ltd. The agreement states that the companies will combine their businesses. Advanced Emissions Solutions shareholders may elect to receive up to an aggregate of $10.0 million of cash proceeds in the merger (at a price of $0.52 per share) and will retain at least 47.4% of the outstanding shares of the combined company. The ownership could increase up to 49.5% based upon 100% equity elections by Advanced Emissions Solutions investors. Concurrent with the merger, there will be a committed equity placement of $20.0 million from current Arq investors and members of Arq management.
Ampco-Pittsburgh Corp. (AP) reported second-quarter 2022 diluted earnings per share of $0.02, a decrease from the $0.05 per diluted share in the comparable quarter of 2021. Net sales for the quarter totaled $102.6 million, up 11% from $92.4 million in second-quarter 2021.
Big 5 Sporting Goods Corp. (BGFV) reported second-quarter 2022 diluted earnings per share of $0.41, a decrease from the $1.63 per diluted share in the comparable quarter of 2021. Diluted earnings missed the I/B/E/S consensus estimate of $0.46 per share by 12%. Net sales for the quarter totaled $253.8 million, down 22% from $326 million in second-quarter 2021. Operating income totaled $76.6 million, down from $78.3 million in second-quarter 2021. Net income for the quarter was $3.17 million, a decrease from $11.56 million in the comparable quarter of 2021.
Container Store Group Inc. (TCS) reported first-quarter 2022 diluted earnings per share of $0.21, a decrease from $0.35 per diluted share in the comparable quarter of 2021. However, it beat the I/B/E/S consensus estimate of $0.168 per diluted share by 25%. Net sales for the quarter totaled $263 million, up 7% from $245.3 million in first-quarter 2021. Operating income totaled $17.9 million, down from $26.5 million in the same quarter a year ago. Net income for the quarter was $10.5 million, a decrease from $17.7 million in the comparable quarter of 2021.
The company maintained its outlook for full-year 2023 sales of $1.125 billion and slightly decreased the range of predicted diluted earnings from $1.20 to $1.30 per share to $1.14 to $1.24 per share.
Delta Apparel Inc. (DLA) reported third-quarter 2022 diluted earnings per share of $0.88, a decrease from $1.14 per diluted share in the 2021 comparable quarter. It also missed the I/B/E/S consensus estimate of $1.19 per diluted share by 26.1%. Net sales for the quarter totaled $126.9 million, up 7% from $118.7 million in the 2021 third quarter. Operating income totaled $9.3 million, down from $11.9 million in third-quarter 2021. Net income for the quarter was $6.2 million, a decrease from $8.1 million in the comparable quarter of 2021.
Dixie Group Inc. (DXYN) reported a second-quarter 2022 loss of $0.29 per share, which decreased year over year from $0.21 per share. Gross profit decreased to $16.1 million from $22.6 million in the second quarter of 2022. Gross margin decreased from 25.1% a year ago to 19.2% due to inflationary and supply chain pressures. In addition, Dixie Group announced board authorization to repurchase up to $3 million of the company’s stock.
Ducommun Incorporated (DCO) reported second-quarter 2022 earnings per share of $0.34, which decreased year over year from $0.69 per share. Adjusted earnings per share of $0.76 missed the I/B/E/S consensus estimate of $0.825 per share by 7.9%. Net sales of $174.2 million increased by 8.7% over the same period. Gross profit decreased to $34.6 million from $36.8 million in the second quarter of 2022. Gross profit margin decreased to 19.9% from 23.0% in the prior-year quarter due to unfavorable product mix, partially offset by favorable manufacturing volume and lower compensation and benefits costs.
Ennis Inc. (EBF) announced its acquisition of certain assets of Gulf Business Forms Inc., including customer lists and intellectual property. Based in San Marcos, Texas, Gulf Business Forms is a trade printer specializing in custom-printed documents including business forms, laser cut sheets, brochures, pamphlets, in-line glue booklets and variable short-run solutions.
Global Ship Lease Inc. (GSL) reported second-quarter 2022 earnings per share of $1.85, up year over year from $0.65 per share. Earnings beat the I/B/E/S consensus estimate of $1.784 per share by 3.7%. Net sales of $154.5 million increased by 86.4% over the same period. Gross profit increased to $108.0 million from $52.7 million in the second quarter of 2021. Adjusted earnings before interest, taxes, depreciation and amortization (EBITDA) were $95.2 million, almost doubled from a year ago.
Global Ship Lease declared a quarterly dividend of $0.375 per share, in line with its previous payment. The dividend was paid on September 2.
The company also announced that it entered into new multi-year charters with Hapag-Lloyd for six ECO 6900 TEU ships. The new charters are each for a firm period of five years, followed by two 12-month periods at the option of the charterer, and are scheduled to commence between late 2023 and late 2024, following the expiration of existing charters to a different counterparty. The charters are expected to generate average adjusted EBITDA of approximately $13.1 million per ship, per year, and total adjusted EBITDA of around $393 million for the six ships over the firm charter period.
Key Tronic Corp. (KTCC) reported fourth-quarter 2022 earnings per share of $0.09, up year over year from $0.02 per share. Net sales of $126.2 million decreased by 4.8% over the same period. For the fourth quarter, the company’s gross margin was 9.3% and operating margin was 1.8%, compared to a gross margin of 7.8% and an operating margin of 1.1% in the same period of fiscal-year 2021. The increased margins primarily reflect an increase in sales pricing to recoup higher materials and labor costs incurred by the company throughout the fiscal year.
For the first quarter of fiscal-year 2023, Key Tronic expects to report revenue in the range of $125 million to $135 million, and earnings in the range of $0.05 to $0.10 per diluted share.
Kimball Electronics Inc. (KE) reported fourth-quarter 2022 earnings per share of $0.40, down year over year from $0.57 per share. Earnings missed the I/B/E/S consensus estimate of $0.567 per share by 29.5%. Net sales of $373.5 million increased by 13.5% over the same period. Gross profit increased to $34.2 million from $31.8 million in the fourth quarter of 2021. Despite this, gross margin decreased from 9.7% to 9.2%.
For fiscal-year 2023, Kimball Electronics expects net sales to be in the range of $1.6 billion to $1.7 billion, a 19% to 26% increase year over year.
Pangaea Logistics Solutions Ltd. (PANL) reported second-quarter 2022 earnings per share of $0.56, which increased year over year from $0.43 per share. Earnings beat the I/B/E/S consensus estimate of $0.418 per share by 34.0%. Net sales of $173.2 million increased by 47.5% over the same period. Gross profit increased to $41.7 million from $22.2 million in the second quarter of 2021. Total shipping days, which include both voyage and time charter days, remained essentially flat at 4,703 in the second quarter, versus 4,723 days in the prior-year period, including a 16% increase in voyage days.
Pangaea Logistics also announced that it purchased a vessel to add to its operating fleet. The ship was purchased on the secondhand market for $17.1 million. Pangaea will own 25 ships when the new ship is delivered in September or October 2022. The company consistently operates a total fleet of 50 to 60 vessels in worldwide trades.
Perion Network Ltd. (PERI) reported second-quarter 2022 earnings per share of $0.41, which increased year over year from $0.19 per share. Earnings beat the I/B/E/S consensus estimate of $0.317 per share by 29.3%. Net sales of $146.7 million increased by 33.7% over the prior-year period. Gross profit increased to $139.8 million from $103.5 million in the second quarter of 2022. Net cash provided by operating activities in the second quarter of 2022 was $25.7 million, compared to $14.6 million in the second quarter of 2021. Video revenue grew by 273% year over year, representing 44% of display advertising revenue. Connected TV revenue grew by 90% year over year, representing 6% of display advertising revenue.
Rocky Brands Inc. (RCKY) reported second-quarter 2022 adjusted earnings per share of $0.34, which missed the I/B/E/S consensus estimate by $0.46 per share and was lower than the adjusted earnings per share of $0.99 reported for the same period one year ago. The company reported revenue of $162 million, which is up 23.1% from the same period a year prior. Wholesale sales for the second quarter increased 29.7% to $131.2 million compared to $101.1 million for the same period in 2021.
Rocky Brands declared a dividend of $0.155, which is in line with its previous dividend. The dividend is payable on September 15, to shareholders of record as of September 1.
SigmaTron International Inc. (SGMA) reported that president James Barnes has resigned to pursue another opportunity, effective August 12. The company will begin a search for his replacement immediately.
Strattec Security Corp. (STRT) reported fourth-quarter 2022 earnings per share of $0.10, which missed the I/B/E/S consensus estimate by $0.71 per share. Diluted earnings per share compared to $0.75 per share in the prior-year quarter. The company reported revenue of $123.1 million, which is up 11.8% from $110.1 million the same period a year prior. Gross profit margins were 11.3% in the fourth quarter compared to 13.9% in the same period a year prior. The year-over-year decrease in gross profit margin was primarily attributed to higher costs for production materials.
Titan Machinery Inc. (TITN) reported second-quarter 2023 adjusted earnings per share of $1.10, which beat the I/B/E/S consensus estimate by $0.40 per share. Year over year, adjusted earnings grew from $0.56 per share. This is the company’s highest quarterly earnings performance yet. The company reported second-quarter revenue of $496.5 million, which is up 31.5% from $377.6 million in the same period a year prior. Gross profit for the second quarter of fiscal 2023 was $102.7 million, compared to $75.0 million in the second quarter last year. Titan Machinery’s gross profit margin increased to 20.7% in the second quarter, compared to 19.9% in the prior-year quarter.
Vishay Precision Group Inc. (VPG) reported second-quarter 2022 adjusted diluted earnings per share of $0.68, which beat the I/B/E/S consensus estimate by $0.13 per share. Adjusted diluted earnings grew year over year from $0.49 per share. The company reported revenue of $88.6 million, up 17.6% from the same period a year prior. Gross profit margin was 42.1%, compared to 39.6% in the prior-year period. Cash from operating activities was $9.0 million with adjusted free cash flow of $4.9 million.
 Get updates about the portfolio that has outperformed the market by 211.9%
since inception!
Get updates about the portfolio that has outperformed the market by 211.9%
since inception!