


John Bajkowski
is the president of AAII.
The Model Shadow Stock Portfolio bounced back strongly in July as investors took profits in mega-cap technology-related stocks and bid up the prices of smaller, value-oriented stocks. The Model Shadow Stock Portfolio was up 7.4% during July, compared to a 1.2% gain for the S&P 500 index, a 5.8% gain for the S&P MidCap 400 index and a 10.8% gain for the S&P SmallCap 600 index. Mistras Group Inc.  (MG) was the best-performing holding, up 20.6% during July, after reporting better-than-expected earnings. SigmaTron International Inc. (SGMA) was the weakest holding during July, down 40.1%. We are still awaiting SigmaTron International’s earnings release.
Market breadth turned positive during the month. The number of advancing issues outnumbered the number of declining issues across all S&P indexes. Within the S&P 500, advancing issues outpaced declining issues 362 to 138 for a ratio of 2.62, up from 0.66 last month when the number of declining issues was greater than the number of advancing issues. Market breadth grew stronger as market capitalization was smaller. The ratio was 3.99 for the S&P MidCap 400 (up from 0.55 last month) and 6.12 for the S&P SmallCap 600 (up from 0.55 last month). Within the Model Shadow Stock Portfolio, the breadth also improved: 22 holdings were up for the month, while eight were down, for a ratio of 2.75, up from 0.50 last month.
In the large-cap segment, value stocks were up 4.8% for the month, while growth stocks were down 1.3%. Over the last year, large-cap value stocks are up 16.8%, compared to a return of 26.9% for large-cap growth stocks.
During July, mid-cap value stocks gained 7.6% and mid-cap growth stocks were up 4.2%. Mid-cap value stocks are up 11.4% over the last year, while mid-cap growth stocks are up 19.3%.
Small-cap value stocks gained 11.7% during July and small-cap growth stocks gained 9.9%. Small-cap value stocks are up 9.8% over the last year, while small-cap growth stocks are up 18.3%.
The Model Shadow Stock Portfolio gained 7.4% for the month and is up 3.5% over the last year. The Vanguard Small Cap Index fund (NAESX) gained 6.8% during July and is up 13.3% over the last year.
The S&P 500 is up 16.7% year to date as of July 31. The Model Shadow Stock Portfolio is up 5.9% year to date compared to a 12.3% gain for the S&P MidCap 400 and a 10.0% gain for the S&P SmallCap 600.
Since its inception in 1993, the AAII Model Shadow Stock Portfolio has a compound annual average return of 13.7%, versus the Vanguard 500 Index fund’s (VFINX) gain of 10.4% per year on average over the same period. Over the same period, the Vanguard Small Cap Index fund posted an average annual gain of 9.9%.
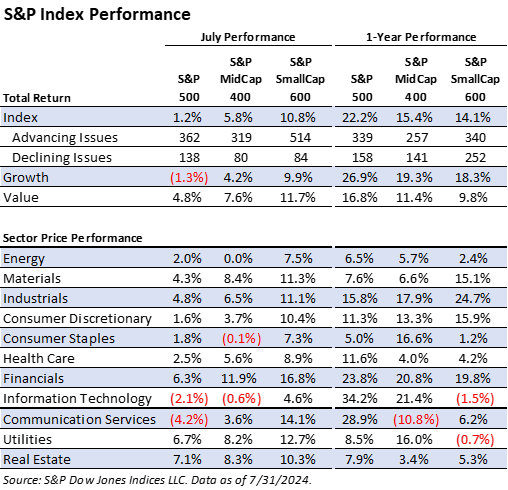
Nine sectors in the S&P 500 were up for the month. Real estate was the best performer, up 7.1%, while the weakest sector was communications services, down 4.2% for the month. In the mid-cap segment, there were also nine sectors up for the month. Financials (+11.9%), materials (+8.4%) and real estate (+8.3%) were the strongest sectors. Information technology (–0.6%), consumer staples (–0.1%) and energy (0.0%) were the weakest sectors in the mid-cap segment. All 11 sectors were up in the S&P SmallCap 600 during the month. Financials (+16.8%), communications services (+14.1%) and utilities (+12.7%) were the strongest sectors. Information technology (+4.6%), consumer staples (+7.3%) and energy (+7.5%) were the weakest sectors in the small-cap segment.
Looking at the last year, information technology (+34.2%) and communication services (+28.9%) continue to be the top performers in the S&P 500; information technology (+21.4%) and financials (+20.8%) had the best performance in the S&P MidCap 400; and industrials (+24.7%) and financials (+19.8%) and had the best performance in the S&P SmallCap 600. The weakest-performing sectors among large-company stocks were consumer staples (+5.0%), energy (+6.5%) and materials (+7.6%). Communication services (–10.8%) and real estate (+3.4%) were the weakest sectors in the S&P MidCap 400, while information technology (–1.5%) and utilities (–0.7%) were the weakest S&P SmallCap 600 sectors over the last year.
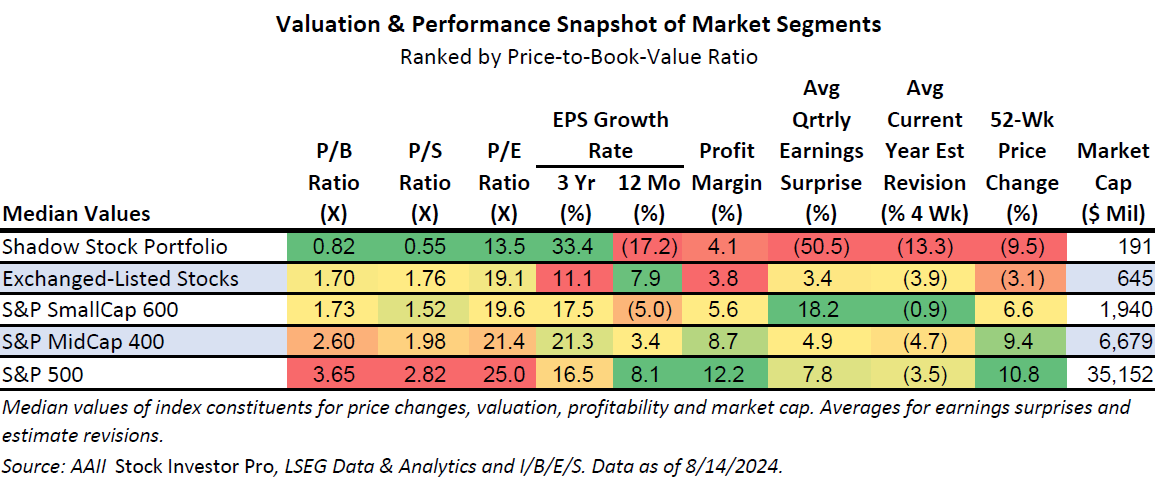
Small-cap stocks remain attractively priced relative to large-cap stocks. The median price-to-book-value (P/B) ratio of the companies in the S&P SmallCap 600 is 1.73, well below the 3.65 median price-to-book ratio for the companies in the S&P 500. The S&P SmallCap 600 normally trades at a discounted multiple relative to the S&P 500. The discount has averaged 0.66 since 1998 and is currently 0.47. The stocks in the Model Shadow Stock Portfolio are even cheaper, with a median price-to-book ratio of 0.82.
As seen in the table below, the relative valuation levels across market segments hold true for other market multiples as well. What is interesting is that the trailing 12-month earnings growth of the stocks in the S&P 500 is stronger than for smaller companies. Profitability is also better among larger companies. Positive earnings surprises are strongest among the S&P SmallCap 600 constituents, who are also seeing the smallest downward revisions in current-year earnings estimates over the last month.
Seventeen stocks met the initial selection criteria for the Model Shadow Stock Portfolio as of August 13, up from 16 passing stocks last month. AAII members can see and research which companies are currently passing the initial selection criteria in the Shadow Stock Ideas table on AAII.com. The list of new Shadow Stock Ideas is updated daily—Tuesday through Saturday.
Of the 17 qualifying companies, six are currently held in the Model Shadow Stock Portfolio: Amplify Energy Corp. (AMPY), Castor Maritime Inc. (CTRM), DMC Global Inc. (BOOM), Fonar Corp. (FONR), Pangaea Logistics Solutions Ltd. (PANL) and StealthGas Inc. (GASS).
Qualifying companies are those held in the Model Shadow Stock Portfolio that currently meet the initial addition rules. They are designated as “currently qualifies” in the notes column of the Model Shadow Stock Portfolio table on AAII.com. However, if you go online, the notes may not match the list discussed here since the notes on the website table are dynamically updated daily.
American Vanguard Corp. (AVD) stopped passing the qualifying list when it reported a quarterly earnings loss of $0.42 per share on August 8, 2024. The results were weak enough to place the stock on earnings probation.
Friedman Industries Inc. (FRD) reported quarterly earnings, but it has not yet filed its financial statements with the U.S. Securities and Exchange Commission (SEC). As a consequence, we do not have complete financials for the company, and it came off the qualifying list due to a technicality.
SigmaTron International stopped passing the qualifying list when its market cap fell below $30 million.
The Model Shadow Stock Portfolio looks for stocks with a market cap (share price times shares outstanding) less than $300 million. Shadow stocks with a market cap three times the initial market cap maximum—$900 million ($300 million × 3)—at the time of a quarterly review are removed from the model portfolio, assuming there is a suitable replacement. As of August 13, 2024, Ducommun Inc. (DCO) had the highest market cap of $904.8 million.
As of August 13, 2024, Mistras Group had the highest price-to-book ratio in the Model Shadow Stock Portfolio. Its ratio of 1.73 is above the 0.90 maximum value used for initially qualifying a stock for inclusion in the portfolio. However, stocks are not removed from the portfolio until their price-to-book ratio rises to three times the initial maximum value, 2.70 (0.90 × 3). Covenant Logistics Group Inc. (CVLG) also had an elevated price-to-book ratio of 1.61.
See the current addition and deletion rules for the portfolio.
The next quarterly review of the AAII Model Shadow Stock Portfolio will take place around the beginning of September 2024, after most of the holdings have announced their quarterly earnings.
If there are any changes to the model portfolio, they will be announced at the time with a special Model Shadow Stock Portfolio Update email. Sign up for this email so you don’t miss it!
American Vanguard Corporation (AVD)
(08/08/2024)
American Vanguard reported a second-quarter 2024 earnings loss of $0.42 per share, a $0.38 per share decrease from a loss of $0.04 per share in the prior-year quarter. This missed the LSEG I/B/E/S consensus estimate for a loss of $0.05 per share by 833.3%. Revenue decreased 3.5% year over year from $132.8 million to $128.2 million.
(07/15/2024)
Chairman and CEO Eric G. Wintemute concluded his position as CEO, effective July 12, 2024. Going forward, Wintemute will continue to serve as chairman of the board and provide part-time consulting services. Lead director Scott Baskin stated that in light of recent performance, the company will establish an office of CEO to improve financial performance. The office of CEO will be operated by senior leadership and a board member.
(08/07/2024)
Amplify Energy reported earnings of $0.17 per share, a 29.1% decrease from $0.24 per share in the prior-year quarter. This missed the LSEG I/B/E/S consensus estimate of $0.28 per share by 39.9%. Total revenues were $79.5 million, a 10.4% year-over-year increase from $72.0 million. Net income decreased 27.6% from $9.8 million to $7.1 million year over year. Free cash flow increased 50.8% from $6.1 million to $9.2 million.
(08/08/2024)
Castor Maritime reported earnings of $1.02 per share for the second quarter of 2024, an increase of 18.6% from $0.86 per share in the same period in 2023. Castor Maritime does not have earnings coverage by LSEG I/B/E/S. Total vessel revenues decreased 35.6% year over year from $25.3 million to $16.3 million . However, net income of $22.9 million was up 179.3% year over year from $8.2 million.
(08/01/2024)
Clarus reported a second-quarter 2024 earnings loss of $0.14 per share, which includes impact from discontinued operations, compared to a loss of $0.06 per share in the second quarter of 2023. This missed the LSEG I/B/E/S consensus estimate for a loss of $0.05 per share. Sales were $56.5 million compared to $57.9 million in the year-ago quarter. This decrease was primarily driven by softness in the European wholesale and North American direct-to-consumer markets in the outdoor segment, partially offset by a year-over-year increase in adventure segment sales.
From December 31, 2023, to the end of second-quarter 2024, Clarus increased cash and cash equivalents to $46.2 million from $11.3 million and erased debt of $119.8 million.
The company continues to expect fiscal-year 2024 sales to range between $270 million and $280 million, unchanged from the previous quarter.
Core Molding Technologies, Inc. (CMT)
(08/06/2024)
Core Molding Technologies announced second-quarter 2024 earnings of $0.73 per share, a 19.8% decrease year over year from $0.91 per share. This beat the LSEG I/B/E/S consensus estimate of $0.42 per share by 73.8%. Core Molding had a total net sales decrease of 9.2% from the second quarter of 2023. Net income decreased 19.1% to $6.4 million from $7.9 million the same period last year. Free cash flow came in at $16.1 million, a 12.1% increase year over year from $14.4 million regardless of an increase in plant, property and equipment purchases ($4.8 million compared to $4.5 million).
Covenant Logistics Group, Inc. (CVLG)
(07/24/2024)
Covenant Logistics Group reported second-quarter 2024 non-GAAP adjusted earnings per diluted share of $1.04. This beat the LSEG I/B/E/S consensus estimate of $0.98 per share by 6.3%. Total revenue increased $13.48 million year over year from $274.02 million to $287.50 million, driven by a 5.3% increase in freight revenue. Adjusted operating income grew 15.0% but net income dropped $99 million year over year to $12.19 million.
(08/01/2024)
DMC Global announced second-quarter 2024 adjusted diluted earnings per share of $0.29, a 60.0% year-over-year decrease from $0.72 per share. However, this beat the LSEG I/B/E/S consensus estimate of $0.14 per share by 107.1%. Net sales were $171.2 million, up 3% from the previous quarter but down 9% year over year. Net income reached $6.3 million, down 64% year over year.
(08/08/2024)
Ducommon reported second-quarter 2024 earnings of $0.52 per share, a 205.9% increase from $0.17 per share in the second quarter of 2023. Ducommon does not have earnings coverage by LSEG I/B/E/S. Net revenue for the quarter was $197.0 million compared to $187.3 million for the second quarter of 2023. The year-over-year increase of 5.2% was primarily due to higher revenue in the company’s commercial aerospace, military and space markets. Net income increased 225% year over year from $2.4 million to $7.7 million through higher revenues and decreased costs of sales.
(07/25/2024)
Escalade reported second-quarter 2024 diluted earnings per share of $0.20, a 23% year-over-year decrease. No LSEG I/B/E/S consensus estimate was provided for Escalade’s earnings. Net sales decreased 7.7% to $62.52 million from $67.77 million in the prior-year quarter. Net income decreased 21.9% to $2.84 million from $3.64 million in the prior-year quarter.
Friedman Industries, Incorporated (FRD)
(08/08/2024)
Friedman Industries announced second-quarter 2024 earnings of $0.37 per share, a decrease of 64.4% year over year from $1.04 per share. Friedman Industries does not have earnings coverage by LSEG I/B/E/S. Net sales were $114.6 million, a 16.6% decrease year over year from $137.3 million. Net earnings for the quarter were $2.6 million, a 66.6% year-over-year decrease from $7.7 million.
(08/13/2024)
Key Tronic reported adjusted net income of $1.1 million, or $0.10 per share, for its fourth fiscal quarter of 2024, which ended on June 29. In the prior-year quarter, adjusted net income was $1.0 million, or $0.09 per share. Key Tronic does not have earnings coverage by LSEG I/B/E/S.
Kimball Electronics, Inc. (KE)
(08/13/2024)
Kimball Electronics reported earnings of $0.33 per share for its fourth fiscal quarter of 2024 ended in June, falling short of the LSEG I/B/E/S consensus estimate of $0.44 per share by 24.7%. Net sales were $430 million, a 13.3% decrease from the prior-year quarter with net sales of $496 million.
Lakeland Industries, Inc. (LAKE)
(08/01/2024)
Lakeland Industries announced the appointment of Laurel Yartz to the position of chief human resources officer on August 1, 2024. Yartz brings over 30 years of experience in the field to the position, primarily with Fortune 500 and private equity companies.
(07/31/2024)
Mistras Group reported a 7.8% year-over-year increase in revenue for second-quarter 2024, from $184.4 million to $189.8 million. Net income was $6.4 million. Adjusted diluted earnings per share totaled $0.21, beating the LSEG I/B/E/S consensus estimate of $0.135 per share by 55.6%. Mistras Group’s strong earnings growth can be attributed to growth in its two largest markets: the aerospace and defense market, which experienced a 17.5% increase in revenue, and the oil and gas market, which saw 3% revenue growth.
(07/31/2024)
NACCO Industries reported a 43.1% year-over-year decrease in earnings for second-quarter 2024, from $26.34 million to $15.00 million. Adjusted diluted earnings per share were $0.81, up 138% year over year from $0.34 per share. Net income was $6 million, a 250% increase year over year from $2.5 million.
Although NACCO Industries reported lower earnings this quarter when compared to the prior-year period, net income still increased. This was primarily due to revenue decreasing from fewer tons delivered at Mississippi Lignite Mining Co.
Natural Gas Services Group, Inc. (NGS)
(08/14/2024)
Natural Gas Services reported second-quarter 2024 earnings per share of $0.34, beating the LSEG I/B/E/S consensus estimate of $0.29 per share by 17.2%. Rental revenue was $34.9 million, an increase of 45% year over year.
Nortech Systems Incorporated (NSYS)
(08/08/2024)
Nortech Systems reported second-quarter 2024 earnings of $0.06 per share. Nortech Systems does not have earnings coverage by LSEG I/B/E/S. Net sales for the quarter were $33.9 million, down around 3% from the prior-year period’s net sales of $35 million. Net income was $157,000 for the quarter, down 75% year over year from $634,000.
Pangaea Logistics Solutions Ltd. (PANL)
(08/08/2024)
Pangaea Logistics reported second-quarter 2024 earnings of $0.08 per share, missing the LSEG I/B/E/S consensus estimate of $0.15 per share by 46.7%. Pangaea Logistics reported non-GAAP adjusted net income of $4.6 million, with revenue reaching $131.5 million.
Park-Ohio Holdings Corp. (PKOH)
(08/07/2024)
Park Ohio Holdings reported second-quarter 2024 earnings of $1.02 per share, beating the LSEG I/B/E/S consensus estimate of $0.94 per share by 8.5%. Net sales of $433 million compared to $428 million in the prior-year quarter. Park Ohio Holdings improved on margins as well, with gross margin increasing 0.5% to 16.9%, and operating income margin improving by 1.2% to 5.7% year over year.
(07/30/2024)
Rocky Brands reported a 1.6% year-over-year decrease in total sales for second-quarter 2024, to $98.3 million. Adjusted diluted earnings were $0.17 per share, surpassing the LSEG I/B/E/S consensus estimate for a loss of $0.095 per share by 78.9%. Rocky Brands reported a total debt decrease of 31.3% year over year.
Chairman, president and CEO Jason Brooks commented, “We continue to effectively navigate an unpredictable consumer environment thanks to our diversified brand portfolio and recently deployed cost saving initiatives. Strong double-digit gains in sales for our Durango and Xtratuf brands in both our wholesale and e-commerce channels helped offset softness in other areas of our business and generated low-single-digit year-over-year recurring sales growth … We are encouraged with our recent results and look forward to delivering further growth over the near- and long-term.”
(08/14/2024)
Titan Machinery has yet to complete preparation of its interim financial statements for its first fiscal quarter of 2025, which ended in April. The company will provide full financial results when it reports on its second fiscal quarter ended in July, which is scheduled to be released on Thursday, August 29, 2024.
Vishay Precision Group, Inc. (VPG)
(08/06/2024)
Vishay Precision Group reported second-quarter 2024 earnings of $0.31 per share, falling short of the LSEG I/B/E/S consensus estimate of $0.34 per share by 7.5%. Revenues were reported at $77.4 million, decreasing 14.8% from the prior-year period. Net income was $4.6 million.
 Get updates about the portfolio that has outperformed the market by 211.9%
since inception!
Get updates about the portfolio that has outperformed the market by 211.9%
since inception!