


John Bajkowski
is the president of AAII.
The S&P 500 index lost 5.6% during March, compared to a 6.1% loss for the Model Shadow Stock Portfolio. The S&P MidCap 400 index lost 5.5% during the month, while the S&P SmallCap 600 index declined 6.1%.
Smaller companies continue to lag larger companies for the year. The S&P SmallCap 600 is down 3.4% over the last year, compared to a 2.7% loss for the S&P MidCap 400 and an 8.3% gain for the S&P 500. The Model Shadow Stock Portfolio is down 10.8% over the last year.
Value stocks held up better than growth stocks during the month, except in the small-cap segment. In the large-cap segment, growth stocks were down 8.2% for the month, while value was down 3.0%. Large-cap growth stocks are up 10.5% over the last year, compared to a return of 4.2% for large-cap value stocks.
Mid-cap growth stocks lost 6.5% during March, while mid-cap value stocks lost 4.5%. Mid-cap growth stocks are down 8.1% over the last year, compared to a 3.3% gain for mid-cap value stocks.
Small-cap growth stocks lost 5.9% during March and are down 3.7% for the year, while small-cap value stocks declined 6.4% during the month and are down 3.2% over the last year.
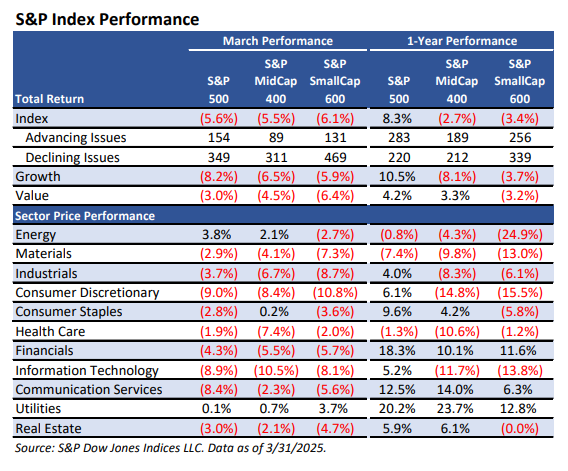
Market breadth weakened during the month. Within the S&P 500, there were 154 advancing issues, compared to 349 declining issues—a ratio of 0.44, down from 0.97 during February. The ratio was 0.29 for the S&P MidCap 400, down from 0.53 during February. In the S&P SmallCap 600, the ratio was slightly weaker at 0.28, down from 0.43 during February.
Only two of the 11 sectors in the S&P 500 were up during March. Energy was up 3.8% and utilities had a 0.1% gain during the month. Continued concerns over consumer sentiment drove the consumer discretionary sector down 9.0% for the month. The pullback in technology translated into an 8.9% decline for the information technology sector and an 8.4% decline in the communication services sector.
Utilities and financials are the strongest S&P 500 sectors over the last year, up 20.2% and 18.3% respectively. Materials is the weakest S&P 500 sector, down 7.4% over the last year.
For March, only three of the 11 sectors within the S&P MidCap 400 were up for the month. Energy was the strongest sector, up 2.1% during the month but down 4.3% for the year, while information technology was the weakest sector, down 10.5% during the month and 11.7% over the last year.
Only the utilities sector was up in the S&P SmallCap 600 during March. The sector was up 3.7% for the month and 12.8% for the year. Consumer discretionary was the weakest sector, down 10.8% during the month and 15.5% over the last year.
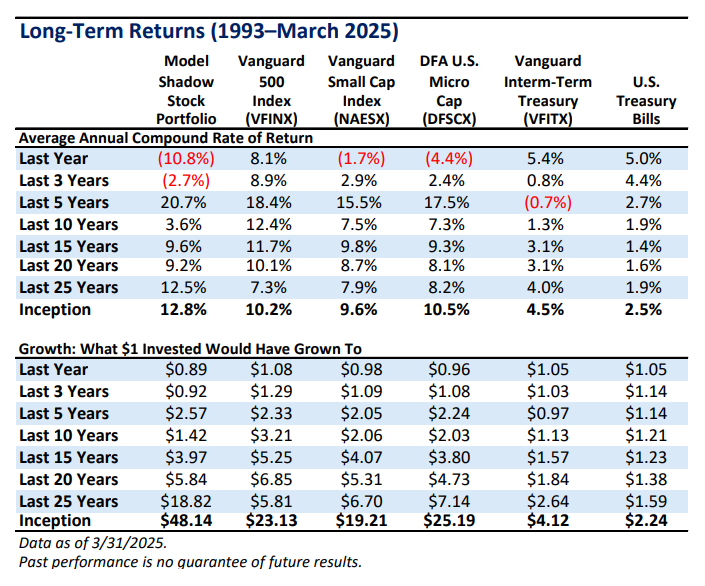
During times of market turmoil, it can be challenging to keep your emotions in check. As we have often noted, less-liquid micro-cap stocks typically go down more deeply during corrections, only to bounce back more strongly in the subsequent market upturn.
Generally, riskier and less-liquid assets are the stronger-performing groups during a recovery. During the Great Recession, the Model Shadow Stock Portfolio lost more than the large-cap S&P 500 (down 63.4% versus 51.0%) but recovered to its previous high more quickly (3.4 years versus 4.8 years). It is important to note that past patterns do not always repeat, but it is helpful to study historical patterns. The current Model Shadow Stock Portfolio underperformance has lasted longer than previous periods of underperformance.
The performance of small-cap stocks relative to large-cap stocks often runs in streaks. Small-company stocks have outperformed large-company stocks over the long term, but, as we have seen, they do not outperform large-cap stocks every year and they tend to exhibit flashes of outperformance followed by periods of underperformance. A historical pattern may not repeat itself in the future, but longer holding periods normally provide a greater likelihood that stocks exhibit their potential for positive returns.
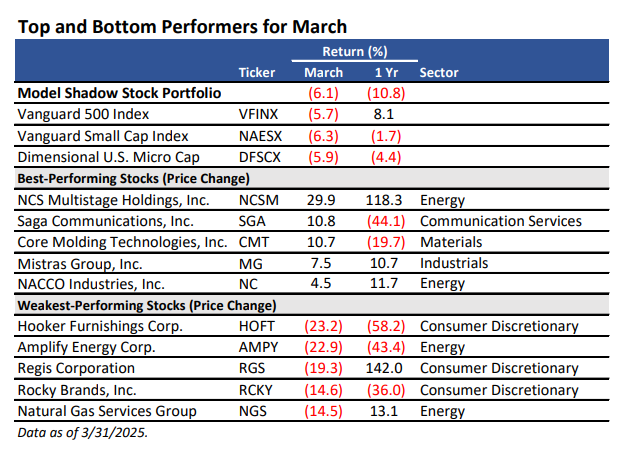
NCS Multistage Holdings Inc. (NCSM), a provider of energy solutions that help to optimize oil well completions and oil field strategies, was the best-performing stock during March with a gain of 29.9%.
Hooker Furnishings Corp.  (HOFT) was the weakest holding during March, down 23.2%. The firm designs, manufactures, imports and markets residential household, hospitality and contract furniture. Concerns over weak consumer sentiment have hurt consumer discretionary stocks due to fears that consumers will curtail spending while production costs may rise with new tariffs. In March, Hooker Furnishings announced that it was closing its Savannah, Georgia, distribution facility; they will provide further details during its earnings conference call on April 17.
Additional news for the model portfolio holdings is presented at the end of the email.
As of April 11, 38 stocks met the initial selection criteria for the Model Shadow Stock Portfolio, compared to 32 stocks one month ago. AAII members can see and research which companies are currently passing the initial selection criteria in the Shadow Stock Ideas table on AAII.com. The list of new Shadow Stock Ideas is updated daily—Tuesday through Saturday.
Of the 38 qualifying companies, 13 are currently held in the Model Shadow Stock Portfolio: Alpha Pro Tech Ltd. (APT), Fonar Corp. (FONR), Kimball Electronics Inc. (KE), NACCO Industries Inc. (NC), Natural Gas Services Group Inc. (NGS), NCS Multistage, Pangaea Logistics Solutions Ltd. (PANL), Park Ohio Holdings Corp. (PKOH), Regis Corp. (RGS), Rocky Brands Inc. (RCKY), Saga Communications Inc. (SGA), StealthGas Inc. (GASS) and Vishay Precision Group Inc. (VPG).
Qualifying companies are those held in the Model Shadow Stock Portfolio that currently meet the initial portfolio addition rules. (They are designated as “currently qualifies” in the Notes column of the Model Shadow Stock Portfolio table on AAII.com. However, if you go online, the notes may not match the list discussed here since the notes on the website table are dynamically updated daily.)
No current holdings came off the qualifying list over the last month, but more companies are passing the Shadow Stock screen as declining stock prices are lowering both the price-to-book value and market capitalization of companies.
As of April 11, 2025, Mistras Group Inc. (MG) had the highest price-to-book-value (P/B) ratio in the Model Shadow Stock Portfolio. Its ratio of 1.45 is above the 0.90 maximum value used for initially qualifying a stock for inclusion in the portfolio. However, stocks are not removed from the portfolio until their price-to-book ratio rises to three times the initial maximum value (2.70).
Covenant Logistics Group Inc. (CVLG) had the highest market cap in the portfolio, with a value of $508.7 million as of April 11, 2025. The Model Shadow Stock Portfolio looks for stocks with a market cap (share price times shares outstanding) greater than $30 million but less than $400 million when adding stocks to the portfolio. Shadow stocks with a market cap three times the initial market-cap maximum ($400 million × 3 = $1.2 billion) at the time of a quarterly review are removed from the portfolio, assuming there is a suitable replacement.
Click here to see the current addition and deletion rules for the portfolio.
The next quarterly review of the AAII Model Shadow Stock Portfolio will take place around the beginning of June 2025, after most of the holdings have announced their quarterly earnings. If there are any changes to the model portfolio, they will be announced in the Model Shadow Stock Portfolio Update email. Sign up for this email so you don’t miss it!
American Vanguard Corporation (AVD)
(03/14/2025)
American Vanguard reported fourth-quarter 2024 net sales of $169 million, down 1.7% year over year from $172 million. Adjusted earnings before interest, taxes, depreciation and amortization (EBITDA) were $18 million, down 22.2% year over year from $22 million Debt decreased $22 million from $179 million reported as of September 30, 2024. CEO Douglas “Dak” Kaye III announced that the company achieved its full-year 2024 EBITDA target.
Lakeland Industries, Inc. (LAKE)
(04/09/2025)
Lakeland Industries reported a loss of $2.48 per share for its fiscal fourth-quarter 2025 ended January 31, down from a loss of $0.13 per share in the prior-year quarter. Earnings were 752.6% lower than the S&P Global consensus estimate of $0.38 per share. Net sales were $46.6 million, up 49.3% year over year from $31.2 million, with organic sales increasing 11.0% over the same period.
Natural Gas Services Group, Inc. (NGS)
(03/17/2025)
Natural Gas Services reported fourth-quarter 2024 diluted earnings of $0.22 per share, up 71.5% year over year from $0.13 per share. Total revenue was $40.7 million, up 12.2% from $36.2 million in the prior-year quarter. The rental segment was the only of the company’s three segments with an increase in revenue. Operating income was $6.0 million, up 36.1% from $4.4 million in the prior-year quarter.
Nortech Systems Incorporated (NSYS)
(03/31/2025)
Nortech Systems reported a loss of $0.54 per share for fourth-quarter 2024 diluted earnings, down from $1.51 per share in the prior-year quarter. Nortech Systems does not have earnings coverage by S&P Global. Net sales were $28.6 million, down 20.6% year over year from $36.1 million. The company reported an operating loss of $1.2 million, down from $2.6 million in the prior-year quarter.
(03/20/2025)
Titan Machinery reported an adjusted earnings loss of $1.98 per share for its fiscal fourth-quarter 2024 ended January 31, 2025, down 288.6% year over year from earnings of $1.05 per share. Earnings missed the S&P Global consensus estimate of a loss of $0.63 per share by 214.3%. Total revenue was $759.9 million, down 10.8% from $852.1 million in the prior-year quarter. Service revenue was the only segment to increase.
 Get updates about the portfolio that has outperformed the market by 211.9%
since inception!
Get updates about the portfolio that has outperformed the market by 211.9%
since inception!