


John Bajkowski
is the president of AAII.
Stocks generally lost ground in July, with smaller companies experiencing somewhat greater weakness. The S&P 500 index posted a total return of –0.1%, compared to declines of 2.4% for the S&P MidCap 400 index and 1.9% for the S&P SmallCap 600 index. Despite the declines, market breadth remained positive, with advancing stocks outnumbering declining stocks across all three indexes.
The month’s performance also reflected a pronounced shift toward value. S&P 500 value stocks gained 2.0%, while S&P 500 growth stocks declined 1.8%. The difference was even wider among mid-cap stocks, where value gained 0.2%, while growth fell 4.8%. Small-cap value declined 0.6% but still held up considerably better than small-cap growth, which declined 3.3%.
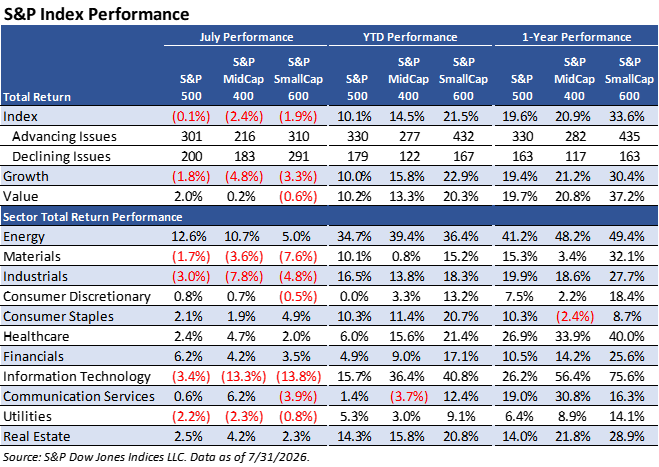
Sector performance was similarly uneven. The energy sector was the clear leader, gaining 12.6% among large caps, 10.7% among mid-caps and 5.0% among small caps. The consumer staples, healthcare, financials and real estate sectors also posted gains across all three size groups. The information technology sector was the weakest sector, declining 3.4% among large caps, 13.3% among mid-caps and 13.8% among small caps.
The longer-term picture remains much more favorable for smaller stocks. Through July, the S&P SmallCap 600 has gained 21.5% year to date and 33.6% over the past year, compared to gains of 10.1% and 19.6%, respectively, for the S&P 500. This contrast provides a timely reminder that the historical long-term return advantage of smaller companies has not appeared consistently from month to month.
The Model Shadow Stock Portfolio declined 1.8% in July, matching DFA U.S. Micro Cap fund’s (DFSCX) return and holding up somewhat better than Vanguard Small Cap Index fund (NAESX), which declined 2.6% for the month. Vanguard 500 Index fund (VFINX) declined just 0.1%.
Despite July’s weakness, the longer-term results remain much stronger for the smaller-company benchmarks. The Model Shadow Stock Portfolio gained 69.9% over the past year, compared to gains of 36.4% for DFA U.S. Micro Cap, 23.7% for Vanguard Small Cap Index and 19.4% for Vanguard 500 Index. The Model Shadow Stock Portfolio was up 36.0% year to date through the end of July.
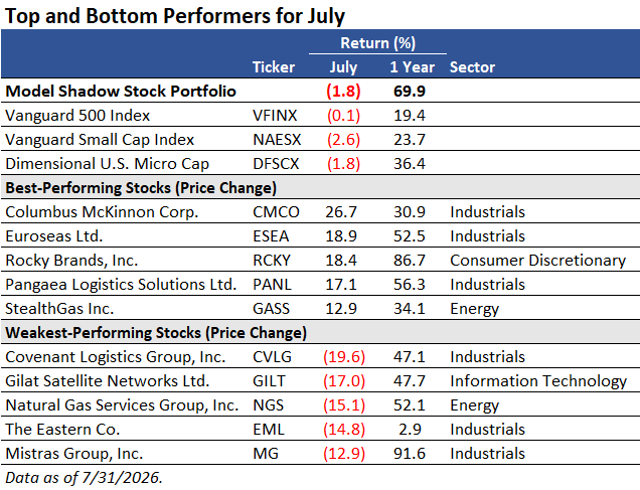
Columbus McKinnon Corp.  (CMCO) led the Model Shadow Stock Portfolio in July with a 26.7% gain. Shares rallied following the company’s earnings report for its fiscal first-quarter 2027 ended June 30, 2026, which featured record orders and sales as well as an improved fiscal-year 2027 outlook. Rocky Brands Inc. (RCKY) was another earnings-related winner, rising 18.4% as investors responded positively to its second-quarter 2026 results.
Shipping-related companies also ranked among the month’s strongest performers. Euroseas Ltd. (ESEA) gained 18.9%, Pangaea Logistics Solutions Ltd. (PANL) rose 17.1% and StealthGas Inc. (GASS) advanced 12.9%. Renewed U.S.-Iran tensions increased uncertainty surrounding shipping through the Strait of Hormuz in July, contributing to concerns about vessel availability, shipping costs and global trade routes. The gains also occurred during a strong month for energy-related stocks, with energy posting the best July performance among the major S&P sectors.
Covenant Logistics Group Inc. (CVLG) was the portfolio’s weakest performer in July, falling 19.6%. The decline coincided with the company’s second-quarter 2026 earnings release at month-end, as investors weighed revenue growth against weaker profitability and continued challenges in parts of the freight market.
Gilat Satellite Networks Ltd. (GILT) declined 17.0%, even as the company announced more than $20 million in new SkyEdge product orders during the month. Investors seem to have kept their focus on the company’s pending acquisition of Comtech Telecommunications Corp.’s (CMTL) satellite and space communications business, a sizable transaction expected to close by year-end. Natural Gas Services Group Inc. (NGS) fell 15.1% following its June acquisition of Flatrock Compression Holdings LLC.
Eastern Co. (EML) declined 14.8%, while Mistras Group Inc. (MG) fell 12.9%. Neither company reported results during the month. Given that several of July’s weakest holdings had posted strong gains over the prior year, some of the declines may reflect profit-taking and normal volatility among smaller-company stocks rather than broad deterioration in fundamentals.
As of August 7, 20 stocks met the initial selection criteria for the Model Shadow Stock Portfolio, compared to 19 stocks one month ago. AAII members can see and research which companies are currently passing the initial selection criteria in the Shadow Stock Ideas table on AAII.com. The list of new Shadow Stock Ideas is updated daily—Tuesday through Saturday.
Companies that are held in the Model Shadow Stock Portfolio and meet the initial portfolio addition rules are marked as such on the Ideas list. (They are also designated as “currently qualifies” in the Notes column of the Model Shadow Stock Portfolio table on AAII.com. However, the online notes may not match the list discussed here since the notes on the website table are dynamically updated daily.)
Of the 20 qualifying companies, six are currently held in the Model Shadow Stock Portfolio: Alpha Pro Tech Ltd. (APT), Hudson Technologies Inc. (HDSN), Kolibri Global Energy Inc. (KGEI), Regis Corp. (RGS), StealthGas and USANA Health Sciences Inc. (USNA).
NACCO Industries Inc. (NC) lost its currently qualifying designation when it reported negative quarterly earnings. Hudson Technologies gained its currently qualifying designation during the month when its price-to-book-value (P/B) ratio moved below 1.00. The Model Shadow Stock Portfolio looks for stocks with a price-to-book ratio of 1.00 or below when adding stocks to the portfolio. Shadow stocks with a price-to-book value three times the initial maximum (1.00 × 3 = 3.00) at the time of a quarterly review are removed from the portfolio, assuming there is a suitable replacement. As of August 7, Mistras Group had the highest price-to-book ratio in the portfolio with a value of 2.19, below the 3.00 maximum for removal.
USANA Health Sciences regained its currently qualifying designation during the month when its market capitalization moved below $400 million. The Model Shadow Stock Portfolio looks for stocks with a market cap (share price times shares outstanding) greater than $30 million but less than $400 million when adding stocks to the portfolio. Shadow stocks with a market cap three times the initial market-cap maximum ($400 million × 3 = $1.2 billion) at the time of a quarterly review are removed from the portfolio, assuming there is a suitable replacement. Covenant Logistics Group had the highest market cap in the portfolio with a value of $872.2 million, below the $1.2 billion maximum for removal.
Click here to see the current addition and deletion rules for the portfolio.
The next quarterly review of the AAII Model Shadow Stock Portfolio will take place around the beginning of September, after most of the holdings have announced their second-quarter 2026 earnings. If there are any changes to the model portfolio, they will be announced in the Model Shadow Stock Portfolio Update email. Sign up for this email so you don’t miss it.
AAII has a long history of illustrating how quantitative stock screens and filters can be applied to the universe of small-company stocks to identify potentially attractive candidates. The Model Shadow Stock Portfolio is one such example, applying value, profitability, sector and liquidity filters to a micro-cap stock universe. The goal is to uncover potentially mispriced opportunities among companies that tend to receive less analyst coverage and investor attention. Historical evidence suggests that small-company stocks have provided higher long-term returns, although investors have had to accept greater volatility and periods of underperformance along the way.
There are many ways to measure company size, including revenue, assets, number of employees, market cap and enterprise value. However, most studies examining stock performance by company size use market cap. Market cap is calculated by multiplying a company’s shares outstanding by its share price and represents the market’s assessment of the company’s equity value. The largest publicly traded companies have market caps measured in the trillions of dollars, while smaller companies may have market caps of $1 billion or less.
One common method for studying the relationship between company size and stock returns is to rank stocks by market cap and divide them into deciles, with each group containing 10% of the stocks. In the Kenneth French data used in our analysis, the size breakpoints are determined using domestic common stocks listed on the New York Stock Exchange (NYSE). Those NYSE breakpoints are then applied to eligible stocks listed on the NYSE, the NYSE American and the Nasdaq. The first decile contains the largest companies, while the 10th decile contains the smallest companies.
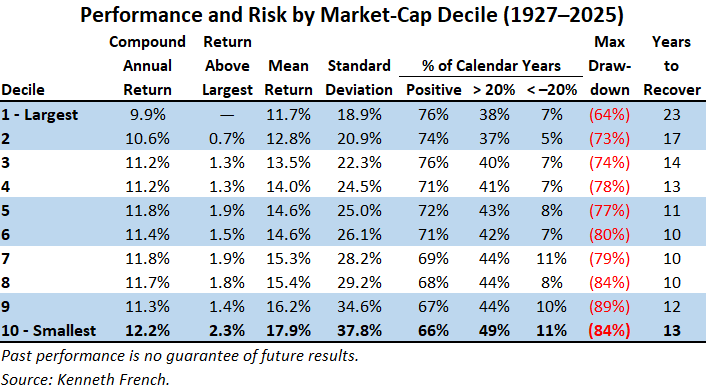
The table above provides several measures of return and risk to illustrate how the investment performance has changed as company size decreases. Compound Annual Return measures the annualized rate at which an investment would have grown over the full period, incorporating the effects of compounding and volatility. Return Above Largest shows the difference between each decile’s compound annual return and that of the largest-company decile, providing a simple measure of the historical size premium.
Mean Return is the arithmetic average return and provides another perspective on the typical return generated by each size group. Unlike the compound annual return, the mean does not account for the drag that volatility places on compounded wealth. Therefore, the difference between the mean and compound returns tends to widen as volatility increases. Standard Deviation measures the variability of returns around their average and provides an indication of the greater year-to-year uncertainty associated with smaller stocks.
The next three columns provide a more intuitive view of the distribution of annual returns. The Positive column indicates the percentage of calendar years in which the decile group generated a return greater than zero. The greater than 20% column measures the percentage of years with gains exceeding 20%, while the less than –20% column measures the percentage of years with losses exceeding 20%. Together, these measures illustrate an important characteristic of small-company investing: Smaller stocks have historically experienced more exceptionally strong years, but they’ve also experienced more severe down years.
Maximum Drawdown measures the largest cumulative decline from a previous peak to a subsequent trough over the period. This differs from the worst calendar-year return because a drawdown can begin and end at any point rather than being confined to a calendar year. Finally, Years to Recover measures how long it took the portfolio to regain its previous peak following its maximum drawdown. These measures provide an indication not only of the severity of the losses investors historically faced, but also of the patience that could have been required to recover from them.
The long-term record illustrates both the potential rewards and risks of investing in smaller companies. From 1927 through 2025, the largest-company decile generated a 9.9% compound annual return, compared to the smallest-company decile’s 12.2% compound annual return. The advantage was not perfectly consistent across every size group, but returns generally increased as company size declined.
Higher returns, however, came with substantially greater volatility. Standard deviation increased from 18.9% for the largest stocks to 37.8% for the smallest ones. This greater volatility also created a much wider gap between average and compound returns. The smallest stocks produced a mean return of 17.9% but a compound annual return of 12.2%, illustrating the impact that volatility can place on long-term wealth accumulation.
Interestingly, smaller stocks did not produce positive returns more frequently. The largest stocks were positive in 76% of calendar years, compared to 66% for the smallest stocks. Instead, smaller stocks experienced more extreme outcomes. The smallest decile gained more than 20% in 49% of calendar years, compared to 38% for the largest stocks. However, the smallest decile losses exceeding 20% occurred in 11% of calendar years, versus 7% for the largest stocks.
The trade-off is also evident in maximum drawdowns. The largest-stock decile experienced a maximum decline of 64%, while drawdowns among the smaller-stock deciles reached 80% or more. Interestingly, deeper drawdowns did not necessarily translate into longer recovery periods. While maximum drawdowns generally became more severe as company size declined, the time required to regain the previous peak tended to shorten, although the relationship was not perfectly linear. The largest-stock decile took 23 years to recover from its maximum drawdown, compared to 13 years for the smallest-stock decile. Several of the intermediate deciles recovered in about 10 years. Despite their deeper drawdowns, smaller stocks often regained their previous peaks sooner.
The historical size premium therefore came with a meaningful trade-off: Higher long-term returns were accompanied by greater volatility, more frequent large losses and substantially deeper drawdowns, even though smaller stocks often recovered from those declines more quickly than larger stocks.
The full 1927–2025 history provides the broadest view of the relationship between company size, return and risk, but it also encompasses some of the most unusual economic and market conditions in U.S. history, including the 1929 stock market crash, the Great Depression, banking crises of the 1930s and World War II. Market structure, regulation, information availability and trading practices have also changed substantially since then.
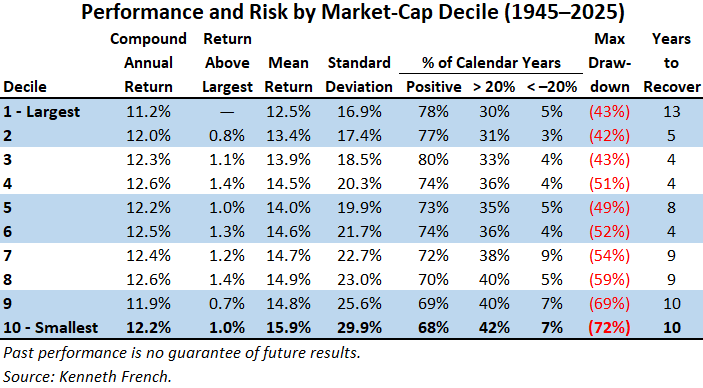
Examining the period beginning in 1945 provides a useful test of whether the historical size effect persisted after these extraordinary events. The 1945–2025 period still encompasses more than eight decades of market history, including numerous recessions, inflationary and deflationary periods, changing interest-rate regimes, bear markets, financial crises, and technological transformations.
The postwar results generally reinforce the conclusions from the full history, but the differences between large and small stocks become less dramatic. The largest-company decile generated an 11.2% compound annual return, compared to the smallest decile’s 12.2% return, reducing the small-stock advantage from 2.3 percentage points over the full period to 1.0 percentage point after 1945. The intermediate deciles generated compound annual returns between 11.9% and 12.6%. The size premium therefore remained evident at the extremes, but the postwar results do not show a consistent progression of higher returns as market cap declines.
Risk differences remain much clearer. Standard deviation increased from 16.9% for the largest stocks to 29.9% for the smallest ones. However, the spread is considerably narrower than over the 1927–2025 period, when volatility ranged from 18.9% to 37.8%. Removing the turbulent prewar period therefore reduces both the apparent return advantage and the extreme volatility associated with the smallest stocks.
Maximum drawdowns are considerably less severe once the Great Depression is removed. The largest-stock maximum drawdown falls from 64% over the full period to 43% after 1945, while the smallest-stock maximum drawdown declines from 84% to 72%. Smaller-company stocks nevertheless continued to experience deeper declines than larger companies. At the same time, deeper drawdowns did not necessarily mean longer recoveries. The largest-stock decile required 13 years to regain its previous peak following its maximum postwar drawdown, compared to 10 years for the smallest decile. Recovery periods across the 10 deciles ranged from four to 13 years.
The historical evidence supports the case for including smaller companies in a long-term investing strategy, but it also highlights the trade-offs involved. Smaller-company stocks generally produced higher average and compound annual returns over the full historical period, although the relationship was not perfectly linear. Those higher returns came with substantially greater volatility, more frequent large annual losses and deeper maximum drawdowns.
The postwar record provides a somewhat more tempered picture. The return advantage of the smallest stocks narrowed considerably after 1945, while the relationship between smaller company size and greater volatility remained evident. Smaller stocks also continued to produce positive returns less frequently than the largest stocks, but they experienced substantially more years with gains exceeding 20%.
These results help explain why a long-term perspective is particularly important when investing in small companies. Their historical return advantage has not appeared consistently from year to year, and investors have had to endure considerably greater fluctuations along the way. More importantly, size alone does not distinguish between attractive and unattractive investments. The smallest-company universe contains financially strong businesses alongside weaker companies, as well as stocks trading at both attractive and expensive valuations.
In a future commentary, we will build on this size analysis by examining whether combining company size with other characteristics can improve the historical return and risk profile. We will start with valuation, examining nearly a century of returns across 100 portfolios formed by both market cap and book-to-market ratios. The analysis will help us determine if it is possible to improve upon the size effect.
(08/06/2026)
Alpha Pro Tech reported second-quarter 2026 earnings per diluted share of $0.18, up 50.0% from $0.12 in the prior-year quarter. Net sales increased 12.0% year-over-year from $16.7 million to $18.7 million, while net income over the same period increased 46.8% from $1.2 million to $1.8 million. Excluding a $219,000 impact from tariff refunds, adjusted net income was $1.6 million, up 33.3% year over year.
(08/10/2026)
Amplify Energy reported second-quarter 2026 earnings of $0.40 per share, up from $0.15 per share in the prior-year quarter. On an adjusted basis, the company lost $0.042 per share, which was below the S&P Global consensus estimate for earnings of $0.15 per share. Total revenues were $52.7 million, down 23.0% year over year from $68.4 million. Net income was $17.3 million, up from $6.4 million in the prior-year quarter. Adjusted EBITDA was $8.6 million, down 54.7% year over year from $19.0 million.
Columbus McKinnon Corporation (CMCO)
(07/30/2026)
Columbus McKinnon reported diluted earnings of $0.61 per share for its fiscal first-quarter 2027 ended June 30, up 22.0% from $0.50 in the prior-year quarter. Earnings were 123.2% above the S&P Global consensus estimate of $0.273 per share. Net sales surged 125.3% year over year to $531.5 million from $235.9 million, driven almost entirely by the February 3, 2026, acquisition of Kito Crosby. On a GAAP basis, the company reported a net loss attributable to the company of $88.4 million, reflecting $70.3 million of acquisition and integration-related expenses including a $55.2 million non-cash inventory step-up charge. Adjusted EBITDA more than tripled year over year to $111.5 million with adjusted EBITDA margin expanding 720 basis points to 21.0%.
Core Molding Technologies, Inc. (CMT)
(08/04/2026)
Core Molding Technologies reported second-quarter 2026 adjusted earnings per diluted share of $0.39, down 26.4% from $0.53 in the prior-year quarter. The company does not have earnings coverage by S&P Global. Total net revenues decreased 20.8% year-over-year from $79.2 million to $62.7 million, while net income declined 56.0% from $4.1 million to $1.8 million. Adjusted EBITDA declined 19.8% to $7.6 million but held its margin steady at 12.2% compared to 12.0% year over year.
Covenant Logistics Group, Inc. (CVLG)
(07/29/2026)
Covenant Logistics Group reported second-quarter 2026 adjusted diluted earnings of $0.42 per share, down 6.7% from $0.45 per share in the prior-year quarter. Adjusted earnings matched the S&P Global consensus estimate of $0.425. Total revenue increased 9.9% year-over-year from $302.9 million to $332.9 million, while net income over the same period decreased 13.3% from $9.8 million to $8.5 million. The adjusted operating ratio worsened from 94.6% to 95.9%, reflecting cost pressures management does not expect to continue at their second-quarter levels.
(07/29/2026)
Escalade, Inc. reported second-quarter 2026 earnings per diluted share of $0.68, up 423.1% from $0.13 in the prior-year quarter. Escalade does not have earnings coverage by S&P Global. Net sales increased 6.2% year-over-year, from $54.3 million to $57.7 million, and net income surged from $1.8 million to $9.4 million. Excluding the recovery of tariffs, second-quarter 2026 net income was $2.6 million, or $0.19 per diluted share. Adjusted EBITDA was $4.7 million, an improvement of $0.8 million over the prior-year period’s $3.9 million.
Friedman Industries, Incorporated (FRD)
(08/06/2026)
Friedman Industries reported diluted earnings of $1.79 per share for its fiscal first-quarter 2027 ended June 30, up 152.1% from $0.71 in the prior-year quarter. Net sales increased 78.1% year-over-year from $134.8 million to $240.0 million, and net earnings surged 154.3% year over year, from $5.0 million to $12.8 million. EBITDA more than doubled to $19.3 million from $8.2 million in the prior-year quarter.
Gilat Satellite Networks Ltd. (GILT)
(08/05/2026)
Gilat Satellite reported second-quarter 2026 non-GAAP diluted earnings of $0.20 per share, down 4.7% from $0.21 in the prior-year quarter. Earnings were 100.0% above the S&P Global consensus estimate of $0.10 per share. Revenue increased 17% year-over-year to $122.7 million from $105.0 million. GAAP net income was $8.1 million, or $0.10 per diluted share, compared with $9.8 million, or $0.17 per diluted share, in the prior-year quarter. Adjusted EBITDA grew 31% to $15.4 million with margin expanding from 11.2% to 12.6% year over year.
Hudson Technologies, Inc. (HDSN)
(08/05/2026)
Hudson Technologies reported second-quarter 2026 diluted earnings of $0.12 per share, down 47.8% from $0.23 in the prior-year quarter. Revenues increased 7.5% year-over-year from $72.8 million to $78.3 million on 12% volume growth. Net income declined 51.4% from $10.2 million to $4.9 million. A 34.2% surge in selling, general and administrative (SG&A) expenses compressed gross margin from 31% to 26% and operating income from $12.7 million to $7.4 million.
(08/05/2026)
Mastech Digital reported second-quarter 2026 adjusted earnings of $0.08 per share, a 46.7% decrease from $0.15 per share in the prior-year quarter. Earnings were 36.0% lower than the S&P Global consensus estimate of $0.125 per share. Total revenues were $41.4 million, down 15.6% year-over-year from $49.1 million, with data & AI segment and talent segment revenue changes of –14.4% and –16.2%, respectively. Operations loss was $0.3 million, compared to income from operations of $27,000 in the same period a year ago, primarily driven by declining talent segment revenue tied to client insourcing, partially offset by improved gross margins in both segments.
(08/10/2026)
Mistras Group reported second-quarter 2026 adjusted diluted earnings of $0.28 per share, up 47.4% from $0.19 per share in the prior-year quarter. Earnings were 12.0% above the S&P Global consensus estimate of $0.25 per share. Revenue was $193.1 million, up 4.2% year over year, with growth in the infrastructure, power generation, and aerospace & defense markets. Adjusted EBITDA was $25.8 million, up 7.0% year over year, and adjusted EBITDA margin was 13.3%, up 30 basis points (bps).
(08/05/2026)
NACCO Industries reported second-quarter 2026 diluted loss of $0.13 per share, compared to diluted earnings of $0.44 per share in the prior -year quarter. The company does not have earnings coverage by S&P Global. Revenues were $72.3 million, up 6.0% year-over-year from $68.2 million, with contract mining and minerals segment and royalties segment revenue growth of 20.2% and 46.1%, respectively, over this period. Operating loss was $2.3 million, compared to an operating loss of $0.1 million in the same period a year ago, primarily driven by $12.0 million of asset impairment charges related to solar development projects within ReGen Resources, partially offset by strong underlying gross profit growth across all reportable segments.
Natural Gas Services Group, Inc. (NGS)
(08/10/2026)
Natural Gas Services reported second-quarter 2026 adjusted diluted earnings of $0.42 per share, up 13.5% year over year. Revenue was $51.4 million, up 24.2% year over year from $41.4 million, due to higher rental revenue. Adjusted EBITDA was $25.1 million, up 27.4% year over year.
Looking ahead to full-year 2026, the company increased its adjusted EBITDA guidance to $103 million to $108 million, attributing its update to the acquisition of Flatrock Compression Holdings LLC, fleet expansion and high utilization.
NCS Multistage Holdings, Inc. (NCSM)
(07/30/2026)
NCS Multistage reported a second-quarter 2026 diluted loss of $1.71 per share, compared to diluted earnings of $0.34 per share in the prior-year quarter. MCS Multistage does not have earnings coverage by S&P Global. Total revenues were $38.4 million, up 5.2% year-over-year from $36.5 million. The company incurred an operating loss of $5.6 million, compared to an operating loss of $2.0 million in the same period a year ago. Higher selling, general and administrative expenses related to strategic acquisition-related activities, including the pending Weatherford transaction, were the primary cause.
Oil States International, Inc. (OIS)
(07/30/2026)
Oil States International reported second-quarter 2026 adjusted earnings of $0.14 per share, a 57.0% increase from the prior-year quarter’s adjusted earnings of $0.09 per share. Earnings were 29.6% higher than the S&P Global consensus estimate of $0.108 per share. Total revenues were $156.7 million, down 5.3% year-over-year from $165.4 million. Offshore Manufactured Products revenue declined 13%, and Downhole Technologies segment revenue rose 35%. Operating income was $11.7 million, up 122% over the same period from $5.3 million, primarily driven by a gain on the disposal of a facility held for sale, partially offset by facility consolidation and executive transition charges.
Pangaea Logistics Solutions Ltd. (PANL)
(08/10/2026)
Pangaea Logistics Solutions reported second-quarter 2026 adjusted diluted earnings of $0.26 per share, up from a loss of $0.02 per share in the prior-year quarter. Earnings were 9.9% above the S&P Global consensus estimate of $0.237 per share. Total revenues were $187.1 million, up from $156.7 million in the prior-year quarter, with the largest gains coming from voyage and charter revenue. Adjusted EBITDA was $35.0 million, more than doubled from $15.6 million in the prior-year quarter. Time charter equivalent rates were $18,153 per day, up $12,108 per day in the prior-year quarter.
Park-Ohio Holdings Corp. (PKOH)
(08/05/2026)
Park-Ohio Holdings reported second-quarter 2026 adjusted earnings of $0.93 per share, a 24.0% increase from $0.75 per share in the prior-year quarter. Earnings were 15.2% higher than the S&P Global consensus estimate of $0.807 per share. Net sales were $440.1 million, up 10.0% year-over-year from $400.1 million, with supply technologies segment and engineered products segment growth of 11.9% and 9.8%, respectively. Operating income was $24.5 million, up 21.9% over the same period from $20.1 million, primarily driven by higher sales volumes across all three business segments, continued growth in proprietary products and various profit-enhancement initiatives.
(07/28/2026)
Rocky Brands reported second-quarter 2026 adjusted earnings of $1.90 per share, a 245.5% increase from the prior-year quarter’s adjusted earnings of $0.55 per share. Earnings were 442.9% higher than the S&P Global consensus estimate of $0.35 per share. Net sales were $118.4 million, up 12.0% year-over-year from $105.6 million. Wholesale segment sales rose 7.9%, and retail sales rose 21.8%. Income from operations was $19.7 million, up 175.1% over the same period from $7.2 million, primarily driven by the recognition of tariff refunds, partially offset by higher operating expenses.
Smith Douglas Homes Corp. (SDHC)
(08/06/2026)
Smith Douglas Homes reported second-quarter 2026 diluted earnings of $0.03 per share, down 88.5% from $0.26 per share in the prior-year quarter. Earnings were 70.0% lower than the S&P Global consensus estimate of $0.10 per share. Home closing revenue was $273.0 million, up 21.9% year-over-year from $223.9 million, with Southeast segment and Central segment growth of 19.6% and 25.9%, respectively. Pretax income was $1.9 million, down 89.1% over the same period from $17.2 million, primarily driven by $7.6 million of real estate inventory impairment and lot option contract abandonment charges.
USANA Health Sciences, Inc. (USNA)
(08/04/2026)
USANA reported a second-quarter 2026 adjusted diluted loss of $0.07 per share, compared to adjusted diluted earnings of $0.74 per share in the prior-year quarter. Earnings were 116.3% lower than the S&P Global consensus estimate of $0.43 per share. Net sales were $223.0 million, down 5.5% year over year from $236.0 million. Net sales for the Core Nutritional segment and Hiya Health segment were down 4% and 17%, respectively, year over year. Operations posted a loss of $20.0 million, down from earnings of $16.7 million in the same period last year. The company forecasts full-year net sales of $910.0 million and adjusted earnings of $0.76 per share.
 Get updates about the portfolio that has outperformed the market by 211.9%
since inception!
Get updates about the portfolio that has outperformed the market by 211.9%
since inception!