Related

AAII Model Portfolios
Investing is not always easy.
A great deal of research supports the notion that over the long term, stocks of smaller companies have had greater returns than those of larger companies. The research also shows that low price-to-book-value ratio stocks have had higher returns over the long term than glamour (high price-to-book-value) stocks—and this was in addition to any smallness effect. The Model Shadow Stock Portfolio was designed to capture the benefit of these observations.
To realize those higher long-term gains, however, you have to be willing to expect some periods of underperformance. You also have to be able to accept greater short-term volatility from small-cap stocks, with the understanding that your long-term wealth accumulation should benefit from your patience.
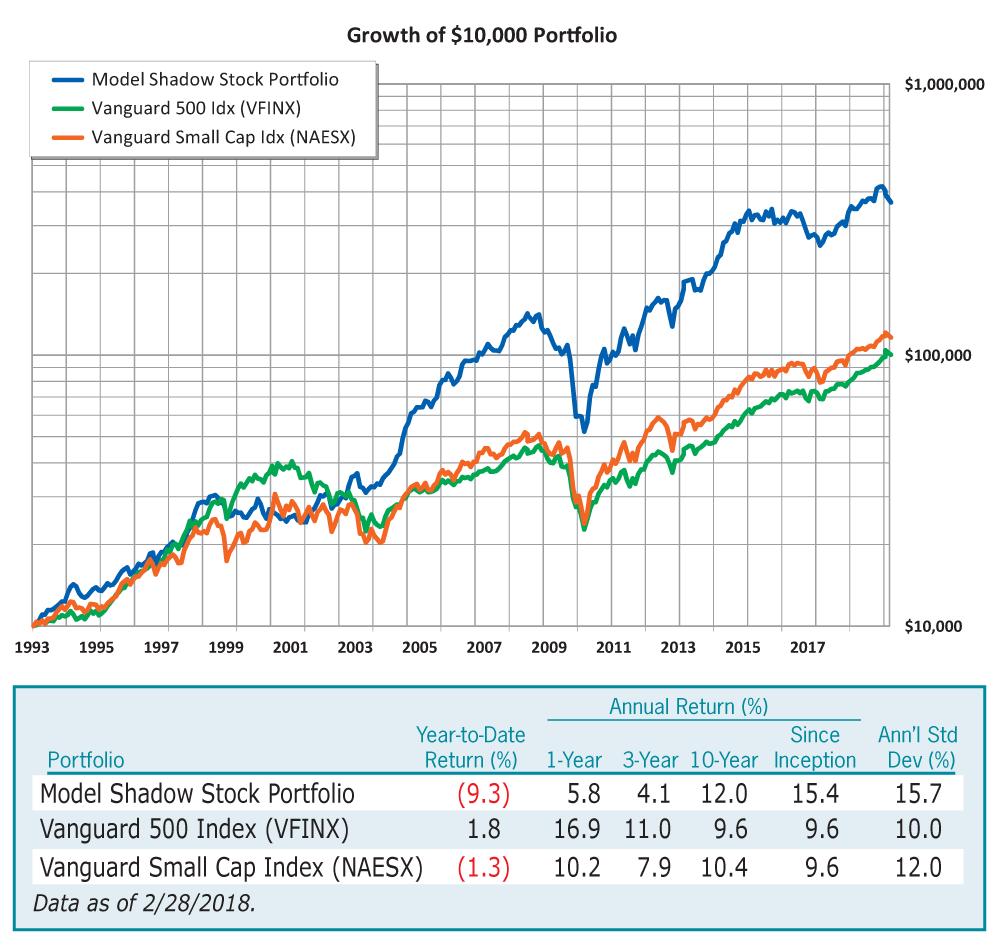
So far, 2018 is certainly testing the patience of small-cap value investors. As of February 28, 2018, the Model Shadow Stock Portfolio was down 9.3% year to date, compared to a 1.8% gain for the S&P 500 index as measured by the Vanguard 500 Index fund (VFINX). The Vanguard Small Cap Index fund (NAESX) is down 1.3% year-to-date. Figure 1 provides a chart of long-term performance along with compound annual returns, while Table 3 provides a year-by-year history of the performance of the Model Shadow Stock Portfolio.
The portfolio’s performance this year has been influenced by significant declines of a handful of holdings, most of which still qualify under the value and size rules for being added to the portfolio. The Model Shadow Stock Portfolio reflects the philosophy that success comes more from concern for the overall portfolio than for individual stocks. The portfolio rules focus on building a portfolio of stocks possessing the attractive characteristics as highlighted by sound academic research coupled with portfolio management rules aimed at controlling emotional behaviors that normally reduce long-term aftertax returns of managing a portfolio of micro-company stocks.
As noted by AAII founder James Cloonan when he started this model portfolio, for those willing to spend more time managing their portfolios, additional screens and quantitative analysis can be used. Keep in mind that research continually shows that, among individuals and professional investors alike, those with a consistent approach win and those who keep changing strategies lose.
Table 1 lists the stocks that currently make up the Model Shadow Stock Portfolio, and Table 2 summarizes the changes made during the quarterly update. After conducting our quarterly review of the Model Shadow Stock Portfolio at the end of February, none of the current Shadow Stock holdings met any of the portfolio’s sell rules in terms of earnings, price-to-book ratio or market capitalization. However, Hardinge Inc. (HDNG) announced that it had entered into a definitive merger agreement to be acquired by an affiliate of Privet Fund Management LLC for $18.50 per share in cash. Therefore, Hardinge was sold from the portfolio.
Table 1. Model Shadow Stock Portfolio
| Company (Ticker) | Current Price ($) | 52-Week | Market Cap ($ Mil) | P/E Ratio (X) | P/B Ratio (X) | Div Yield (%) | Notes | |
|---|---|---|---|---|---|---|---|---|
| High ($) | Low ($) | |||||||
| Aceto Corp. (ACET) | 7.17 | 17.10 | 6.99 | 228.30 | 31.3 | 0.64 | 3.6 | qualifies as of 2/28/2018 |
| Amira Nature Foods (ANFI) | 4.04 | 7.05 | 3.85 | 165.60 | 4.7 | 0.77 | 0.0 | qualifies as of 2/28/2018 |
| Autoweb Inc. (AUTO) | 7.06 | 14.79 | 6.63 | 92.90 | 42.5 | 0.70 | 0.0 | qualifies as of 2/28/2018 |
| AV Homes Inc. (AVHI) | 16.80 | 20.50 | 14.65 | 380.60 | nmf** | 0.88 | 0.0 | |
| Beazer Homes USA (BZH) | 15.72 | 23.24 | 11.18 | 551.00 | 37.5 | 0.91 | 0.0 | |
| Big 5 Sporting Goods (BGFV) | 6.15 | 17.10 | 5.05 | 127.50 | 20.9 | 0.64 | 9.8 | |
| Container Store Group (TCS)* | 5.05 | 6.37 | 3.53 | 242.00 | 61.6 | 0.96 | 0.0 | qualifies as of 2/28/2018 |
| CPI Aerostructures (CVU) | 8.20 | 10.05 | 5.55 | 74.00 | 12.4 | 1.01 | 0.0 | |
| CSS Industries Inc. (CSS) | 18.41 | 30.29 | 18.41 | 173.40 | nmf** | 0.57 | 4.3 | |
| Delta Apparel, Inc. (DLA) | 18.05 | 23.47 | 15.55 | 140.00 | 12.0 | 0.92 | 0.0 | qualifies as of 2/28/2018 |
| Ducommun Incorporated (DCO) | 28.14 | 35.58 | 25.06 | 322.70 | 24.0 | 1.41 | 0.0 | |
| Ennis, Inc. (EBF) | 19.50 | 21.50 | 15.20 | 512.20 | 15.6 | 1.90 | 4.1 | |
| Flexsteel Industries (FLXS) | 38.86 | 57.79 | 37.52 | 297.50 | 11.3 | 1.27 | 2.3 | |
| Hallador Energy Co. (HNRG) | 6.60 | 8.99 | 4.79 | 192.30 | 26.1 | 0.86 | 2.4 | qualifies as of 2/28/2018 |
| Hooker Furniture Corp. (HOFT) | 37.35 | 52.75 | 29.75 | 445.20 | 14.2 | 1.96 | 1.5 | |
| Kimball Electronics (KE) | 17.35 | 22.45 | 15.05 | 473.70 | 14.3 | 1.36 | 0.0 | |
| New Home Co. (NWHM) | 11.24 | 13.55 | 9.75 | 243.20 | 13.8 | 0.89 | 0.0 | |
| Olympic Steel, Inc. (ZEUS) | 22.53 | 27.16 | 15.83 | 258.30 | 20.3 | 0.96 | 0.4 | qualifies as of 2/28/2018 |
| PC Connection, Inc. (CNXN) | 24.83 | 30.48 | 22.66 | 684.60 | 14.2 | 1.42 | 0.0 | |
| PCM Inc. (PCMI) | 7.10 | 31.20 | 7.05 | 88.90 | 9.1 | 0.67 | 0.0 | |
| RCM Technologies (RCMT) | 6.36 | 6.55 | 3.89 | 77.60 | 49.9 | 2.25 | 0.0 | |
| RCI Hospitality Holdings (RICK) | 27.01 | 33.78 | 16.02 | 270.10 | 31.9 | 1.98 | 0.4 | |
| Renewable Energy Group (REGI) | 11.10 | 13.55 | 8.85 | 427.20 | nmf | 0.78 | 0.0 | earnings probation as of 2017Q3 |
| REX American Resources (REX) | 80.72 | 107.87 | 72.71 | 544.70 | 16.1 | 1.47 | 0.0 | |
| Roadrunner Transportation (RRTS) | 3.83 | 9.75 | 3.52 | 154.10 | nmf** | 0.74 | 0.0 | |
| Rocky Brands Inc. (RCKY) | 18.40 | 20.95 | 10.25 | 136.90 | 21.5 | 1.00 | 2.4 | qualifies as of 2/28/2018 |
| Seneca Foods Corp. (SENEA) | 29.10 | 39.45 | 27.75 | 296.40 | 40.1 | 0.65 | 0.0 | qualifies as of 2/28/2018 |
| SigmaTron International (SGMA) | 7.10 | 11.61 | 4.01 | 31.10 | 12.9 | 0.47 | 0.0 | qualifies as of 2/28/2018 |
| Strattec Security Corp. (STRT) | 34.20 | 49.20 | 23.00 | 133.70 | 12.5 | 0.80 | 1.6 | qualifies as of 2/28/2018 |
| Townsquare Media Inc. (TSQ) | 6.96 | 13.01 | 6.28 | 129.50 | 10.9 | 0.32 | 0.0 | qualifies as of 2/28/2018 |
| Vishay Precision Group (VPG) | 29.95 | 31.80 | 15.10 | 409.40 | 25.5 | 2.10 | 0.0 | |
|
na = not available nmf = no meaningful figure *new addition as of 3/9/2018. **Trailing four-quarter GAAP earnings negative, but adjusted earnings positive. Source: AAII’s Stock Investor Pro/Thomson Reuters. Data as of 2/28/2018. |
||||||||
|
Approaching Size Limit: Stocks are sold if their market capitalization goes above three times the initial maximum criterion and there is a stock to replace it. The current market capitalization maximum for initial screening is $400 million. Stocks are marked “approaching size limit” if their current market cap exceeds 2½ times the initial criterion, or $1 billion. Approaching Value Limit: Stocks are sold once their price-to-book-value ratio goes above three times the initial criterion and there is a stock to replace it. The current initial price-to-book ceiling is 1.00. Stocks are marked “approaching value limit” if their current price-to-book-value ratio exceeds 2½ times the initial criterion, or 2.50. Earnings Probation: If last 12 months’ earnings are negative, the stock is put on probation; if a subsequent quarter has negative earnings prior to 12-month earnings becoming positive, the stock is sold. When available, adjusted (non-GAAP) earnings are used to put stocks on probation or sell them. Otherwise, earnings from continuing operations are used. The date is the fiscal quarter during which the company first reported negative trailing 12-month earnings. Qualifies as of: Stock still qualified as a buy when the screen was run with current data. Stocks that don’t currently qualify as a buy are held until they meet one of the sell rules. See the Model Shadow Stock Portfolio area of AAII.com for more information. |
||||||||
Table 2. First-Quarter 2018 Transactons
| Sell | |||
|---|---|---|---|
| Company (Ticker) | Reason | ||
| Hardinge, Inc. (HDNG) | acquired by affiliate of Privet Fund Mgmt LLC | ||
| Buy | |||
| Company (Ticker) | Maximum Price to Pay | ||
| Container Store Group (TCS) | $5.23 (can be loosened to $5.75) | ||
With the proceeds from the Hardinge sale and the existing cash position of the Model Shadow Stock Portfolio, there were enough funds to take a position in one company at roughly the average position size for the existing holdings in the tracking portfolio.
Ten stocks passed the screen based on the liquidity requirements at the time of the review, but the portfolio already held all but two stocks. The four-week relative strength price ranking was used to select the Container Store Group (TCS) for the Model Shadow Stock Portfolio.
Table 3. Model Shadow Stock Portfolio: Annual Performance
| Year | Average Annual Return (%) | Cumulative Growth of $10,000 ($) | ||||
|---|---|---|---|---|---|---|
| Model Shadow Stock Portfolio | Vanguard 500 Index (VFINX) | Vanguard Small Cap Index (NAESX) | Model Shadow Stock Portfolio | Vanguard 500 Index (VFINX) | Vanguard Small Cap Index (NAESX) | |
| 1993 | 32.3 | 9.9 | 18.7 | 13,230 | 10,989 | 11,870 |
| 1994 | 2.0 | 1.2 | -0.5 | 13,492 | 11,118 | 11,810 |
| 1995 | 20.7 | 37.4 | 28.7 | 16,291 | 15,282 | 15,204 |
| 1996 | 22.3 | 22.9 | 18.1 | 19,927 | 18,775 | 17,959 |
| 1997 | 44.3 | 33.2 | 24.6 | 28,756 | 25,010 | 22,375 |
| 1998 | -8.9 | 28.6 | -2.6 | 26,188 | 32,168 | 21,790 |
| 1999 | 0.0 | 21.1 | 23.1 | 26,187 | 38,945 | 26,831 |
| 2000 | -7.7 | -9.1 | -2.7 | 24,163 | 35,418 | 26,116 |
| 2001 | 21.4 | -12.0 | 3.1 | 29,325 | 31,160 | 26,926 |
| 2002 | 10.8 | -22.1 | -20.0 | 32,506 | 24,259 | 21,535 |
| 2003 | 73.1 | 28.5 | 45.6 | 56,268 | 31,174 | 31,360 |
| 2004 | 43.7 | 10.8 | 19.9 | 80,843 | 34,530 | 37,587 |
| 2005 | 17.9 | 4.8 | 7.4 | 95,353 | 36,180 | 40,376 |
| 2006 | 29.4 | 15.6 | 15.6 | 123,363 | 41,832 | 46,687 |
| 2007 | -1.8 | 5.4 | 1.2 | 121,166 | 44,083 | 47,227 |
| 2008 | -50.8 | -37.0 | -36.0 | 59,582 | 27,764 | 30,217 |
| 2009 | 72.3 | 26.5 | 36.1 | 102,665 | 35,120 | 41,130 |
| 2010 | 45.4 | 14.9 | 27.7 | 149,238 | 40,358 | 52,529 |
| 2011 | 6.3 | 2.0 | -2.8 | 158,701 | 41,155 | 51,067 |
| 2012 | 33.3 | 15.8 | 18.0 | 211,588 | 47,666 | 60,274 |
| 2013 | 61.0 | 32.2 | 37.6 | 340,599 | 63,009 | 82,966 |
| 2014 | -5.8 | 13.5 | 7.4 | 320,844 | 71,516 | 89,105 |
| 2015 | -15.2 | 1.3 | -3.8 | 272,161 | 72,410 | 85,693 |
| 2016 | 29.8 | 11.8 | 18.2 | 353,261 | 80,964 | 101,248 |
| 2017 | 14.0 | 21.7 | 16.1 | 402,716 | 98,495 | 117,542 |
| 2018 YTD | -9.3 | 1.8 | -1.3 | 365,431 | 100,277 | 115,960 |
| Since Incep | 15.4 | 9.5 | 10.2 | 365,431 | 100,277 | 115,960 |
| Data as of 2/28/2018. | ||||||
James Cloonan introduced AAII members to the principles and rules of the Model Shadow Stock Portfolio in his January 1993 article that was simply titled “Thinly Traded Stocks: Putting a Practical Approach to the Test.” He felt that individual investors could effectively construct and manage a micro-cap portfolio and profit from the challenges that institutional investors faced competing in that segment of the stock market.
We thank James Cloonan for his contributions, and we pledge to continue in his steps of using curiosity, passion and intellect to “share with you the problems of dealing in thinly traded stocks.”
You can follow the Model Shadow Stock Portfolio on AAII.com in the Model Portfolios area. To receive monthly email updates along with alerts to any changes made to the portfolio, please go to www.aaii.com/email.
Model Shadow Stock Portfolio Rules
Stock purchases must meet these criteria:
Stocks are sold if any of the following occur:
AAII Model Portfolios

Small Cap Value Investing