



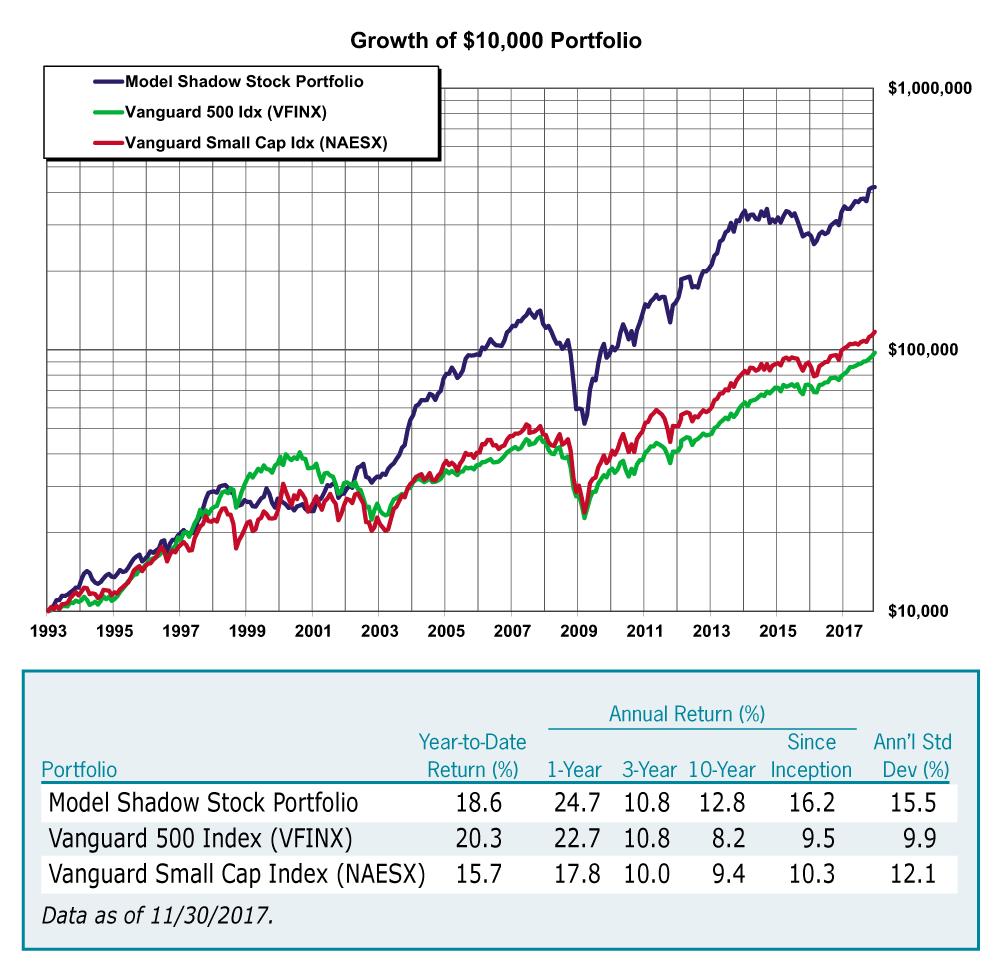
The Model Shadow Stock Portfolio still lags the S&P 500 index, due to the strong run up this past year of the very largest stocks.
The Model Shadow Stock Portfolio is up 18.6% year to date as of November 30, while the S&P 500 index, as measured by the Vanguard 500 Index fund  (VFINX) has gained 20.3%. However, for periods of a year or more the Model Shadow Stock Portfolio continues to outperform, as shown in Figure 1 and Table 3.
Portfolio Changes
Table 1 lists the stocks that currently make up the Model Shadow Stock Portfolio, and Table 2 summarizes the changes made during the quarterly update. This is the first time that the new “four-year rule” has been in effect, and the higher number of newly qualifying stocks justified the selling of a number of long-held issues.
The four-year rule permits the selling of a stock held for four years unless it currently qualifies, its price is up more than 40% since first purchased (if held more than four years it must be up 10% per year) or there is no qualifying stock to replace it. As a result of this rule, we sold four stocks:
-
Key Tronic Corp. (KTCC),
-
Salem Media Group Inc. (SALM),
-
Shoe Carnival Inc. (SCVL) and
-
VOXX International Corp. (VOXX).
Table 1. Model Shadow Stock Portfolio
| Company (Ticker) | Current Price ($) | 52-Week | Market Cap ($ Mil) | P/E Ratio (X) | P/B Ratio (X) | Div Yield (%) | Notes | |
|---|---|---|---|---|---|---|---|---|
| High ($) | Low ($) | |||||||
|
Aceto Corp. (ACET)* |
10.61 | 22.46 | 8.29 | 324.8 | 50.7 | 0.91 | 2.5 |
qualifies as of 11/30/2017 |
| Amira Nature Foods (ANFI) | 4.35 | 7.34 | 4.20 | 249.2 | 5.2 | 0.83 | 0.0 |
qualifies as of 11/30/2017 |
| AutoWeb Inc. (AUTO)* | 8.44 | 15.28 | 6.63 | 115.5 | 50.8 | 0.84 | 0.0 |
qualifies as of 11/30/2017 |
| AV Homes Inc. (AVHI) | 18.35 | 20.50 | 14.65 | 421.0 | 25.4 | 0.91 | 0.0 | |
| Beazer Homes USA (BZH) | 21.16 | 23.24 | 11.18 | 715.5 | 22.6 | 0.99 | 0.0 | |
| Big 5 Sporting Goods (BGFV)* | 7.55 | 19.50 | 6.00 | 157.5 | 7.5 | 0.79 | 7.9 |
qualifies as of 11/30/2017 |
| CPI Aerostructures (CVU) | 9.20 | 10.15 | 5.55 | 79.7 | 13.9 | 1.13 | 0.0 | |
| CSS Industries Inc. (CSS) | 27.25 | 30.29 | 23.16 | 252.5 | 12.0 | 0.86 | 2.9 |
qualifies as of 11/30/2017 |
| Delta Apparel, Inc. (DLA) | 20.25 | 23.47 | 15.55 | 148.0 | 15.2 | 0.96 | 0.0 | |
| Ducommun Incorporated (DCO) | 27.97 | 35.58 | 24.23 | 311.6 | 23.9 | 1.40 | 0.0 | |
| Ennis, Inc. (EBF) | 21.15 | 21.50 | 15.20 | 535.0 | 18.4 | 2.09 | 3.8 | |
| Flexsteel Industries (FLXS) | 52.00 | 62.99 | 43.25 | 412.9 | 16.3 | 1.73 | 1.7 | |
| Hallador Energy Co. (HNRG) | 6.56 | 9.87 | 4.79 | 182.2 | 25.9 | 0.85 | 2.4 |
qualifies as of 11/30/2017 |
| Hardinge Inc. (HDNG) | 17.06 | 18.00 | 9.51 | 223.3 | 35.1 | 1.31 | 0.5 | |
| Hooker Furniture Corp. (HOFT) | 50.00 | 50.80 | 27.40 | 571.2 | 19.4 | 2.78 | 1.0 | approaching value limit |
| Kimball Electronics (KE) | 20.85 | 22.45 | 15.05 | 558.2 | 17.5 | 1.60 | 0.0 | |
| New Home Co. (NWHM)* | 11.53 | 12.55 | 9.75 | 244.5 | 11.8 | 0.95 | 0.0 |
qualifies as of 11/30/2017 |
| Olympic Steel, Inc. (ZEUS)* | 19.92 | 28.67 | 15.83 | 216.2 | 17.9 | 0.84 | 0.4 |
qualifies as of 11/30/2017 |
| PC Connection, Inc. (CNXN) | 27.41 | 30.48 | 23.52 | 744.1 | 15.6 | 1.56 | 0.0 | |
| PCM Inc. (PCMI) | 9.85 | 31.20 | 9.55 | 118.4 | 12.6 | 0.93 | 0.0 | |
| RCM Technologies (RCMT) | 6.90 | 7.19 | 4.51 | 82.8 | 54.2 | 2.56 | 0.0 | approaching value limit |
| RCI Hospitality Holdings (RICK) | 32.93 | 33.78 | 12.14 | 318.8 | 29.2 | 2.35 | 0.4 | |
| Renewable Energy Group (REGI) | 11.35 | 13.55 | 8.25 | 421.3 | nmf | 0.80 | 0.0 | earnings probation as of 2017Q3 |
| REX American Resources (REX) | 91.54 | 107.87 | 76.10 | 586.9 | 18.3 | 1.73 | 0.0 | |
| Roadrunner Transportation (RRTS) | 8.56 | 11.88 | 6.05 | 327.4 | 13.0 | 0.52 | 0.0 |
qualifies as of 11/30/2017 |
| Rocky Brands Inc. (RCKY) | 17.70 | 20.15 | 10.25 | 130.7 | 28.9 | 0.96 | 2.5 |
qualifies as of 11/30/2017 |
| Seneca Foods Corp. (SENEA) | 34.35 | 42.65 | 27.75 | 335.6 | 75.2 | 0.78 | 0.0 | |
| SigmaTron International (SGMA) | 9.70 | 10.25 | 4.01 | 41.4 | 25.1 | 0.66 | 0.0 |
qualifies as of 11/30/2017 |
| Strattec Security Corp. (STRT) | 44.10 | 49.20 | 23.00 | 171.6 | 20.0 | 1.03 | 1.3 | |
| Townsquare Media Inc. (TSQ) | 7.94 | 13.01 | 7.00 | 147.3 | 12.4 | 0.36 | 0.0 |
qualifies as of 11/30/2017 |
| Vishay Precision Group (VPG) | 27.70 | 27.90 | 15.10 | 360.9 | 28.9 | 1.94 | 0.0 | |
Explanation of NotesApproaching Size Limit: Stocks are sold if their market capitalization goes above three times the initial maximum criterion and there is a stock to replace it. The current market capitalization maximum for initial screening is $400 million. Stocks are marked “approaching size limit” if their current market cap exceeds 2½ times the initial criterion, or $1 billion. Approaching Value Limit: Stocks are sold once their price-to-book-value ratio goes above three times the initial criterion and there is a stock to replace it. The current initial price-to-book ceiling is 1.00. Stocks are marked “approaching value limit” if their current price-to-book-value ratio exceeds 2½ times the initial criterion, or 2.50. Earnings Probation: If the last 12 months’ earnings from continuing operations are negative, the stock is put on probation; if a subsequent quarter has negative earnings prior to 12-month earnings becoming positive, the stock is sold. The date in parentheses is the fiscal quarter during which the company first reported negative trailing 12-month earnings. Qualifies as of: Stock still qualified as a buy when the screen was run with current data. Stocks that don’t currently qualify as a buy are held until they meet one of the sell rules. |
||||||||
In addition, we sold two stocks that violated other rules:
-
Alamo Group Inc. (ALG) was sold because it had grown in market cap beyond the size limit of $1.2 million; and
-
Global Power Equipment Group (GLPW) was sold because the earnings revisions and projections put it in violation of the earnings sell rule.
Ten stocks passed the screen based on our liquidity requirements, but one was Chinese and four were already owned. The remaining five were purchased with the proceeds from the above sales:
-
Aceto Corp. (ACET),
-
AutoWeb Inc. (AUTO),
-
Big 5 Sporting Goods Corp. (BGFV),
-
New Home Company (NWHM) and
-
Olympic Steel Inc. (ZEUS).
Table 2. Fourth-Quarter 2017 Transactions
| Sell | |
|---|---|
| Company (Ticker) | Reason |
|
Alamo Group, Inc. (ALG) |
exceeded value & size limits |
| Global Power Equip Group (GLPW) | negative earnings |
|
Key Tronic Corp. (KTCC) |
four-year rule |
| Salem Media Group Inc. (SALM) | four-year rule |
| Shoe Carnival, Inc. (SCVL) | four-year rule |
| VOXX International Corp. (VOXX) | four-year rule |
| Buy | |
| Company (Ticker) | Maximum Price to Pay |
|
Aceto Corp. (ACET) |
$13.20 |
| AutoWeb Inc. (AUTO) | $10.01 |
| Big 5 Sporting Goods Corp. (BGFV) | $8.90 |
| New Home Company (NWHM) | $12.06 (can be loosened to $13.27) |
| Olympic Steel, Inc. (ZEUS) | $22.86 (can be loosened to $25.15) |
Table 3. Model Shadow Stock Portfolio: Annual Performance
| Year | Average Annual Return (%) | Cumulative Growth of $10,000 ($) | ||||
|---|---|---|---|---|---|---|
|
Model Shadow Stock Portfolio |
Vanguard 500 Index (VFINX) |
Vanguard Small Cap Index (NAESX) |
Model Shadow Stock Portfolio |
Vanguard 500 Index (VFINX) |
Vanguard Small Cap Index (NAESX) |
|
| 1993 | 32.3 | 9.9 | 18.7 | 13,230 | 10,989 | 11,870 |
| 1994 | 2.0 | 1.2 | -0.5 | 13,492 | 11,118 | 11,810 |
| 1995 | 20.7 | 37.4 | 28.7 | 16,291 | 15,282 | 15,204 |
| 1996 | 22.3 | 22.9 | 18.1 | 19,927 | 18,775 | 17,959 |
| 1997 | 44.3 | 33.2 | 24.6 | 28,756 | 25,010 | 22,375 |
| 1998 | -8.9 | 28.6 | -2.6 | 26,188 | 32,168 | 21,790 |
| 1999 | -0.0 | 21.1 | 23.1 | 26,187 | 38,945 | 26,831 |
| 2000 | -7.7 | -9.1 | -2.7 | 24,163 | 35,418 | 26,116 |
| 2001 | 21.4 | -12.0 | 3.1 | 29,325 | 31,160 | 26,926 |
| 2002 | 10.8 | -22.1 | -20.0 | 32,506 | 24,259 | 21,535 |
| 2003 | 73.1 | 28.5 | 45.6 | 56,268 | 31,174 | 31,360 |
| 2004 | 43.7 | 10.8 | 19.9 | 80,843 | 34,530 | 37,587 |
| 2005 | 17.9 | 4.8 | 7.4 | 95,353 | 36,180 | 40,376 |
| 2006 | 29.4 | 15.6 | 15.6 | 123,363 | 41,832 | 46,687 |
| 2007 | -1.8 | 5.4 | 1.2 | 121,166 | 44,083 | 47,227 |
| 2008 | -50.8 | -37.0 | -36.0 | 59,582 | 27,764 | 30,217 |
| 2009 | 72.3 | 26.5 | 36.1 | 102,665 | 35,120 | 41,130 |
| 2010 | 45.4 | 14.9 | 27.7 | 149,238 | 40,358 | 52,529 |
| 2011 | 6.3 | 2.0 | -2.8 | 158,701 | 41,155 | 51,067 |
| 2012 | 33.3 | 15.8 | 18.0 | 211,588 | 47,666 | 60,274 |
| 2013 | 61.0 | 32.2 | 37.6 | 340,599 | 63,009 | 82,966 |
| 2014 | -5.8 | 13.5 | 7.4 | 320,844 | 71,516 | 89,105 |
| 2015 | -15.2 | 1.3 | -3.8 | 272,161 | 72,410 | 85,693 |
| 2016 | 29.8 | 11.8 | 18.2 | 353,261 | 80,964 | 101,248 |
| 2017 YTD | 18.6 | 20.3 | 15.7 | 418,994 | 97,423 | 117,109 |
| Since Incep | 16.2 | 9.5 | 10.3 | 418,994 | 97,423 | 117,109 |
| Data as of 11/30/2017. | ||||||
I really feel the four-year rule will help the portfolio get rid of underperformers and allow the inclusion of more newly qualifying stocks while not eliminating stocks that maintain their momentum over the years.
Looking Ahead
There is more and more talk about a potential pullback, but every time the market pulls back a little there are investors who see the dip as an opportunity. Certainly, there will be a pullback someday, but I don’t want to be out of the market. My philosophy continues to be: Losses due to a falling market when I am invested are temporary and limited; losses due to being out of the market when it goes up are forever and unlimited.
This will be my final article before my retirement. I will miss writing the articles, but I know that the Shadow Stock philosophy and the maintenance of the model portfolio will continue to help AAII members. Look for coverage in the AAII Journal on a regular basis and anytime here.
Model Shadow Stock Portfolio Rules
Purchase and Sales Rules
Stock purchases must meet these criteria:
-
No bulletin board or pink sheet stocks will be purchased.
-
Price-to-book-value ratio must be less than or equal to 1.00. (Figure will change gradually with changes in overall market values.)
-
Market capitalization must be between $30 million and $400 million. (Figure will change gradually with changes in overall market values.)
-
The firm’s last quarter and last 12 months’ earnings from continuing operations must be positive and, if there are earnings estimates, the estimates must be positive for the current quarter and year.
-
No financial stocks, including those in the rental & leasing industry, or limited partnerships will be purchased.
-
No utility stocks will be purchased.
-
No stocks on foreign exchanges or ADRs will be purchased due to different accounting and/or withholding tax on dividends. Foreign stocks traded primarily on U.S. exchanges are OK with one exception: The stock of any company whose primary business is in China will not be purchased.
-
The share price must be greater than $4.
-
In order to reduce trading by avoiding stocks that are forever marginal, any stock that was sold within two years will not be rebought.
-
Note second item under Stock Order Guidance concerning spreads when buying shares.
-
Price-to-sales ratio must be less than 1.2. (Figure may change gradually with changes in overall market values.)
-
Eliminate any company that failed to file a 10-Q (quarterly) report in the last six months.
-
Relative price strength over the last four weeks will be used as a tie-breaker.
Stocks are sold if any of the following occur:
-
If last 12 months’ earnings from continuing operations are negative, the stock is put on probation; if a subsequent quarter has negative earnings prior to 12-month earnings from continuing operations becoming positive, the stock is sold.
-
The stock’s price-to-book-value ratio goes above three times the initial criterion and there is a stock to replace it.
-
Market capitalization goes above three times the initial maximum criterion and there is a stock to replace it.
-
The stock has been held for four years—unless it currently qualifies, its price is up more than 40% from the purchase price, or there is no qualifying stock to replace it. If a stock has been held for over four years, it needs to be up 10% per year held to avoid being sold (for example, a stock held six years needs to be up 60%). Time and return are based on the initial purchase for the portfolio.
Stock Order Guidance
-
These rules are for general guidance. Your own experience, market conditions and the size of the position will impact your own decisions. The results in the model portfolio were obtained while sometimes paying more.
-
Market orders are not used. Instead, if the quoted bid-ask spread is less than 2% (ask price minus bid price, divided by ask price), place a limit order at the ask price for a buy and at the bid price for a sell. If the bid-ask spread is more than 2%, try to place a limit order between the bid and ask prices to keep transaction costs low. If necessary, build a position gradually. With low commissions, it is often better to place partial orders than to try to establish a large position all at once. Be patient.
-
The average daily dollar volume should be at least 10 times the amount needed for your position. This will ensure liquidity to get in and out of the position, even if you need to grow the position gradually and sell gradually. This will result in a varying number of qualifying stocks for each investor.
-
If price changes cause a stock to become ineligible (due to changes in price-to-book-value ratio or market capitalization) when only part of the order has been filled, shares already purchased are kept but the balance of the order is canceled.
Management Rules
-
Equal dollar amounts are invested in each stock initially.
-
Decisions are made only at the end of each quarter. In order to react to the majority of earnings reports as soon as possible, quarterly reviews are made in February, May, August, and November.
-
Best judgment is used for tenders or mergers, but all criteria must be obeyed.
-
At the end of a quarter, if receipts from stocks sold exceed requirements for available new purchases, the excess receipts are kept in cash until the next review. If too much cash is accumulated, the rules will be adjusted.
-
Note that if you are managing your own portfolio, it should consist of at least 10 stocks. If you are developing the portfolio gradually, you can do it stock by stock, but don’t put more than 10% of your funds in each additional stock. More than 20 stocks is not needed until the portfolio exceeds $1 million.

Related

Investor Professor
Earnings Estimates
Related

Small Cap Value Investing
How Much Small Cap Should Be in Your Portfolio?
Discussion
FREE REPORT

Get your free copy of our special
report analyzing the tech stocks
most likely to outperform the
market.
Arlene Carlisle from CA posted over 8 years ago:
You need to log in as a registered AAII user before commenting.
Log InCreate an account