


Related

The Best of the AAII Journal
Earnings surprises and earnings estimates revisions can drive stock price momentum.
by Charles Rotblut | May 2015

Charles Rotblut leads a class in AAII's new Essential Investing Video Course. Go to https://www.aaii.com/ves for more information and to subscribe.
Earnings estimates are the profit forecasts made by brokerage firm analysts. The consensus earnings estimate is the average of all published forecasts for a specific company or index. The consensus earnings estimate is compiled by a small number of companies, such as Thomson Reuters I/B/E/S, who are given the data by the participating brokerage firms.
Consensus earnings estimates for the current fiscal year are available on nearly 4,100 exchange-listed stocks, as of April 3, 2015. Behind this vast coverage is a large variance in the number of analysts comprising the consensus earnings estimate for a given company. For example, forecasts from just one analyst are used to determine the current year consensus earnings estimate for 453 companies. At the other end of the spectrum, five companies have published earnings estimates from more than 45 analysts. The difference is directly related to investor interest. The more interest there is in brokerage research about a company, the greater the number of analysts that publish earnings estimates there is likely to be.
Analysts are not required to publish their forecasts or make them publicly available, and they are not required to cover all publicly traded companies. More than 800 exchange-listed stocks lack earnings estimates for the current fiscal year. These are mostly small companies that are less likely to be followed by institutional or individual investors.
The consensus earnings estimate serves as the basis for two drivers of stock price momentum: earnings surprises and earnings estimate revisions.
Earnings surprises, as the name implies, show how a company’s quarterly results measured up against expectations. A positive surprise (also known as a “beat”) occurs when quarterly earnings per share exceed analysts’ expectations. A negative surprise (also known as a “miss”) occurs when quarterly earnings per share are below analysts’ expectations. According to Thomson Reuters, an average of 63% of companies beat their earnings estimate each quarter.
Though earnings beats are a positive event, the reaction to them is not always the same. Traders consider various factors in addition to the actual beat, such as forward-looking guidance from the company and the magnitude by which reported earnings per share exceeds expectations. The greater the magnitude of the beat, the more favorable the reaction is likely to be.
Earnings misses, conversely, are often met with a negative reaction. A miss implies business is worse than analysts expected. If a miss is accompanied by disappointing guidance or indications of negative business conditions, a stock can fall in price.
Since earnings vary in their absolute size (e.g., one company may report earnings of $0.10 per share, while another may report earnings of $1.00 per share), the magnitude of the surprise is used to provide an apples-to-apples comparison. A one-cent beat on $0.10 per share equates to an 11% surprise ($0.01 surprise ÷ consensus estimate of $0.09 = 11%). A one-cent beat on $1.00 per share equates to a 1% surprise ($0.01 surprise ÷ consensus estimate of $0.99 = 1%). Larger percentage positive surprises are preferable.
An alternative measure is the SUE score, or the “standardized unanticipated earnings” score. It reveals the extent to which reported earnings deviate from the typical range of analysts’ estimates. For example, let’s say that the consensus earnings estimates for two companies are exactly the same. Both consensus forecasts call for $1.00 per share in profits, and 68% of analysts covering each company expect earnings to be between $0.98 and $1.02 per share. Company A reports earnings of $1.04 per share, while company B reports earnings of $1.01 per share. Both companies beat consensus expectations, but Company A is assigned a higher SUE score because its earnings are outside of the range implied by the majority of analysts’ estimates.
The SUE score itself is dependent on the number of analysts covering a company. There is greater potential for a divergence in earnings forecasts when just a few analysts cover a company than when many do. This is why when looking at an SUE score, or even just the magnitude of an earnings surprise, the number of analysts making projections should be considered. (The SUE score is available in AAII’s Stock Investor Pro fundamental stock screening and research database program.)
When a company reports an earnings surprise in one quarter, it is often likely to report surprises in subsequent quarters. This tendency is known as the cockroach effect—a reference to the fact that when one cockroach is spotted, there tend to be others.
Mitch Zacks observed in “The Little Book of Stock Market Profits: The Best Strategies of All Time” (John Wiley & Sons, 2011) that though it is a known phenomenon, the cockroach effect does not get fully priced in when a surprise occurs. Rather, the price reaction to a post-earnings announcement tends to have persistence.
David Dreman documented the cockroach effect in “Contrarian Investment Strategies: The Next Generation” (Simon & Schuster, 1998). He found that after one year, stocks with positive surprises outperform and stocks with negative returns underperform. Notably, stocks with a low price-earnings ratio fared best after a positive surprise, beating the market by 8.1% over a 12-month period following the earnings announcement. In comparison, stocks with high price-earnings ratios outperformed by 1.2% over the same period.
The reason? Investors expect good earnings from highly valued stocks, but not from stocks with low valuations. High valuations are assigned to companies experiencing good business momentum or expected to have favorable business prospects. Thus, investors expect them to issue positive surprises. The same is not true with stocks trading at low valuations. These are often out-of-favor stocks. When such stocks top expectations, investors are surprised and begin to reassess their view of the stock. This reassessment leads to an ongoing price adjustment that can be reinforced by further earnings beats.
Earnings estimate revisions are the change in the consensus estimate. A positive revision occurs when the consensus estimate is revised up. It is a sign that one or more of the covering analysts is more optimistic about the company’s future than he or she previously was. A negative revision occurs when the consensus estimate is revised down. It is a sign that one or more of the covering analysts is more pessimistic about the company’s future than he or she previously was.
Earnings estimate revisions directly affect forward-looking valuations, including the estimated price-earnings ratio and the ratio of price-earnings to earnings growth, called the PEG ratio. Positive revisions lead to higher price targets by increasing the denominator (estimated earnings) in these ratios. Negative revisions lead to lower price targets by reducing the denominator. Analysts may also adjust their price targets if the revisions to earnings estimates alter their expectations of future cash flows.
Earnings estimate revisions tend to have what is known as a “tail” in terms of their impact on price movements. As valuations adjust, a stock’s price often rises (in the case of positive revisions) or falls (in the case of negative revision) to account for the new forecasts. This, in turn, can create price momentum, which influences the decisions of traders and other investors.
The performance of AAII’s stock screens demonstrates the tail effect. The Estimate Revisions Up 5% screen has the highest long-term risk-adjusted return and one of the highest absolute annualized gains (27.7%) out of the more than 60 stock screens AAII tracks. The Estimate Revisions: Down 5% screen has among the worst long-term risk-adjusted return and one of the lowest absolute gains (0.3%). (The data is as of March 31, 2015.)
The two aforementioned screens seek out stocks whose consensus estimates have been revised up or down by 5% or more and have earnings estimates from at least four analysts. Though these restrictions rule out many companies, the message from the results are pretty clear: Rising earnings estimates boost short-term returns and falling earnings estimates hurt short-term returns. Depending where a company is in within its business cycle and how it is run, it is possible for the trend of rising or falling earnings estimates to continue for a period of time.
As stated previously, the number of analysts that make up the consensus estimate matters. It’s easier for the consensus earnings estimate to move by more than 1% or 2% when only one or two analysts publish forecasts than when 10 or more publish forecasts.
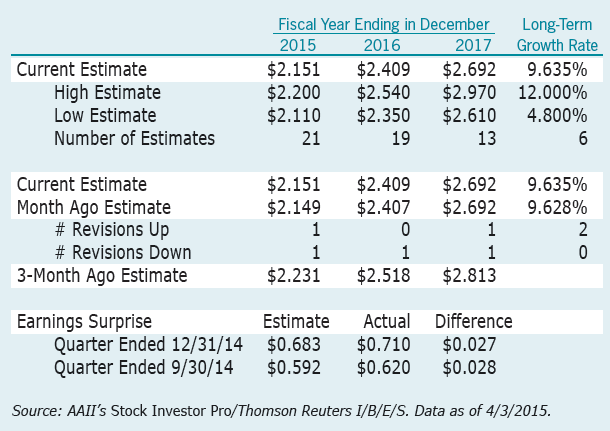
The number of analysts also influences the long-term projected growth rate. Typically, the farther out in the future an earnings estimate is made for, the lower the number of analysts comprising a consensus estimate will be. Consider Abbott Laboratories  (ABT), for instance. Forecasts from 21 analysts comprise the 2015 consensus estimate, 19 are included in the fiscal-2016 consensus estimate, 13 are used for the 2017 consensus estimate and just six comprise the long-term growth estimate, as shown in Table 1. Fewer analysts can lead to both more volatility in earnings estimate revisions and a greater deviation among the published estimates.
Table 1. Abbott Laboratories Earnings Estimates
Earnings surprises and earnings estimate revisions are cyclical at the aggregate level. They tend to follow the release of earnings reports, with both the number of surprises and revisions reaching peaks during earnings season and falling in quantity afterward. Specifically, most companies tend to report earnings two to six weeks after the end of the calendar quarter. Earnings surprises are registered when the company reports, while earnings estimate revisions may come out over a period of several days afterward.
Due to the calendar-driven cycle, there are periods when the number of surprises and estimate revisions drops. This lull occurs during the last month of a calendar quarter and during the first week or two at the start of a new calendar quarter.
Earnings estimates can be found on many widely used financial websites. On AAII.com, call up a stock quote (www.aaii.com/quote) and then click on the Earnings tab in the menu bar right above the company’s name. There are also four stock screens on AAII.com specifically designed to identify companies with rising and falling estimate revisions (Estimate Revisions: Top 30 Up, Up 5%, Lowest 30 Down, and Down 5%). Several other stock screens incorporate earnings estimates as a main component, including Dreman with Estimate Revisions and P/E Relative. Visit the Stock Screens section (www.aaii.com/stockideas) on AAII.com to find out more about them. Earnings estimate screens and data can also be found in Stock Investor Pro (www.aaii.com/stock-investor-pro).
Earnings estimates are useful benchmarks to determine how a company is performing. A company exceeding expectations (positive earnings surprises) and giving analysts reason to raise their earnings estimates typically is benefiting from positive business trends. A company that misses expectations or gives analysts reason to lower their forecasts often may be incurring business headwinds. That said, some contrarian strategies, such as those based on David Dreman’s philosophy, consider cheaply valued companies with disappointing results on the theory that investors anticipate bad news, but don’t take into account whether the company is otherwise fundamentally strong and simply incurring problems that are temporary in nature. The concept behind such strategies is that the stock’s valuation has been pushed down too much, allowing for considerable upside when business conditions improve.
Earnings estimate revisions can also be used as a short-term momentum indicator. Shares of companies with positive revisions tend to outperform, while shares of companies with negative revisions tend to underperform. When looking at such companies, pay attention to the proportionate number of analysts behind the revisions to ensure there is a consensus in the direction of change. It can also be helpful to read the company’s most recent earnings release or updated guidance to determine if there is a specific reason for the earnings estimate revision.
The Best of the AAII Journal

AAII Stock Ideas

First Cut Stocks

Joseph Turney from KS posted over 11 years ago:
Mort Mazaheri from AZ posted over 11 years ago:
Charles Rotblut from IL posted over 11 years ago:
David Humphrey from AZ posted over 8 years ago:
BARRY J from TX posted over 4 years ago:
You need to log in as a registered AAII user before commenting.
Log InCreate an account