


The purchase rules for the Model Shadow Stock Portfolio are based on academic research showing higher returns associated with the value and size factors. A common way of conducting analysis on factors is to separate stocks into 10 equal-sized groups based on their percentile ranking (deciles).
The academic research used as the basis for determining the Model Shadow Stock portfolio’s rules used NYSE-listed stocks for their analysis. As such, our portfolio considers the prevailing NYSE breakpoints for determining maximum valuation and size limits for Shadow Stock candidates. The chart below shows how these breakpoints have changed over time.
New York Stock Exchange
Relative rankings evolve with time and fluctuate with market conditions. During the mid-1990s, the smallest 10% of NYSE-listed stocks had market capitalizations of no higher than $60 million to $65 million. This amount topped the $100 million mark during the dot-com bubble and rose above $300 million for the first time during the housing bubble.
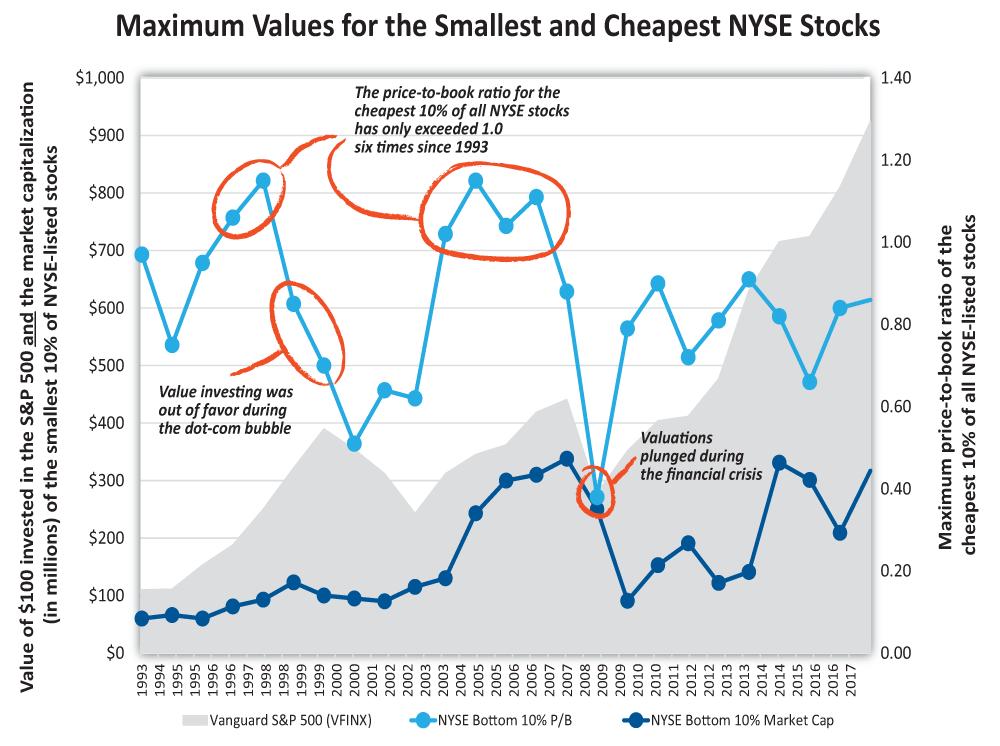
The maximum value of the cheapest 10% of price-to-book ratios has also changed with market conditions. Twenty-five-year highs were reached in 1997 (just before value went out of favor) and in 2004, while a 25-year low of 0.38 was set at the end of 2008 (a big buying opportunity.)
Model Shadow Stock Portfolio
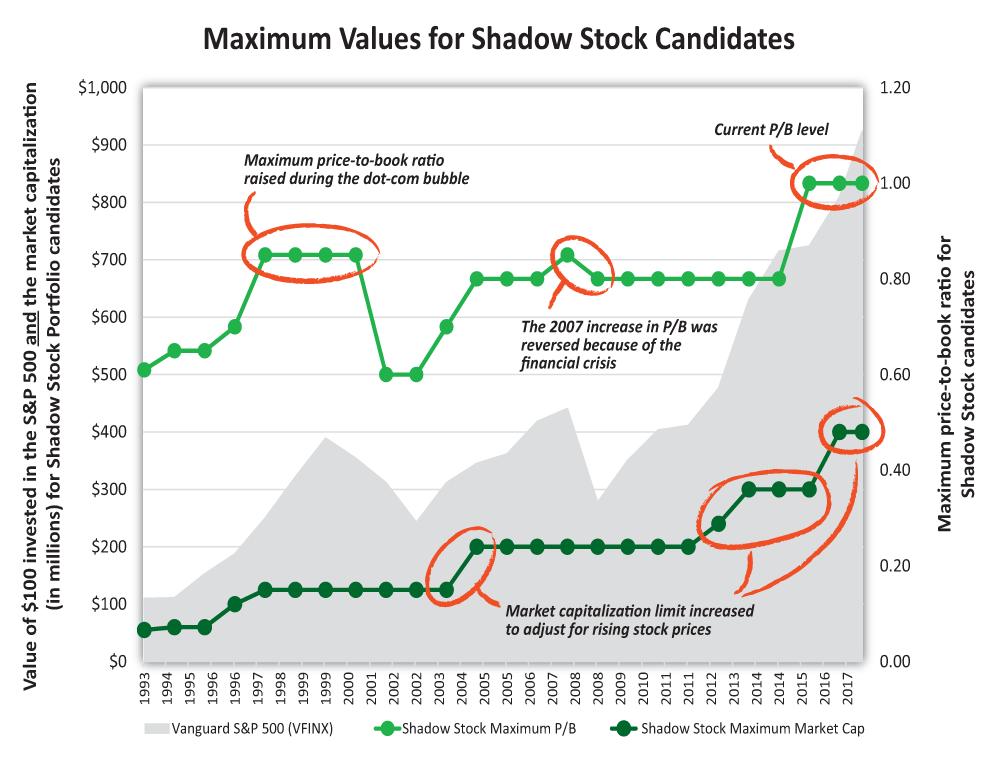
The purchase guidelines for the Model Shadow Stock Portfolio roughly attempt to seek out stocks with price-to-book ratios and market capitalizations equivalent to the bottom 10% of NYSE stocks. By not strictly adhering to the 10% limit, some stability is provided, making it easier to follow the rules.
When market conditions have changed sufficiently enough, however, the value and size requirements are altered, as can be seen above. In 2001, for example, the maximum price-to-book ratio was lowered to 0.60 in response to then bear market. In 2016, the maximum market capitalization was raised to $400 million to reflect the ongoing bull market.
Discussion
FREE REPORT

David Humphrey from AZ posted over 8 years ago:
Wayne Thorp from IL posted over 8 years ago:
You need to log in as a registered AAII user before commenting.
Log InCreate an account