Figures, Updates, Errata
Corrections to “Investing at Level3” Book, Third Edition
Posted: May 24, 2017
Table 5.5, Pages 170-171
Current S&P 500 index figures were corrected: They now show the unadjusted close on the last trading day of the year prior to the January 1 decision date. The S&P 500 high for decision date January 1, 2013, was changed from 1827 to 1468 in order to simplify the example by using a year-end high value. These changes did not alter any of the dollar values or gain/loss figures for the example strategy in this table.

Corrections to �Investing at Level3� Book, First Edition
Posted: December 14, 2016
Pages 27 & 188
The statement that the Guggenheim S&P 500 Equal Weight ETF (RSP) should outperform a cap-weighted index by two to three percentage points over the long term has been removed. The data used for comparing the performance of the RSP to the cap-weighted SPDR S&P 500 ETF (SPY) did not include reinvestment of dividends and this will affect the results. On page 188, the sentence has been replaced with this:
Figure 6.2 shows the performance of the equal-weight RSP versus the cap-weighted SPDR S&P 500 ETF (SPY), since the inception of the Guggenheim S&P 500 Equal Weight ETF in 2003. While each has periods of overperformance and underperformance, the fact that equal weighting gives more emphasis to the smaller-cap and value stocks should provide assurance that equal weighting will result in higher returns over the long run.
Pages 256-259
Corrections and amplifications have been made to AAII’s Model Shadow Stock Portfolio rules, as shown here by strikeouts and green text. Only the sections with changes are reproduced here; see the Level3 book for the sell rules and stock order guidance.
Stock Portfolio Management Criteria
Stock purchases must meet these criteria:
- Price-to-book-value ratio must be less than or equal to 1.00.
If the price-to-book-value ratio moved up a bit since the stock was included in the portfolio, it is OK to purchase the stock unless this ratio goes above 1.00.* - Market capitalization must be between $30 million and $300 million.*
- Price-to-sales ratio must be less than 1.2.*
- The firm’s last quarter and last 12 months’ earnings from continuing operations must be positive and, if there are earnings estimates, the estimates must be positive for the current quarter and year.
- The share price must be greater than $4.
- No bulletin board or pink sheet stocks will be purchased.
- No financial stocks or limited partnerships will be purchased.
- No foreign stocks or ADRs will be purchased because of different accounting and/or withholding tax on dividends. Foreign stocks traded primarily on U.S. exchanges are OK with one exception: The stock of any company whose primary business is in China will not be purchased.
- Any stock that was sold within two years will not be rebought.
- Note second item under stock order guidance (below) concerning spreads when buying shares.
- Eliminate any company that failed to file a 10-Q (quarterly) report in the last six months.
*These figures will change gradually as market values change. Any changes will be noted in the AAII Journal and online.
Management rules
- Equal dollar amounts are invested in each stock initially.
- Decisions are made only at the end of each quarter. In order to react to the majority of earnings reports as soon as possible, quarterly reviews are made in February, May, August and November.
- Best judgment is used for tenders or mergers, but all criteria must be obeyed.
- At the end of a quarter, if receipts from stocks sold exceed requirements for new purchases, the excess receipts—up to 5% of the portfolio’s value—are kept in cash until the next quarter. If the excess receipts are greater than 5% of the total portfolio value, the amount above 5% is distributed to smaller holdings that still qualify as buys.
Efficient quantities are purchased: If over 10% of the portfolio is in cash, the price-to-book-value ratio can be moved up, but never over 0.90. - At the end of a quarter, if receipts from stock sales are insufficient to buy all newly qualifying stocks, purchases are made in order of lowest bid/ask spreads.
- Note that if you are managing your own portfolio, it should consist of at least 10 stocks. If you are developing the portfolio gradually you can do it stock by stock, but don’t put more than 10% of your funds in each additional stock. More than 20 stocks are not needed until the portfolio exceeds $1 million.
Posted: November 28, 2016
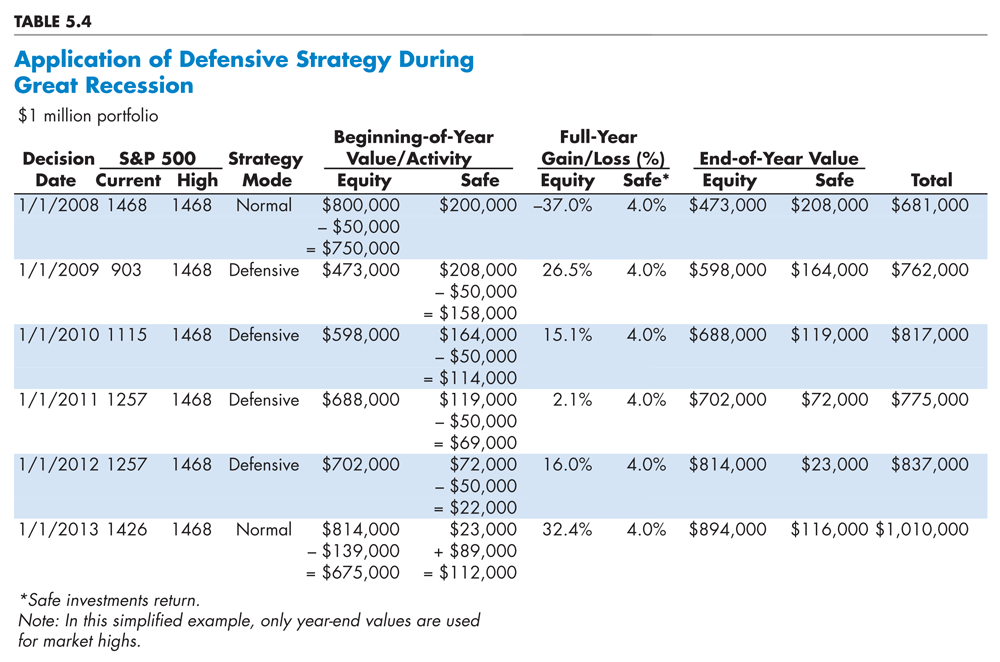
Table 5.4, pages 166-167
Current S&P 500 index figures were corrected: They now show the unadjusted close on the last trading day of the year prior to the January 1 decision date. The S&P 500 high for decision date January 1, 2013, was changed from 1827 to 1468 in order to simplify the example by using a year-end high value. These changes did not alter any of the dollar values or gain/loss figures for the example strategy in this table.
Posted: September 9, 2016
Page 43
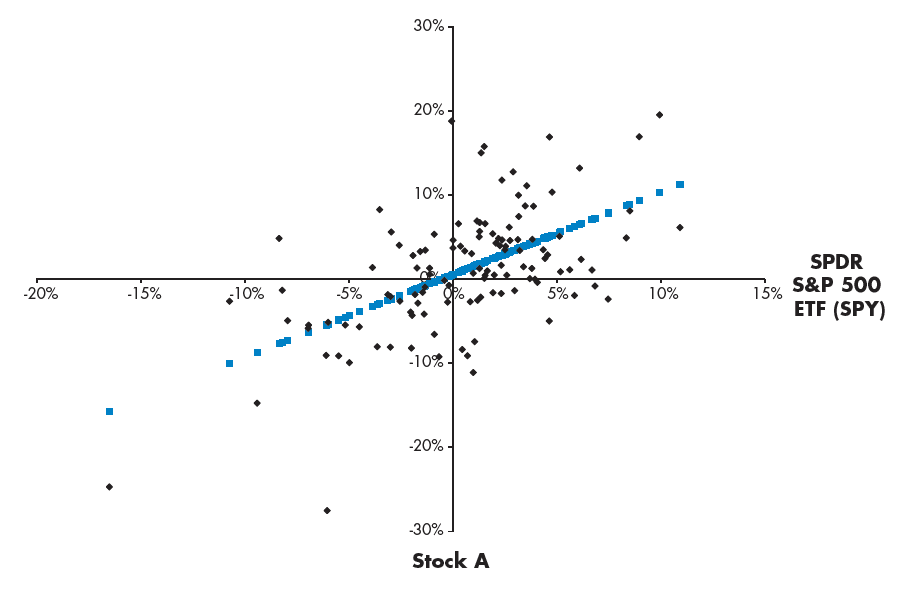
In Figure 1.3 Dispersion of Returns, the axes are mislabeled. The horizontal axis is the SPDR S&P 500 ETF (SPY) and the vertical axis is Stock A, as shown below.
Page 168
In the paragraph that begins �Going into 2014, there was $897,000 in equities��
Should read:
�Going into 2014, there was $894,000 in equities��