


John Bajkowski
is the president of AAII.
The stock market bounced back strongly to start 2019, giving investors the best two-month start to a year since 1991. Small-company stocks have been especially strong performers this year, with the Vanguard Small-Cap Index fund (NAESX) up 17.2% versus the 11.5% gain for the large-cap Vanguard 500 Index fund (VFINX). The Model Shadow Stock Portfolio was up 20.3% year to date through the end of February.
Generally, the fortunes of large-company stocks are tied more to global economic events, while small-company stocks tend to be more domestically focused. The companies that make up the S&P 500 index obtain around 40% of their revenue outside the U.S. Smaller companies also tend to be slightly weaker financially than larger companies, often exhibiting slimmer profit margins. These characteristics make them more sensitive to interest rates and economic cycles. While there are concerns over a weakening domestic economy, it still looks healthier than that of many other nations. As investor sentiment improved from very pessimistic levels at the end of 2018, shares of small-company stocks bounced back strongly.
The performance of growth- versus value-oriented stocks was mixed during the first two months of the year. Large-cap growth stocks were up 11.9% versus the 11.0% gain for large-cap value stocks, but the pattern is reversed in the mid- and small-cap segments, with mid-cap growth stocks up 14.3% compared to a gain of 16.1% for mid-cap value stocks. Small-cap value stocks were up 17.0%, while small-cap growth stocks were up 14.0% for the first two months of the year. Market capitalization is simply the number of shares a company has issued multiplied by the share price. It is a common measure of company size and represents the market consensus of a company’s worth.
Stocks in the energy (+14.0%), industrial (+18.6%) and financial (+14.6%) sectors bounced back strongly in 2019, while more defensive sectors such as consumer staples (+7.6%), health care (+6.1%) and utilities (+7.7%) are lagging the market.
Since its inception in 1993, the AAII Model Shadow Stock Portfolio has a compound annual average return of 14.8% versus the Vanguard 500 Index fund’s gain of 9.3% per year on average over the same period. Over the same period, the Vanguard Small-Cap Index fund posted an average annual gain of 10.0%.
We are listening to our members and are in the process of updating our website to add requested features and make it easier to navigate. One notable change is renaming the Model Portfolios section to Shadow Stocks. The Model Shadow Stock Portfolio can now be accessed directly from the site’s main menu as well as from the Premium Services drop-down menu. Shadow Stocks is a core AAII member benefit that helps to illustrate how individuals can translate academic research into an investable portfolio.
The Shadow Stocks area on the website will continue to present the current Model Shadow Stock Portfolio (Actual Portfolio), a listing of stocks currently meeting the strategy’s buy criteria (Passing Companies List), along with guidance on how to follow the strategy (User’s Guide and FAQs). The area will undergo a visual refresh over the next few months that should make it easier to keep abreast of the portfolio activity and news.
Whenever we begin our quarterly review, the size and valuation criteria are studied to determine if any adjustment is warranted. With the large market swings over the last several months, we were curious to see how these factors might have changed.
The primary Model Shadow Stock Portfolio selection criteria target the intersection of the smallest 10% of domestic stocks as measured by market cap along with the “cheapest” 10% of domestic stocks as measured by the price-to-book-value (P/B) ratio. These decile breakpoints are determined by examining domestic companies that are listed on the New York Stock Exchange (NYSE) and change over time.
Table 1 provides a history of the size and value maximums used to manage the Model Shadow Stock Portfolio. The initial $55 million market-cap maximum for inclusion in the Model Shadow Stock Portfolio has grown to $400 million. The price-to-book-value ratio has fluctuated as well. It was lowest during 2001 and 2002, at 0.60, and is currently at its highest level of 1.00.
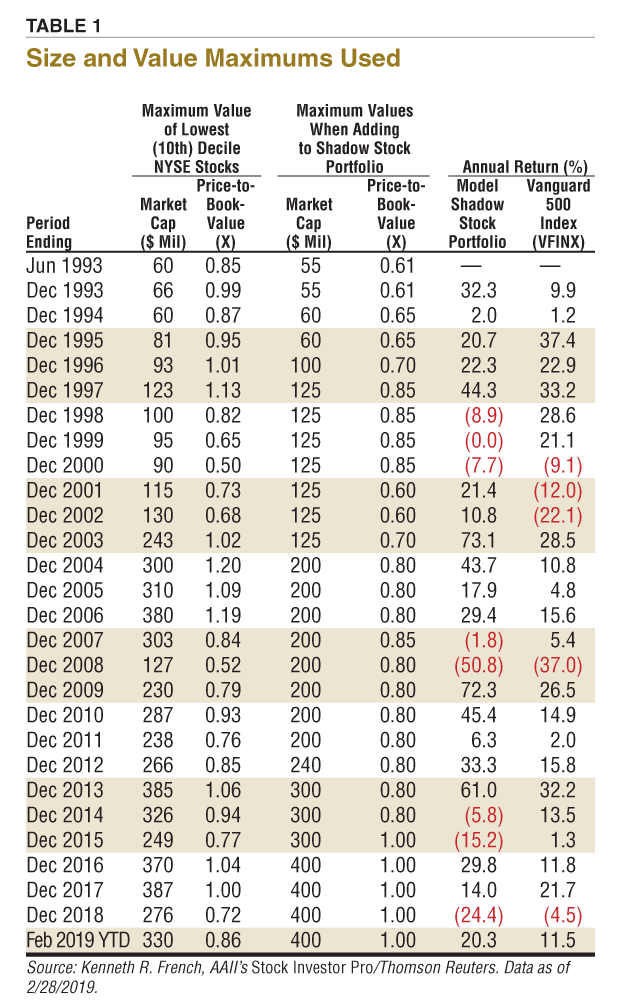 At the end of 2018, the NYSE market-cap cutoff for the lowest decile had dropped to $276 million from $387 million at the end of 2017. It stood at $330 million at the end of February. The price-to-book-value cutoff for the lowest decile had dropped to 0.72 at the end of 2018 from 1.00 at the end of 2017. It has since bounced back to 0.86 at the end of February. With the market rebound, we did not adjust the valuation or size cutoffs for the Model Shadow Stock Portfolio for our quarterly review.
The Actual Portfolio lists the stocks currently in the Model Shadow Stock Portfolio and the Transaction History page summarizes the changes made during the quarterly portfolio review.
Two stocks were sold from the portfolio after conducting the quarterly review—Aceto Corp. (ACET) and Seneca Foods Corp.(SENEA). The proceeds from these two sales, as well as the cash held in the portfolio, were not enough to invest an average position size amount in even one replacement stock.
It is the policy of the Model Shadow Stock Portfolio not to underweight or overweight new positions. Instead, we typically hold excess cash until there is enough to buy a new stock with a position size roughly equivalent to the average position size in the portfolio.
However, if you are looking for stock ideas to invest excess funds, the list of Shadow Stocks that currently qualify represent a good starting point. As of the end of February, 20 stocks met the initial selection criteria for the Model Shadow Stock Portfolio. The list of passing companies is published in the Shadow Stocks section of the AAII website in a table labeled as Passing Companies List. Five of the 20 passing companies are currently held in the Model Shadow Stock Portfolio—Beazer Homes USA Inc. (BZH), CPI Aerostructures Inc. (CVU), Flexsteel Industries Inc. (FLXS), Hallador Energy Co. (HNRG) and Universal Stainless & Alloy Products (USAP). They are designated as “qualifies as of 2/28/2019” in the notes column of the Actual Portfolio table. Note that on our website, the “currently qualifies” label for the actual Model Shadow Stock Portfolio table is revised daily and dynamically updated.
 (ACET)
Aceto filed for Chapter 11 bankruptcy protection from its creditors, leaving its equity stock worthless. The company indicated that it intended to sell its operating units under the supervision of the bankruptcy courts in New York and New Jersey. So far, Aceto has announced plans to sell its pharmaceutical ingredients and performance chemicals segments and the nutritionals portion of Aceto’s human health segment for $338,000. The sale is intended to constitute a “stalking horse” bid that is subject to higher and better bids by third parties in accordance with bidding procedures to be approved by the bankruptcy court.
This is the second time in 26 years we have had a bankruptcy in the portfolio, since companies generally get sold because of negative earnings long before they go bankrupt. Jackson Hewitt Tax Service was held in the Model Shadow Stock Portfolio when it filed for bankruptcy in 2011.
Seneca has been on earnings probation since it announced its first-quarter 2019 earnings on August 1, 2018. At that time, the company’s trailing 12-month earnings per share turned negative. On February 1, the company reported a quarterly loss—adjusted to account for discontinued operations—of $2.07 per share. If a Shadow Stock that is on earnings probation reports a subsequent quarterly loss, it is sold from the portfolio.
Stocks are sold during our quarterly review if their market capitalization goes above three times the initial maximum criterion of $400 million and there is suitable stock available for purchase. PC Connection Inc. (CNXN) and Renewable Energy Group Inc. (REGI) are approaching the market capitalization cut-off of $1.2 billion. PC Connection had month-end market cap of $1.070 billion, while Renewable Energy Group had month-end market cap of $1.003 billion.
We also look at the price-to-book-value ratio during the quarterly review and sell any companies if the ratio exceeds three times the initial price-to-book-value limit of 1.00. Currently, PCM Inc. (PCMI), with a price-to-book-value ratio of 2.76, is approaching the price-to-book-value ratio limit of 3.00.
The next quarterly review of the AAII Model Shadow Stock Portfolio will take place around the end of May 2019, after most of the Shadow Stock holdings have announced their quarterly earnings. Any changes to the portfolio will be announced at the time they are made on our website and in a special Model Portfolios Update email (sign up at www.aaii.com/email).
 Get updates about the portfolio that has outperformed the market by 211.9%
since inception!
Get updates about the portfolio that has outperformed the market by 211.9%
since inception!