The March 2019 AAII Shadow Stock Model Portfolios Update is now available online.
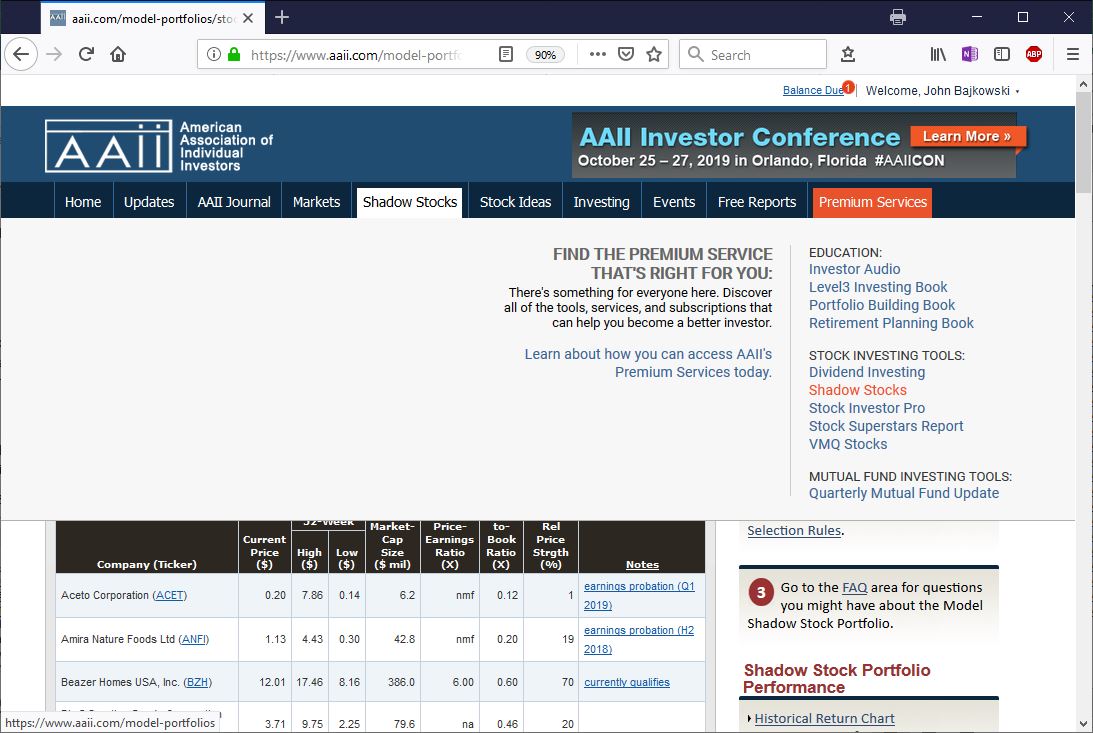
As you have likely noticed, the AAII.com website is undergoing a refresh. We are trying to make the website easier to navigate as well as add new features for our members. The Model Portfolios section has been renamed simply Shadow Stocks and it can be accessed directly from the site’s main menu as well from within the Premium Services drop-down menu. Access to the Shadow Stocks is a core AAII member benefit that illustrates how individuals can translate the conclusions of academic research into actionable portfolio construction and management. The stock selection and deletion rules as well as the portfolio maintenance rules have evolved through trial and error of running this real-world micro-cap value portfolio over the last 25+ years. The Shadow Stocks area on the website will continue to present the Model Shadow Stock Portfolio, the list of stocks currently meeting the strategy’s buy criteria along with guidance on how to follow the strategy. It will undergo a visual refresh that should make it easier to keep abreast of the portfolio activity and news.
February Performance
The Model Shadow Stock Portfolio was up 3.8% during February, boosting its 2019 two-month performance to 20.3%. By comparison, the S&P 500 index as measured through the Vanguard 500 Index fund (VFINX), was up 3.2% during February and is up 11.5% during 2019. Small-cap stocks have outperformed stock of large companies for the first two months of the year. The Vanguard Small-Cap Index fund (NAESX) was up 17.2% year to date, while the DFA U.S. Micro Cap fund (DFSCX) was up 15.7% during 2019 through the end of February.
The performance of growth versus value-oriented stocks was mixed during the first two months of the year. Large-cap growth stocks were up 11.9% versus the 11.0% gain for large-cap value stocks, but the pattern is reversed in the mid-cap segment, with mid-cap growth stocks up 14.3% compared to a gain of 16.1% for mid-cap value stocks. Stocks in the energy (+14.0%), industrial (+18.6%) and financial (+14.6%) sectors have bounced back strongly in 2019, while the more defensive sectors such as consumer staples (+7.6%), health care (+6.1%) and utilities (+7.7%) are lagging the market.
Since its inception in 1993, the AAII Model Shadow Stock Portfolio has a compound annual average return of 14.8% versus the Vanguard 500 Index fund’s (VFINX) gain of 9.3% per year on average over the same period. Over the same period, the Vanguard Small-Cap Index fund (NAESX) posted an average annual gain of 10.0%.
AAII Model Shadow Stock Portfolio Changes
After conducting the quarterly review of the Model Shadow Stock Portfolio, two stocks were removed from the portfolio. However, the proceeds from these two sales, as well as the cash held in the portfolio, were not enough to invest an average position size amount in even one replacement stock. It is the policy of the Model Shadow Stock Portfolio not to underweight or overweight new positions. Instead, it is better to hold excess cash until there is enough to buy a new stock with a position size roughly equivalent to the average position size in the portfolio.
The next quarterly review of the AAII Model Shadow Stock Portfolio will take place around the end of May 2019, after most of the Shadow Stock holdings have announced their quarterly earnings. Any changes to the portfolio will be announced at the time they are made in a special Model Portfolios Update email (sign up at www.aaii.com/email).
Sell Alerts
Aceto Corp. (ACET)
Aceto filed for Chapter 11 bankruptcy protection from its creditors. The company said it will sell its chemicals unit and Rising Pharmaceuticals unit in separate transactions, which will be supervised by bankruptcy courts in New York and New Jersey. Additional information is posted in the news section below.
Seneca Foods Corp. (SENEA)
Seneca has been on earnings probation since it announced its first-quarter 2019 earnings on August 1, 2018. At that time, the company’s trailing 12-month earnings per share turned negative. On February 1, the company reported a quarterly loss—adjusted to account for discontinued operations—of $2.07 per share. If a Shadow Stock that is on earnings probation reports a subsequent quarterly loss, it is removed from the portfolio.
Model Shadow Stock Portfolio Notes & News
As of the end of February, 20 stocks met the initial selection criteria for the Model Shadow Stock Portfolio, down from 21 at the end of January. Of these, five are currently held in the Model Shadow Stock tracking portfolio: Beazer Homes USA Inc. (BZH), CPI Aerostructures Inc. (CVU), Flexsteel Industries Inc. (FLXS), Hallador Energy Co. (HNRG) and Universal Stainless & Alloy Products (USAP). Qualifying companies are those held in the Model Shadow Stock Portfolio that currently meet the initial purchase rules. (They are designated as “qualifies” in the notes column of the Model Shadow Stock Portfolio table on AAII.com. However, the notes may not match the list here since the passing list on the website is revised daily and the notes are dynamically updated based on the revised list.)
Currently, PCM Inc. (PCMI), with a price-to-book-value ratio of 2.76, is approaching the price-to-book-value ratio limit of 3.00. Shadow Stocks with a price-to-book-value ratio above 3.00 at the time of a quarterly review are sold from the model portfolio, assuming there is a suitable replacement.
PC Connection Inc. (CNXN) and Renewable Energy Group Inc. (REGI) are approaching the market capitalization cut-off of $1.2 billion. PC Connection had month-end market cap of $1.070 billion, while Renewable Energy Group had month-end market cap of $1.003 billion. Shadow Stocks with a market cap above $1.2 billion at the time of a quarterly review are sold from the model portfolio, assuming there is a suitable replacement.
PCM Inc. had the strongest monthly price gain in the Model Shadow Stock Portfolio with its 57.3% gain during February. As noted in the news section below, PCM Inc. reported earnings that beat the market consensus during the month.
With its bankruptcy filing, Aceto was the weakest holding during February, down 81.0% during the month. Aceto was one of the smallest portfolio holdings so its decline was muted by the overall portfolio diversification.
Click here to see the current purchase and sell rules for the portfolio. The size and value rules are subject to revision depending on prevailing market conditions.
The next quarterly review of the Model Shadow Stock Portfolio will take place at the end of May 2019. Any changes to the portfolio will be announced at the time they are made in a special Model Portfolios Update email (sign up at www.aaii.com/email).
Here are some news highlights from February for the holdings in the AAII Model Shadow Stock Portfolio:
Aceto Corp. (ACET) announced that it has filed for Chapter 11 bankruptcy, with plans to sell substantially all of its assets. So far, Aceto has announced plans to sell its pharmaceutical ingredients and performance chemicals segments and the nutritionals portion of Aceto’s human health segment for $338,000. The sale is intended to constitute a “stalking horse” bid that is subject to higher and better bids by third parties in accordance with bidding procedures to be approved by the bankruptcy court.
Beazer Homes USA Inc. (BZH) reported net income of $7.3 million, or $0.23 per diluted share, for the first quarter of 2019, compared to a net loss of $130.9 million, or $4.07 in the same period one year ago. Excluding the loss on debt extinguishment, inventory impairments and abandonments and remeasurement of deferred tax assets due to the 2017 federal tax reform, net income rose 189% to $8.3 million in the first quarter 2019 from net income of $2.8 million in first-quarter 2018. New home sales were down 12% year over year to 976 for the quarter, and CEO Allan Merrill noted that conditions in the housing market “weakened substantially” during the final months of the calendar year. Beazer Homes’ adjusted earnings per share (EPS) of $0.09 missed the I/B/E/S analyst consensus estimate of $0.144.
Big 5 Sporting Goods Corp. (BGFV) reported that net sales for the fourth quarter of 2018 were $247.1 million compared to net sales of $242.9 million for the same quarter a year prior. Same-store sales increased 1.1% for the fourth quarter of fiscal 2018. Net loss for the fourth quarter of fiscal 2018 was $5.1 million, or $0.24 per share, which includes aftertax charges of $1.4 million for asset impairment and contract termination costs and $0.3 million for a deferred tax valuation allowance for certain income tax credits, or $0.08 per share. Big 5 Sporting Goods’ adjusted loss per share was in line with the I/B/E/S analyst consensus estimate of $0.16.
For the fiscal-2019 first quarter, Big 5 Sporting Goods expects same-store sales to increase in the mid-single-digit range and diluted earnings per share to be in the range of $0.04 to $0.10, compared to a same-store sales decrease of 7.5% and a loss per share of $0.06 in the first quarter of fiscal 2018.
Container Store Group Inc. (TCS) reported that third-quarter 2018 consolidated net sales of $221.6 million were down 0.6% year over year, with comparable-store sales for the third quarter of fiscal 2018 down 0.8% compared to the third quarter last year. Net income was $9.3 million, or $0.19 per share, in the third quarter of fiscal 2018 down 67% compared to net income of $28.4 million, or $0.59 per share, in the third quarter of fiscal 2017. Adjusted net income was $3.5 million, or $0.07 per share, in the third quarter of fiscal 2018 compared to adjusted net income of $5.1 million, or $0.11 per share, in the third quarter of fiscal 2017. Adjusted earnings per share missed the I/B/E/S analyst consensus estimate of $0.12 by 41.7%.
CPI Aerostructures Inc. (CVU) was awarded a multi-year contract to produce assemblies for the F-16V. Deliveries are expected to begin during the fourth quarter of 2019 and continue through 2024. An initial multi-million-dollar purchase order under the long-term contract is anticipated within the next several weeks.
CPI Aerostructures also received a contract valued at $8.1 million from Northrop Grumman Corp. (NOC) for outer wing panel kits used in the manufacture of complete wings for the E-2D Advanced Hawkeye. CPI Aerostructures has produced outer wing panel kits since 2008 for the E-2D Advanced Hawkeye, the U.S. Navy’s carrier-based airborne early warning and control aircraft.
CSS Industries Inc. (CSS) reported that net sales of $133.2 million for the third quarter of 2019 increased 2% compared to net sales of $130.6 million in the same period one year ago. Net loss was $6.8 million in the quarter compared to net income of $6.0 million in the prior-year quarter. Third-quarter 2019 adjusted net income was $6.5 million, down 43% compared to adjusted net income of $11.3 million in the prior-year quarter. The diluted net loss per share was $0.77 compared to diluted net income per share of $0.65 in the prior-year quarter. CSS Industries’ adjusted earnings per share of $0.74 missed the I/B/E/S analyst consensus estimate of $1.61 by 54%.
Delta Apparel Inc. (DLA) reported net sales of $101.7 million for the first quarter of 2019, up 12.5% from $90.3 million in the first quarter of 2018. Delta Apparel reported a net loss for the quarter of $1.1 million, or $0.17 per diluted share, which was up compared to first-quarter 2017’s net loss of $10 million, or $1.37 per diluted share. Adjusted earnings per share were $0.14, up 75% from adjusted earnings per share of $0.08 in the same period one year ago. Delta Apparel’s adjusted earnings per share beat the I/B/E/S analyst consensus estimate of $0.08.
Ducommun Incorporated (DCO) reported revenue of $164.2 million for the fourth quarter of 2018, up 15.4% from $142.3 million. Net income for the fourth quarter of 2018 was $0.7 million, or $0.06 per diluted share, down about 93% compared to $9.5 million, or $0.82 per diluted share, for the fourth quarter of 2017. The year-over-year decrease was due to a tax benefit of $14.5 million in the prior-year period as a result of the 2017 federal tax reform. Adjusted net income for the quarter was $5.2 million, or $0.44 per diluted share, up year over year 13% and 10%, respectively, from adjusted net income of $4.6 million, or $0.40 per diluted share.
Flexsteel Industries Inc. (FLXS) reported that second-quarter 2019 net sales were $118.4 million compared to record net sales of $129.4 million in the prior-year quarter, a decrease of 8.5%. Higher second-quarter contract net sales were primarily driven by double-digit increased volume in recreational vehicle and health care products offset by the delivery timing of hospitality products and the previously disclosed plan to decrease sales to certain commercial office product customers.
Net income for the second quarter was $1.6 million, or $0.20 per diluted share, down 74% compared to net income of $6.2 million, or $0.78 per diluted share, in the same period one year ago. For both the quarter and the six-month period compared to 2018, lower residential net sales were primarily driven by decreased unit volume in residential e-commerce product, followed by lower unit volume in home furnishings products.
Kimball Electronics Inc. (KE) reported second-quarter 2019 sales of $284, up 10% year over year from net sales of $258 million. Net income in the second quarter of fiscal-year 2019 came in at $7.1 million, or $0.27 per diluted share, which compares to a loss of $8.3 million in the second quarter of fiscal-year 2018, or $0.31 per diluted share. Adjusted net income was $6.9 million, or $0.26 per diluted share in the current-year second quarter, which compares to $8.2 million, or $0.31 per diluted share, in the prior-year second quarter after excluding the provision adjustments related to tax reform.
New Home Company Inc. (NWHM) reported that total revenue for the 2018 fourth quarter was $229.7 million, compared to $324.1 million in the prior-year period. New Home Company recorded a net loss of $16.2 million, or $0.80 per diluted share, compared to net income of $10.5 million, or $0.50 per diluted share, in the prior-year period. The year-over-year decrease in net income was primarily attributable to a $29.1 million increase in inventory and joint venture impairments and a 33% decrease in home sales revenue. Adjusted net income was $5.6 million, or $0.28 per share, missing the I/B/E/S analyst consensus earnings estimate of $0.459 by 39%.
Looking at the first quarter of 2019, New Home Company is estimating home sales revenue of between $80 million and $90 million, fee building revenue of between $20 million and $30 million and home sales gross margin of between 12.6% and 13.0%.
Olympus Steel Inc. (ZEUS) reported record fourth-quarter sales of $430 million in 2018, up 39% from $308 million in sales during the fourth quarter of 2017. CEO Rick Marabito said, “We achieved these record results, despite the market softening in the last quarter.” Olympus Steel reported a net loss of $1.3 million, or $0.11 per share, for the quarter, compared to net income of $4.2 million, or $0.37 per share, in the same period one year ago. Adjusted earnings per share improved to $0.14 in the fourth quarter of 2018, up compared to an adjusted net loss per share of $0.04 in 2017’s fourth quarter. Olympus Steel’s net loss of $0.11 per share missed the I/B/E/S analyst consensus estimate for earnings per share of $0.19.
PC Connection Inc. (CNXN) reported fourth-quarter 2018 net sales of $709.5 million. Net sales before the impact of the new revenue recognition standard for the quarter increased by 7.3% to $817.6 million, compared to $762.3 million for the prior-year fourth quarter. Net income for the fourth quarter of 2018 increased by 2.8% to $21.3 million, or $0.80 per diluted share, compared to net income of $20.7 million, or $0.77 per diluted share for the prior-year fourth quarter. Fourth-quarter 2017 benefited from a $7.8 million tax benefit resulting from the 2017 federal tax reform. PC Connection’s diluted earnings per share of $0.80 beat the I/B/E/S analyst consensus estimate of $0.627 by 27.3%.
PCM Inc. (PCMI) reported revenue of $564.1 million for the fourth quarter of 2018, up 4% year over year from revenue of $544.8 million. Net income for the quarter was $6.1 million, or $0.48 per diluted share, up from fourth-quarter 2017’s net loss of $3.2 million, or $0.27 per diluted share. Adjusted earnings per share of $0.57 beat the I/B/E/S analyst consensus estimate of $0.47.
Looking forward, PCM Inc. expects gross profit growth in the mid-single digits over 2018 on low-single-digit sales growth. Adjusted earnings per share is expected in the range of $2.55 per share to $2.75 per share. PCM Inc. said that the first quarter is seasonally lowest in terms of sales and profitability, but the company expects growth in sales and gross profit to accelerate throughout the course of the year.
RCI Hospitality Holdings (RICK) reported that first-quarter 2019 revenue rose 7% year over year to $44 million, with an increase of 4.3% in same-store sales. Net income for the quarter was $6.4 million, or $0.65 per diluted share, down 55% year over year from net income of $14.4 million, or $1.47 per diluted share. First-quarter 2017 benefited from $9.7 million in deferred tax credit as a result of federal tax reform. Adjusted diluted earnings per share of $0.61 per share for the first quarter were $0.61, which beat the I/B/E/S analyst consensus estimate of $0.47 by 29.8%.
Rocky Brands Inc. (RCKY) reported that fourth-quarter net sales were $67.2 million, about flat with net sales of $67.0 million in the fourth quarter of 2017. CEO Jason Brooks said, “Our fourth-quarter sales performance was fueled by mid-teens growth of our retail segment as our Lehigh CustomFit program continues to gain traction with existing and new accounts.” Rocky Brands reported fourth-quarter net income of $3.6 million, or $0.48 per diluted share, compared to $4.4 million, or $0.59 per diluted share in the year-ago period. Rocky Brands’ earnings per share beat the I/B/E/S analyst consensus estimate of $0.44 by 9%.
Vishay Precision Group Inc. (VPG) reported growth in fourth-quarter 2018 revenue of 10.9% year over year to $77 million. Fourth-quarter net income was $3.4 million, or $0.25 per diluted share, down 24% from net income of $4.5 million, or $0.33 per diluted share, in the same period one year ago. Adjusted net income increased 38% to $7.3 million, or $0.54 per diluted share, compared to adjusted net income of $5.3 million, or $0.39 per diluted share, in fourth-quarter 2017. Vishay’s adjusted earnings per share of $0.54 beat the I/B/E/S analyst consensus estimate of $0.535.
Looking forward, CEO Ziv Shoshani said, “In light of a continued stable business environment, at constant fourth-fiscal-quarter 2018 exchange rates, we expect net revenues in the range of $72 million to $78 million for the first fiscal quarter of 2019.”
VSE Corp. (VSEC) reported that revenue for the fourth quarter of 2018 was $181 million, down 7% year over year from revenue of $194.8 million. CEO Maurice Gauthier said that lower revenues in 2018 were due to a reduction of work in the company’s Federal Services Group. Net income was $9.2 million, or $0.84 per diluted share, in the fourth quarter of 2018 compared to $17.4 million, or $1.59 per diluted share in the fourth quarter of 2017. Adjusted earnings before interest, taxes, depreciation and amortization (EBITDA) was $19.9 million for the fourth quarter of 2018 and $78.3 million for 2018, compared to $19.2 million for the fourth quarter of 2017 and $80.2 million for 2017.
 Get updates about the portfolio that has outperformed the market by 211.9%
since inception!
Get updates about the portfolio that has outperformed the market by 211.9%
since inception!

