Due to the evolving COVID-19 (coronavirus) pandemic, we have canceled all Local Chapter, SIG and IEG meetings. (At this time, we are still going ahead with plans for the 2020 AAII Investor Conference in Las Vegas in early October, pending how the pandemic evolves.) The AAII staff is working remotely to ensure our publications and enewsletters continue to go out and our website is updated regularly. Should you need to reach us with any questions, please contact us by email.
In our February Model Shadow Stock Update, we asked if the COVID-19 (the coronavirus) outbreak could be the “shock to the system” that comes out of nowhere and ends up harming the long-running economic expansion. Less than a month later, we have a clear answer to our question.
The S&P 500 index has fallen over 25% from its February peak, marking an end to the record long bull market. The sudden and sharp market decline comes as investors come to grips with the disruption that the coronavirus will have not only on the global economy but on everyone’s day-to-day lives.
The strength of the S&P 500 during 2019 however masked the weakness of many stocks since the fourth quarter of 2018. While the large-cap S&P 500 Index gained 31.3% during 2019, the average exchange-listed stocks gained 14.8% during 2019.
The Model Shadow Stock Portfolio gained 19.6% during 2019, but that was not enough to overcome the 28.5% loss in the last four months of 2018. The Shadow Stock Portfolio has been in a bear market since the end of August in 2018.
Historically speaking, bear market lengths are shorter than bull market runs. The stock market crash of 1929 resulted in a bear market that lasted 2.7 years. The collapse of the Bretton Woods system and associated bear market of 1973 to 1974 resulted in a 48.2% loss over 1.7 years. The bear market associated with the collapse of the dotcom bubble in 2000 lasted about two and a half years. The bear market from the financial crisis of 2008 saw stocks lose 56.8% over the course of one year and five months. On average, bear markets over the last one-hundred years have averaged 1.6 years in length and have resulted in an average loss of 38.9%. Stock market bull runs have averaged 5.2 years with an average gain of 182.7%.
Over the last two and a half months, the Model Shadow Stock Portfolio has declined 48.1%. In contrast, the S&P 500 as measured through the Vanguard 500 Index fund (VFINX) is down 21.4%, while the Vanguard Small Cap Index fund (NAESX) is down 32.7% year-to-date through March 17, 2020.
We examined the monthly total returns of the Model Shadow Stock Portfolio along with the Vanguard 500 Index fund to gain a sense of the frequency, duration and severity of corrections and bear markets over its 27-year history.
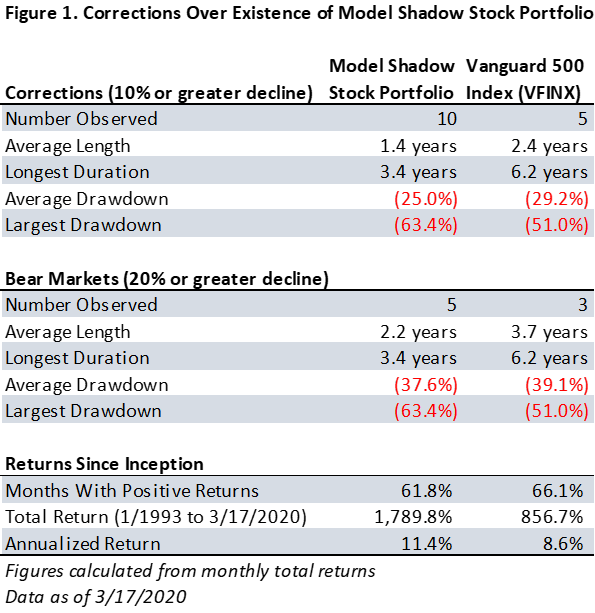
The Model Shadow Stock Portfolio has a cumulative total return of 1,789.8% (11.4% annualized) over its history, compared to the cumulative total return of 856.7% (8.6% annualized) for the Vanguard 500 Index fund. However, the greater long-term observed return has come with greater short-term volatility. On average, the Model Shadow Stock Portfolio has been up 61.8% of individual months during its existence. This means that it has had negative months in approximately four out of 10 months. In contrast, the Vanguard 500 Index fund has had positive monthly returns 66.1% of the time, or down months 33.9% of the time over the same time period.
Corrections are generally classified as declines of 10% or greater. The Model Shadow Stock Portfolio has had 10 observed corrections, and five of them have turned into bear markets of 20% or greater. The average correction has been 1.4 years in length, with an average drawdown of 25.0%. The drawdown is the maximum loss sustained during a given downturn. The duration is the time it takes the portfolio to return to its level just before the downturn began, not just when the market starts to turn up. The longest correction (July 2007 to November 2010) was 3.4 years and had a drawdown of 63.4%.
The Vanguard 500 Index fund has had five observed corrections and three of them have gone on to become bear markets of 20% or greater over the same time period. The average correction has been 2.4 years in length with an average drawdown of 29.2%. The longest correction (September 2000 to October 2006) was 6.2 years with a drawdown of 44.8%, but the greatest drawdown of 51.0% was with the 2007 bear market that lasted 4.8 years (November 2007 to July 2012).
The Model Shadow Stock Portfolio has had more frequent corrections and bear market cycles than the S&P 500, but the down periods have generally been shorter in duration and bull market reversals stronger.
If you are tempted to time the market, we suggest that you consider the issues raised in our May 2018 Model Portfolios article titled “Model Shadow Stock Portfolio: Staying Invested All 12 Months.” The article examines the impact on your returns if you should miss one month during the year in the which the market has its best return. Market movements are often very sudden and strong both to the upside and downside. The biggest market up days are often clustered near the biggest market down days.
Model Shadow Stock Portfolio News
As of March 17, 2020, 49 stocks met the initial selection criteria for the Model Shadow Stock Portfolio, up from 20 at the end of January. Of these, 10 are currently held in the Model Shadow Stock tracking portfolio: Cumulus Media Inc. (CMLS), Delta Apparel Inc. (DLA), Hibbett Sports Inc. (HIBB), Hooker Furniture Corp. (HOFT), Perion Network Ltd. (PERI), RCI Hospitality Holdings Inc. (RICK), Rocky Brands Inc. (RCKY), Universal Stainless & Alloy (USAP) and VSE Corp. (VSEC). Qualifying companies are those held in the Model Shadow Stock Portfolio that currently meet the initial purchase rules. (They are designated as “qualifies” in the notes column of the Model Shadow Stock Portfolio table on AAII.com. However, the notes may not match the list here since the passing list on the website is revised daily and the notes are dynamically updated based on the revised list.)
Currently, none of the holdings in the Model Shadow Stock Portfolio are approaching the price-to-book valuation limit of 2.7 or the market cap cut-off of $900 million.
With tremendous market volatility, we held off our quarterly review at the end of February. We are reviewing the market capitalization and value limits used select and remove stocks in the AAII Model Shadow Stock Portfolio. Any changes to the portfolio will be announced at the time they are made in a special Model Shadow Stock Portfolio Update email (sign up at www.aaii.com/email).
Here are some news highlights from February for the holdings in the Model Shadow Stock Portfolio:
Big 5 Sporting Goods Corp. (BGFV) reported diluted earnings per share of $0.02 for the fourth quarter of 2019, compared to a loss of $0.24 per share for the same period one year ago. Excluding an aftertax impairment charge of $0.3 million, diluted earnings per share were $0.04 for the quarter.
Net sales for the fourth quarter of 2019 were $244.1 million, down about 1% year over year. Same-store sales decreased by 0.6% over the same period. The company opened one store and relocated one store during the quarter, ending the year with 434 stores in operation.
Big 5 Sporting Goods said results for the quarter were driven by its focus on managing expenses and merchandise selection. Pricing and promotional strategies also contributed to a notable expansion of merchandise margins over the back half of the year.
At the time of Big 5 Sporting Goods’ fourth-quarter report, the company said its first-quarter 2020 sales results are expected to roughly meet those of 2019 as the company transitions to spring merchandise. During the first quarter of 2020, Big 5 Sporting Goods expects to close three stores and does not expect to open any new stores. For the full year, the company anticipates opening about five new stores and closing about five stores.
Container Store Group Inc. (TCS) reported earnings per share of $0.05 for the third quarter of 2019, compared to earnings per share of $0.19 in the same period one year ago. Earnings per share also missed the I/B/E/S consensus estimate of $0.053 by about 5.7%.
Consolidated net sales were $228.7 million, up by 3.2% year over year. The custom closets product category saw sales increase by 10.2% year over year, while all other product categories were down about 2%. The decline in other product categories was driven by an expected decrease in sales from the holiday department. Custom closets accounted for about half of the company’s sales.
At the time of its third-quarter report, Container Store Group said it was maintaining its outlook for the year. The company expects fiscal-2019 consolidated sales of around $915 million and same-store sales of around $925 million, up 2% to 3%, respectively. Earnings per share are expected to be toward the low end of the previous guidance of $0.41 to $0.51.
Covenant Transportation Group (CVTI) announced a share repurchase program of up to $20 million of the company’s Class A common stock. The company did not place a time limit on the program.
CPI Aerostructures Inc. (CVU) announced that its subsidiary Welding Metallurgy Inc. has been awarded purchase orders totaling $4 million from the Northrop Grumman Corp. (NOC) for welded structure and tube assemblies for the E-2D Advanced Hawkeye aircraft. Under the terms of the purchase orders, Welding Metallurgy will manufacture more than 140 different items in support of the production of at least 25 E-2D aircraft. The period of performance is expected to be through 2022 with first deliveries commencing in early 2020.
Separately, CPI Aerostructures announced that its financial statements from 2018 and the first three quarters of 2019 contain an error relating to the company’s recognition of revenue from customer contracts. In preparing its annual financial statement for 2019, the company said it concluded that certain revenues and net income were recognized prematurely, thus overstated.
CPI Aerostructures has not yet fully completed its review. However, it expects to amend its annual report on its Form 10-K for 2018 and that year’s quarterly reports on its Form 10-Qs, in addition to the first three quarters of 2019. CPI Aerostructures expects a financial impact from the error, but it cannot predict the outcome of its refiling.
The company said that it reviewed its financial closing process and believes it identified the corrective action to remediate the cause of the error. Plans to remediate the error will be announced later.
Cumulus Media Inc. (CMLS) reported net income of $0.08 per diluted share for the fourth quarter of 2019, compared to earnings per diluted share of $2.18 in the same period one year ago. Adjusted earnings per share of $0.69 beat the I/B/E/S consensus estimate by about 44%.
Net revenue of $285.5 million decreased by 7.7% year over year. Same-station net revenue, excluding the impact of political spending, was down by 1.7% to $282.4 million. Political revenue was $3.1 million as compared to $11.3 million in the fourth quarter of 2018.
At the time of its earnings report call with analysts, Cumulus Media was expecting first-quarter 2020 revenue, including political spending, to be between $255.0 million and $255.1 million, with $39.8 million for total earnings before interest, taxes, depreciation and amortization (EBITDA).
Delta Apparel Inc. (DLA) reported net income of $0.13 per diluted share for the first quarter of 2020, which compared year over year to a loss of $0.17 per share in the same period one year ago. Earnings per diluted share for the quarter beat the I/B/E/S consensus estimate by 52.9%.
Net sales were $95.9 million, down 5.7% from the prior year’s first quarter. Net sales in the Delta group segment and Salt Life group segment decreased by 5.8% and 4.7%, respectively.
At the time of its earnings report call with analysts, Delta Apparel was expecting gross margin improvement both sequentially and year over year in each of its quarters for 2020, which the company expected to result in strong profitability improvement as the year progressed.
Ducommun Incorporated (DCO) reported net income of $0.75 per diluted share for the fourth quarter of 2019, compared to earnings per diluted share of $0.06 in the same period one year ago. Earnings per diluted share for the quarter beat the I/B/E/S consensus estimate by about 16%. The year-over-year increase was due to higher gross profit of $7.4 million as a result of higher revenue and improved operating performance, and lower restructuring charges of $3.8 million.
Net revenue for the fourth quarter of 2019 was $186.9 million, a 13.9% increase year over year. The increase was primarily due to higher revenue from the company’s military and space end-use markets, which was itself due to higher demand for Ducommun’s various military fixed-wing aircraft platforms and other military and space platforms. Ducommun also reported higher revenue from its commercial aerospace end-use markets because of higher demand for large aircraft platforms.
At the time of its earnings report call with analysts, Ducommun said it was seeing a strong backlog for 2020 in defense business and growing business with Airbus and with Raytheon helping to offset the 2019 revenue headwind of halted 737 MAX production.
Kimball Electronics Inc. (KE) reported earnings per share of $0.26 for the second quarter of 2020, down year over year by about 4%. Adjusted earnings per diluted share were flat year over year at $0.26.
Net sales were $307 million, up 8% year over year. Automotive net sales for the quarter increased 20% year over year to $134.9 million, while medical net sales were flat year over year at $85.7 million and industrial net sales were up by about 7% to $66.4 million year over year.
Favorably impacting consolidated net sales by 2% for the quarter was the acceleration of revenue for certain contracts with customers, which began to meet the criteria to recognize revenue during the current quarter. Foreign exchange rates partially offset the positive impact of the transition in revenue by about 1%.
Mesa Air Group (MESA) reported net income of $0.31 per diluted share for the first quarter of 2020, down by 42.5% year over year. Earnings per diluted share for the quarter met the I/B/E/S consensus estimate of $0.307.
Operationally, Mesa Air ran a 99.8% controllable completion factor compared to 99.5% in the first quarter of 2019. Mesa Air operated 115,562 block hours during the first quarter of 2020, an increase of 0.5% year over year.
At the time of the release of its first-quarter financial results, Mesa Air was expecting total operating block hours of between 452,000 and 459,000 for 2020, with expected maintenance expenses of between $48.8 million and $57.8 million.
New Home Company Inc. (NWHM) reported a net loss of $0.15 per diluted share for the fourth quarter of 2019, compared to a net loss of $0.80 per diluted share in the same period one year ago. Adjusted net income of $0.15 per diluted share decreased by about 46% year over year but beat the I/B/E/S consensus estimate by 36%.
Total revenues for the fourth quarter were $222.1 million, compared to $229.7 million in the prior-year period. Home sales revenue of $173.9 million was down by 7% year over year. The decrease in home sales revenue was driven by a 13% decline in average selling price to $870,000 from $1.0 million for the 2018 fourth quarter.
At the time of New Home Company’s earnings report release, the company was expecting home sales revenue of $75 million to $90 million for the first quarter of 2020, in addition to fee-building revenue of $20 million to $30 million and homes sales gross margin of 11.8% to 12.1%.
Olympus Steel Inc. (ZEUS) reported a net loss of $0.08 per diluted share for the fourth quarter of 2019, which represents a year-over-year improvement from a net loss of $0.11 per diluted share. The loss per share for the quarter beat the I/B/E/S consensus estimate for a loss per share of $0.207 per share by 61.4%.
Consolidated net sales for the fourth quarter totaled $320 million, down from $430 million in last year’s fourth quarter. Softness in end-user demand, including the impact of the General Motors Co. (GM) strike and falling carbon steel prices, continued to have a significant impact on our overall results in the quarter. Olympus Steel said it continues to work toward further diversification of its business.
Also, Olympus Steel announced a regular quarterly dividend of $0.02 per share, in line with the previous declaration. The dividend is payable on March 16 to shareholders of record as of March 2.
Perion Network Ltd. (PERI) announced the acquisition of Content IQ for up to a total potential consideration of $73 million. Content IQ has developed a digital publishing management system using proprietary algorithms to optimize operations.
Perion Network announced a 16% year-over-year increase to earnings per share of $0.22 for the fourth quarter of 2019. Earnings per share beat the I/B/E/S consensus estimate by 31.7%.
Revenues increased by 8.7% to $78.3 million in the fourth quarter of 2019. This increase was primarily a result of a 49.3% increase in the revenue category of ad search and “other” as a result of adding new publishers, higher revenue per unit and an increased number of searches. Advertising revenues decreased by 29.1% as a result of the transition from selling formats to an integrated solution.
At the time of the release of its fourth-quarter earnings report, Perion Network expected to generate adjusted EBITDA of $38 million to $40 million for the full year of 2020, including the acquisition of business from Content IQ.
RCI Hospitality Holdings (RICK) reported a decrease of about 8% in diluted earnings per share to $0.60 for the first quarter of 2020. Adjusted diluted earnings per share of $0.62 improved by about 2% year over year but missed the I/B/E/S consensus estimate by 3.1%.
Total revenues of $48.4 million increased by 10% year over year. The growth reflected increases of 13.3% in alcoholic beverages, 30.9% in food and 11.8% in the “other” category. Service revenues declined by 0.8%. Beverage and food reflected strong sales at Bombshells locations. Service reflected one fewer holiday sales week for clubs.
At the time of its first-quarter earnings call with analysts, RCI Hospitality said it was not seeing an impact from the COVID-19 (coronavirus) outbreak.
Separately, RCI Hospitality announced new authorization to buy back an additional $10 million of common stock, bringing its total available funds to about $14.8 million. In the last five years, RCI Hospitality said it has spent about $20 million buying back shares, including $6.4 million in the first quarter of 2020.
RCI Hospitality declared its annual quarterly dividend of $0.14 per share, representing an increase of 7.7% over the previous annual payment. The company will pay out the annual dividend in two quarterly payments of $0.03 per share and two quarterly payments of $0.04 per share, the first of which was a $0.03 per share dividend declared in the first quarter of fiscal 2020. The next dividend of $0.04 per share is payable on March 25 to shareholders of record as of March 10.
RCI Hospitality was also able to refile its financial statements for the 2019 fourth quarter and full year during February. The company reported diluted earnings per share of $0.05, compared to a loss per share of $0.36 per share in the fourth quarter of 2018. Adjusted earnings per share of $0.48 improved year over year from $0.41 per share. Total revenue of $45.2 million improved from $40.7 million over the same period.
Rocky Brands Inc. (RCKY) reported a year-over-year increase of 41% in earnings per share to $0.68 for the fourth quarter of 2019. Earnings per share surpassed analysts’ expectations by $0.21. Net sales increased 12% year over year to $75.3 million. Wholesale sales increased 7% to $49.3 million and retail sales increased 26% to $20.8 million. Military segment sales increased 10% to $5.3 million.
In terms of e-commerce, Rocky Brands said it continues to see increased traffic and conversion of customers online as a result of its brand awareness marketing and improved shopping experience. The company also gained seller-fulfilled Amazon Prime status at the end of the third quarter of 2019, which boosted direct-to-consumer sales during the holiday season.
At the time of the release of its earnings report, Rocky Brands anticipated 2020 annual revenue to increase in the low-single-digit range over 2019 levels, led by retail and then wholesale. Military sales were expected to be down about $4 million. Rocky Brands said it expected some sales impact from the coronavirus outbreak due to delays at the company’s Chinese manufacturing partners, in addition to possible issues with congested shipping traffic.
Rocky Brands also declared a regular quarterly dividend of $0.14 per share, in line with the previous declaration. The dividend is payable on March 16 to shareholders of record as of March 2.
Strattec Security Corp. (STRT) declared a regular quarterly dividend of $0.14, in line with the previous declaration. The dividend is payable on March 27 to shareholders of record as of March 13.
Vishay Precision Group Inc. (VPG) reported earnings per diluted share of $0.28 for the fourth quarter of 2019, up year over year by 12%. Adjusted earnings per share of $0.27 were down 50% year over year and missed the I/B/E/S consensus estimate by 10%.
Revenues of $69.1 million for the quarter declined by 10.2% year over year. Total orders improved by 24% from the third quarter of 2019 to $79.8 million, reflecting growth across all three of the company’s segments. Vishay Precision Group said revenues met the higher end of its guidance despite its end markets being affected by the global economic slowdown in the second half of 2019.
At the time of the company’s release of its earnings report, it expected net revenues in the range of $63 million to $70 million for the first fiscal quarter of 2020, which excluded any potential impact of the coronavirus outbreak.
VSE Corp. (VSEC) reported that earnings per diluted share of $0.90 increased by 7.1% year over year for the fourth quarter of 2019. Net income increased by 8.1% over the same period. Total revenues increased 7.9% to $195.3 million.
During the fourth quarter, revenue growth in the aviation and supply chain management segment offset a decline in revenue from the federal services segment. Aviation group revenue increased more than 54% on a year-over-year basis due to contributions from the 1st Choice Aerospace acquisition, completed in January 2019, and increased organically by more than 11%. The federal services segment’s revenue declined 7% year over year due to an expected decline in demand for services on a U.S. Navy program.
At the time of the company’s release of its earnings report, VSE Corp. said that it expected to outline a multi-year strategic plan when the company reports results from the first quarter of 2020.
 Get updates about the portfolio that has outperformed the market by 211.9%
since inception!
Get updates about the portfolio that has outperformed the market by 211.9%
since inception!

