

John Bajkowski
is the president of AAII.
 BSET
BZH
CVLG
GSL
HURC
KE
KTCC
NAESX
PANL
PERI
RYAM
STRT
TITN
VFINX
BSET
BZH
CVLG
GSL
HURC
KE
KTCC
NAESX
PANL
PERI
RYAM
STRT
TITN
VFINX
Rising Inflation, continued supply constraints, concerns over high valuations and the threat of a new Russian invasion introduced a wave of market volatility and put pressure on stock market returns for the year. The S&P 500 index finished January 5.9% below its all-time high, after being down as much as 11.4% during the month. That 11.4% correction during January surpassed the worst monthly decline of 9.9% observed during 2009. Notably, the S&P 500 managed to gain 23.5% during 2009.
Smaller companies witnessed weaker performance during January. The S&P 500 had a total-return loss of 5.2% during the month, while the S&P MidCap 400 index lost 7.2% and the small cap Russell 2000 index was 9.6% in the red for the month. The Model Shadow Stock Portfolio suffered a 4.9% loss during January.
Value held up better than growth during the month. In the large-cap segment, growth stocks were down 8.4% for the month, while large-cap value stocks were down 1.6% during January.
In the mid-cap segment, growth stocks were down 10.4% during January, while mid-cap value stocks were down only 4.0% during the month.
Small-cap growth stocks gave up 13.4% during January while small-cap value stocks were down 5.8%.
Overall, smaller companies suffered larger losses during the market correction than larger firms, but value-focused stocks held up better than higher priced growth stocks.
Energy was the strongest-performing sector during January, up 18.8% for the month while consumer discretionary was the weakest sector with a loss of 9.5%. Energy continued to benefit from high oil prices and ongoing supply constraints. The consumer discretionary sector was impacted by ongoing supply constraints, inflationary pressures on margins and the risk of declining demand for goods and services that by their very nature are not required by consumers. Other better-performing sectors during the month included financials (up 0.1%), consumer staples (down 1.4%) and utilities (down 3.3%). Beyond consumer discretionary, the weakest sector performance during the month included real estate (down 8.5%), materials (down 6.8%) and health care (down 6.8%).
Since its inception in 1993, the AAII Model Shadow Stock Portfolio has a compound annual average return of 14.7% versus the Vanguard 500 Index fund’s  (VFINX) gain of 10.4% per year on average over the same period. The Vanguard Small Cap Index’s (NAESX) had an average annual total-return gain of 10.2% over the same period.
James O’Shaughnessy provides a long-term perspective on the market in his 2006 book “Predicting the Markets of Tomorrow: A Contrarian Investment Strategy for the Next Twenty Years.” O’Shaughnessy notes that investors often rely on recent market observations to drive current decisions and allocations. Chasing last year’s winning stocks, funds or sectors only to see a reversal in fortune. To help guard against these behavioral flaws investors can take a longer-term perspective on market trends. By chasing short-term market trends, we risk giving up the some of the long-term returns that the stock market has provided patient market participants. O’Shaughnessy’s work points to the benefit of using a 20-year perspective when making strategic portfolio allocation decisions.
One point O’Shaughnessy stresses is that when you take a longer-term perspective on the market, you should consider the impact that inflation could have on the growth of your wealth.
Source: Roger G. Ibbotson and Duff & Phelps, “2021 Stocks, Bonds, Bills, and Inflation Yearbook” (Duff & Phelps, 2021).
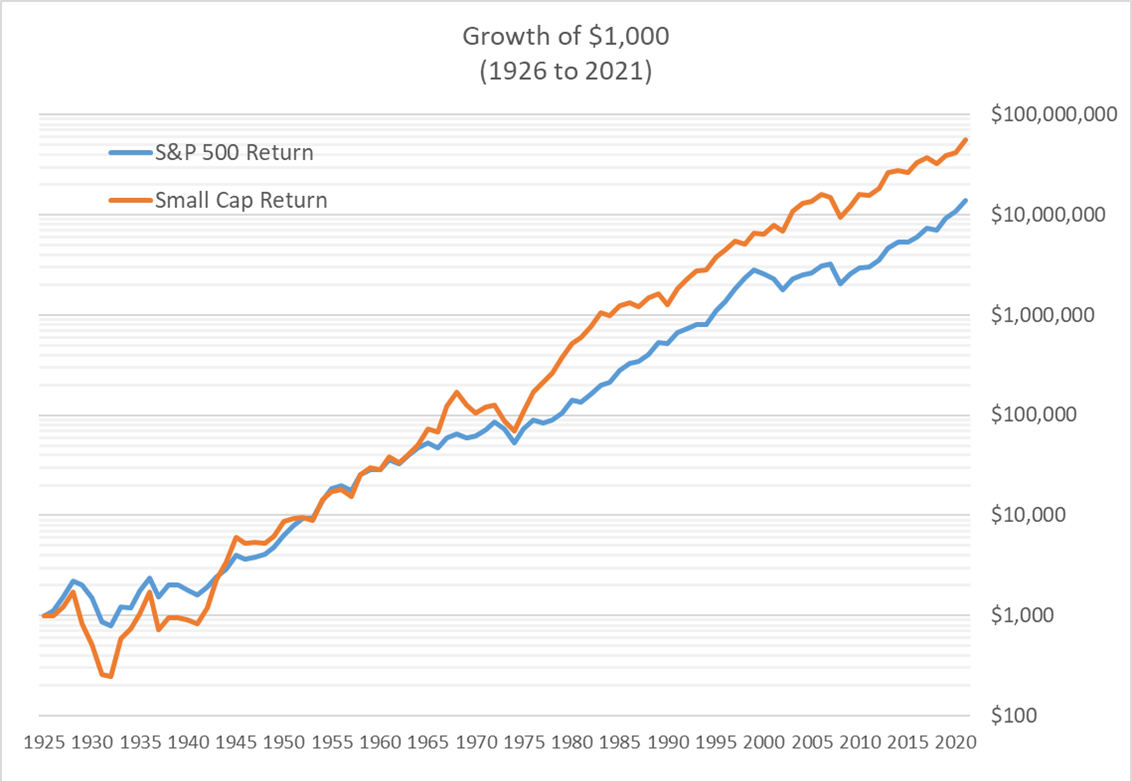
The chart above shows the cumulative growth of domestic small-cap stocks versus the S&P 500. The large-cap S&P 500 had a compound annual rate of return of 10.5% over this time period. A $1,000 investment at the end of 1925 would have resulted in a value of $9,243,522 at the end of 2021. For small-cap stocks, a 12.1% compound annual rate of return had the $1,000 investment grow to $39,365,589.
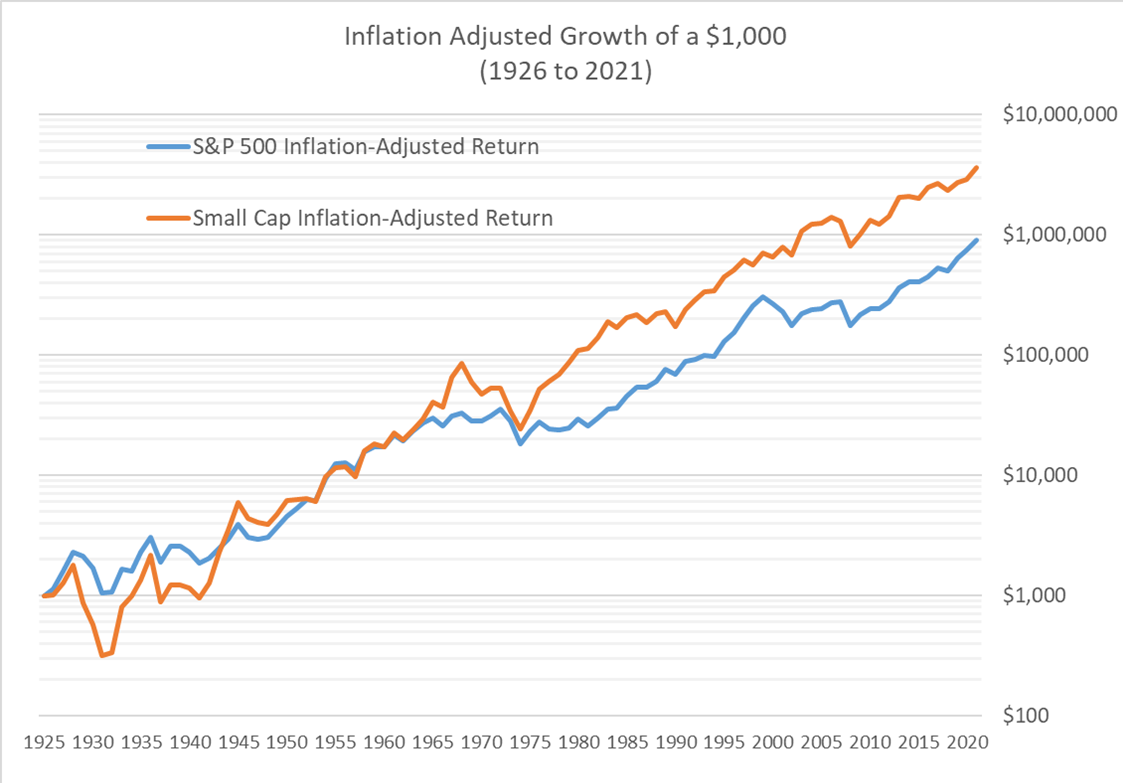
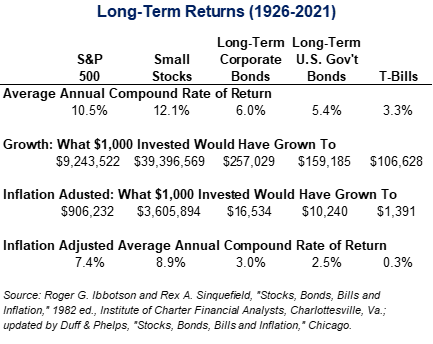
Inflation averaged 2.9% over those 96 years, reducing the long-term S&P 500 return to 7.4% and the small-cap stock return to 8.9%. On an inflation-adjusted basis, the $1,000 investment in large-cap stocks grows to $906,232, while the inflation-adjusted investment in small-cap stocks grows to $3,605,894 as shown in the chart and table below.
Source: Roger G. Ibbotson and Duff & Phelps, “2021 Stocks, Bonds, Bills, and Inflation Yearbook” (Duff & Phelps, 2021).
Beyond looking at inflation-adjusted returns, O’Shaughnessy noted the importance of having a mix of large- and small-cap stocks and looking at relative performance of these segments to help set realistic expectations of the type of returns to expect going forward.
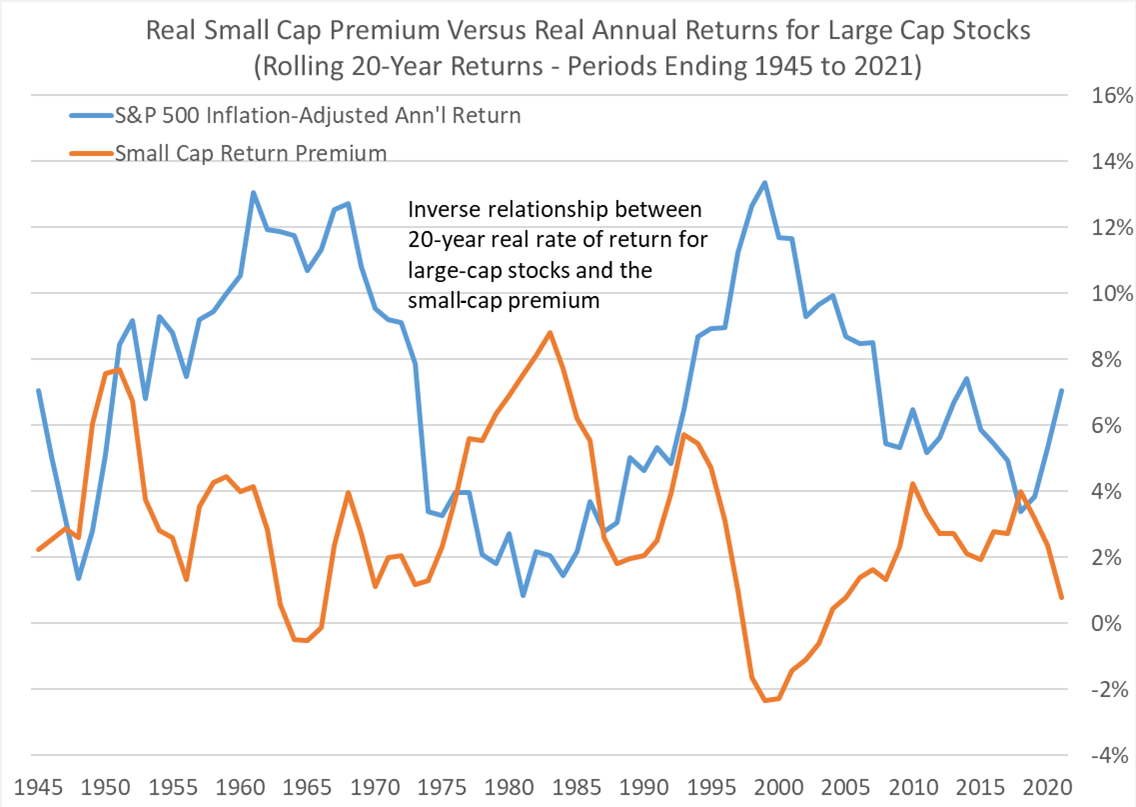
Using rolling 20-year investment periods, the small-cap return premium was strongest after a long period of large-cap stock dominance.
Source: Roger G. Ibbotson and Duff & Phelps, “2021 Stocks, Bonds, Bills, and Inflation Yearbook” (Duff & Phelps, 2021).
In the chart above, the blue line shows the inflation-adjusted compound annual return over the prior 20-year period, while the red line shows the inflation-adjusted small-cap premium observed over the same prior 20-year period. The two lines tend to have an inverse relationship—when large caps shine, the small-cap premium or outperformance declines. There are periods such as the mid-1960s and 1990s when the small-cap premium is actually below zero, indicating that they underperformed large caps over the prior 20 years. The best opportunities for small-cap stocks comes after a period of strong large-cap performance accompanied by a poor observed small-cap premium.
We are not currently at an extreme level of either, making any definitive observation difficult. However, the past 20-year period slightly favors small-cap holdings over large issues based on past history. The valid caveat that past performance is no guarantee of future returns must be noted. The importance of taking a longer-term perspective on the market is also a valuable lesson.
Thirty-six stocks met the initial selection criteria for the Model Shadow Stock Portfolio as of February 11, 2022, up from 33 passing stocks one month ago. AAII members can see and research which companies are currently passing the initial selection criteria in the Shadow Stock Ideas table on AAII.com. The list of Shadow Stock Ideas is updated daily—Tuesday through Saturday.
Of the 36 qualifying companies, eight are currently held in the Model Shadow Stock tracking portfolio: Bassett Furniture Industries Inc. (BSET), Container Store Group Inc. (TCS), Dixie Group Inc. (DXYN), Hurco Companies Inc. (HURC), Key Tronic Corp. (KTCC), Kimball Electronics Inc. (KE), Pangaea Logistics Solutions Ltd. (PANL) and Strattec Security Corp. (STRT). Qualifying companies are those held in the Model Shadow Stock Portfolio that currently meet the initial purchase rules. (They are designated as “currently qualifies” in the notes column of the Model Shadow Stock Portfolio table on AAII.com. However, if you go online, the notes may not match the list discussed here since the notes on the website table are dynamically updated daily.)
No stocks came off the list of qualifying companies over the course of the month, but four stocks started to pass the initial list of qualifying companies again—Container Store Group (last passed on January 13, 2020), Dixie Group Inc. (last passed on October 8, 2021), Kimball Electronics (notes did not indicate when it last passed, but it has been held in the portfolio for over seven years and is up 32.3% annually since its purchase) and Pangaea Logistics (last passed November 12, 2021).
Ranger Oil Corp. (ROCC) continued to have both the highest valuation and size within the portfolio. As of February 11, 2022, Ranger Oil had the highest price-to-book-value ratio in the Model Shadow Stock Portfolio. Its ratio of 2.79 is above the 1.10 maximum value used for initially qualifying a stock for inclusion in the portfolio. However, stocks are not removed from the portfolio until their price-to-book-value ratio rises to three times the initial maximum value (3.30). Titan Machinery Inc. (TITN) had the second-highest price-to-book ratio of 1.63 in the portfolio.
Ranger Oil also had the highest market capitalization in the portfolio, with a value of $1,304.3 million as of February 11, 2022. The Model Shadow Stock Portfolio looks for stocks with a market cap (share price times shares outstanding) greater than $30 million but less than $500 million when adding stocks to the portfolio. Shadow stocks with a market cap three times the initial market-cap maximum ($500 million × 3 = $1,500 million) at the time of a quarterly review are removed from the portfolio, assuming there is a suitable replacement. Two other Model Shadow Stock Portfolio holdings are trading with market caps above $1 billion—Global Ship Lease Inc. (GSL) with a market cap of $1,027.5 million and Perion Network Ltd. (PERI) with a market cap of $1,010.4 million.
Click here to see the current purchase and sell rules for the portfolio.
The next quarterly review of the AAII Model Shadow Stock Portfolio will take place around the beginning of March 2022, after most of the holdings have announced their quarterly earnings. Any changes to the portfolio will be announced at the time they are made in a special Model Shadow Stock Portfolio Update email (sign up at www.aaii.com/email).
Global Ship Lease Inc. (GSL) was the top performer for the month of January, rising by 17.1%. No significant news transpired over the month to attribute to its performance. The company has benefited from demand for the freight and logistics industry as a containership charter owner.
Ranger Oil Corp. (ROCC) was the second-best-performing stock during January, increasing by 15.2%. Demand for oil continues to be strong despite concerns surrounding the omicron coronavirus variant.
Dixie Group Inc. (DXYN) was the worst-performing stock during January, declining 27.1%. There was no significant news during the month that attributed to its subpar performance.
Beazer Homes USA Inc. (BZH) was the second-worst-performing stock during January, falling 21.4%. The company’s earnings report may have contributed to its performance. Read more about Beazer Homes’ earnings below.
Here are some news highlights from January for the holdings in the Model Shadow Stock Portfolio:
Bassett Furniture Industries Inc. (BSET) reported fourth-quarter 2021 earnings of $0.52 per share, beating the I/B/E/S consensus estimate by $0.08 per share. Earnings per share decreased by 20% year over year. Revenue for the quarter was $129.9 million, reflecting a 9.73% or $7.43 million increase year over year.
“Although incoming wholesale orders slowed from 2020’s torrid pace, fourth-quarter written orders were 8.7% ahead of 2019,” said CEO Robert Spilman Jr. “Despite ongoing supply chain complications, we were able to slightly reduce our backlog at year end measured against the end of our third quarter. Nevertheless, we ended the year with a wholesale backlog of $90.1 million compared to $54.9 million in 2020 and $20.0 million in 2019. For the past five quarters, we have sought to combat ceaseless raw material and ocean freight increases with wholesale price increases of our own; passed along to our customers. Unfortunately, our spiraling costs coupled with late shipments from our suppliers have eroded our wholesale margins as we continue to produce goods today with higher material costs than they had when the finished goods were sold months ago. This dynamic will remain with us for the first few months of 2022 as we whittle the backlog down to normalized levels and our pricing becomes current with our costs.”
Bassett Furniture declared a regular quarterly cash dividend of $0.14 per share, in line with previous payments. The dividend is payable on February 25 to shareholders of record as of February 11.
The company also sold Zenith Freight Lines LLC for $87 million.
Beazer Homes USA Inc. (BZH) reported first-quarter 2022 earnings of $1.57 per share, beating the I/B/E/S consensus estimate by 91.5%. Revenue was $446.7 million, increasing 5.3% year over year. Adjusted earnings before interest, taxes, depreciation and amortization (EBITDA) for the quarter was $61.1 million, up 40.1% year over year.
The company also boasted a high amount of available cash at the end of the quarter of $157.7 million.
“Strong first-quarter results and continuing strength in the housing market have positioned us well for our fiscal year,” said chairman and CEO Allan Merrill. “We generated significant gains in operating margin and adjusted EBITDA, leading to first-quarter net income that was more than double the prior year. We also published our first ESG summary, outlining both recent achievements and current initiatives. The new home market continues to be characterized by strong demand and limited supply, supported by growth in both employment and wages. Given this backdrop, the strength in our first-quarter results and the visibility we have into our backlog, we are confident our full-year results will exceed our previously communicated target of $5.00 despite continuing industrywide challenges in labor and material availability. We are positioned to continue growing profitability and returns, from a less leveraged and more efficient balance sheet, while expanding our ESG activities to create durable value for our stakeholders.”
Big 5 Sporting Goods Corp. (BGFV) reported revenue for the fourth quarter of 2021 of $273.4 million, which increased by 5.3% year over year. Same-store sales increased by 0.2%. For the full year, sales were $1.16 billion compared to $1.04 billion in sales for 2020. Same-store sales increased by 13.9%. Total cash and cash equivalents for the end of the year was around $97.4 million.
“We expect to deliver fourth-quarter results solidly above the high end of our earnings guidance, driven in part by a strong margin performance that was considerably ahead of our plan. Our fourth-quarter performance highlighted another record year of sales and earnings for Big 5, with 2021 earnings per share expected to surpass last year’s then-record results by approximately 75%,” said CEO Steven Miller.
Container Store Group Inc. (TCS) acquired Chicago-based Closet Works for $21.5 million. This provides the company with additional access to equipment and facilities and provides and the opportunity to expand profit margins.
Covenant Logistics Group Inc. (CVLG) reported fourth-quarter 2021 earnings per share of $1.07, beating the I/B/E/S consensus estimate by 2.1%. Earnings per share were up by 75% year over year. Revenue for the quarter was $294.2 million, reflecting a year-over-year increase from $225.2 million for the fourth quarter of 2020.
“In the fourth quarter we experienced the continuation of an exceptionally strong freight market resulting from growing economic activity, low inventories and supply chain disruptions, accompanied by constrained capacity due to a national driver and equipment shortage,” said chairman and CEO David Parker. “These conditions have continued into the first quarter of 2022. We are also pleased to report that Transport Enterprise Leasing, our 49% equity method investment, contributed pretax net income of $5.2 million, or $0.23 per share, compared to $3.0 million, or $0.13 per share, in the 2020 quarter.”
Covenant Logistics also declared a new quarterly dividend of $0.0625 per share. The first dividend is payable on March 25 to shareholders of record as of March 4.
Hurco Companies Inc. (HURC) reported fourth-quarter 2021 earnings of $0.31 per share. Net income was $2.1 million. Sales were almost $69 million, increasing 55% year over year.
CEO Greg Volovic commented. “We rebounded well from very uncertain and unstable times caused by the pandemic. We delivered products in high demand to our customers as we navigated vendor delays, transportation issues, inflationary cost increases and competitive labor markets. We increased factory production, hired new employees and completed our new software control platform for multi-axis, multi-spindle turning centers. Global sales for fiscal 2021 totaled $235.2 million and orders totaled $265.4 million, reflecting year-over-year increases of 38% and 59%, respectively. We also managed to move from approximately $10.0 million in operating losses in fiscal 2020 to approximately $10.0 million in operating income in fiscal 2021.”
Kimball Electronics Inc. (KE) reported that second-quarter 2022 total revenue fell 1.7% to $315.3 million from $320.6 million in the same period a year prior. Net income fell 66.2% to $5.1 million from $15.1 million in the second quarter of 2021. Earnings per share totaled $0.20, much lower than the I/B/E/S consensus estimate of $0.40 per share.
“Q2 was another hard-fought quarter for our company, as global supply chain issues stemming from the COVID-19 pandemic persisted and adversely impacted our results,” said chairman and CEO Donald Charron. “We continue to be well-positioned with record levels of backlog, and we are reiterating our sales guidance for fiscal 2022, although we expect to finish the year at the lower end of the range. We are revising our operating income margin guidance to reflect the difficult first half and our outlook for the balance of the fiscal year.”
The company also announced its intent to expand its facility in Poznan, Poland. The additional capacity is needed for programs with new and existing customers. The expansion is expected to require approximately $8 million of capital investment, adding approximately 40% to the facility’s existing production square footage, and will leverage the team in Poland to support customers based in Europe when complete in early fiscal 2024.
Mesa Air Group (MESA) reported a 3.8% year over year increase in total block hours for December 2021, up to 26,920. Block hours refer to the amount of time between a plane’s official departure and arrival. The coronavirus and its impact on employee attendance was a primary factor behind Mesa Air’s controllable completion factors of 93.05% and 97.89% for its American Airlines and United Airlines operations, respectively.
Ranger Oil Corp. (ROCC) announced a 20% increase to the company’s borrowing base under its revolving credit facility from $600 million to $725 million.
“Due to our expectation of significant ongoing free cash flow and debt reduction, we have chosen to keep our elected commitment at $400 million,” said president and CEO Darrin Henke. “This increase, however, continues to strengthen our balance sheet, creates financial flexibility for consolidation and other opportunities, and enhances the potential liquidity available to the company.”
Rayonier Advanced Materials Inc. (RYAM) announced the introduction of a second generation (2G) bioethanol product for Europe’s fast-growing biofuels market. Rayonier Advanced Materials will be among the first in France to produce 2G bioethanol fuel from wood.
The company is scheduled to begin construction of a new 2G production facility in the spring of 2022 and commercial sales are scheduled to begin in the summer of 2023.
“With the successful development of second-generation bioethanol products, RYAM is taking an important step toward achieving our BioFuture and promoting a more sustainable world,” said president and CEO Vito Consiglio. “The strong demand for this innovative, renewable biofuel represents another example of how we can leverage our existing biorefineries and knowledge of cellulose chemistry to provide biobased solutions.”
VOXX International Corp. (VOXX) reported a fiscal third-quarter 2022 loss of $1.16 per share, missing the I/B/E/S consensus estimate for earnings per share of $0.07 by $1.09 per share. The company reported earnings of $0.75 per share in the comparable period of fiscal 2021.
VOXX International had net sales of $191.9 million for the quarter, up 17.7% from the same quarter of 2021. The company reported gross income of $37.2 million, down 4.6% from the second quarter of 2021. Net loss for the quarter was $29.7 million, down $47 million over comparable quarters. The huge decrease in net income is attributed to an unfavorable arbitration award against the company of $39.4 million during the quarter. Cash has not been paid out, but rather a charge has been taken. The company is reviewing its legal options, including seeking reconsideration by the arbitrator of this award of damages.
“Overall, we had a strong quarter, especially considering the ongoing impact of the global pandemic and industrywide supply chain shortages,” said president and CEO Pat Lavelle. “We outperformed our plan, exceeding our latest projections for revenue, margins and operating income, and our outlook remains the same, provided OEM [original equipment manufacturer] customers meet their projected schedules. The price increases we instituted last quarter helped. We are delivering on several automotive OEM programs, with the big news in Q3, a new award from Stellantis estimated to be approximately $125 million. This brings the value of awards received over the past two and a half years to approximately $530 million.”
The company did not give any outlook for the rest of fiscal-year 2022. Current I/B/E/S estimates project the company to earn $1.32 per share for fiscal-year 2022.
 Get updates about the portfolio that has outperformed the market by 211.9%
since inception!
Get updates about the portfolio that has outperformed the market by 211.9%
since inception!