

John Bajkowski
is the president of AAII.
 CVLG
DCO
DFSCX
GSL
KE
KTCC
NAESX
ORN
PANL
PERI
RYAM
SIF
STRT
ULBI
VFINX
VPG
CVLG
DCO
DFSCX
GSL
KE
KTCC
NAESX
ORN
PANL
PERI
RYAM
SIF
STRT
ULBI
VFINX
VPG
The Model Shadow Stock Portfolio is reviewed quarterly to determine portfolio sales and additions, a practice put in place since the portfolio’s inception in 1993. The review cycle is tied to the standard quarterly reporting cycle of most publicly traded firms in the U.S. Companies are examined for violating the earnings, valuation, size and age rules of the Model Shadow Stock Portfolio.
The primary Model Shadow Stock Portfolio selection criteria target the intersection of the smallest 10% of domestic stocks as measured by market capitalization, along with the “cheapest” 10% of domestic stocks as measured by the price-to-book-value (P/B) ratio. These decile breakpoints are determined by examining domestic companies that are listed on the New York Stock Exchange (NYSE) and then applying the size and value breakpoints for stocks listed on all domestic exchanges.
When the quarterly review was conducted at the start of March, the NYSE price-to-book cutoff had decreased from 1.04 to 0.90, well below the model portfolio’s maximum initial price-to-book ratio of 1.10. Therefore, the maximum minimum initial price-to-book ratio is being reduced from 1.10 to 0.90. Stocks are sold for valuation if they exceed three times the minimum initial price-to-book ratio at the time of a quarterly portfolio review. We used a price-to-book cutoff of 0.90 to screen for stocks to add to the Model Shadow Stock Portfolio and 2.70 (0.90 × 3) as the maximum price-to-book ratio to keep stocks in the portfolio.
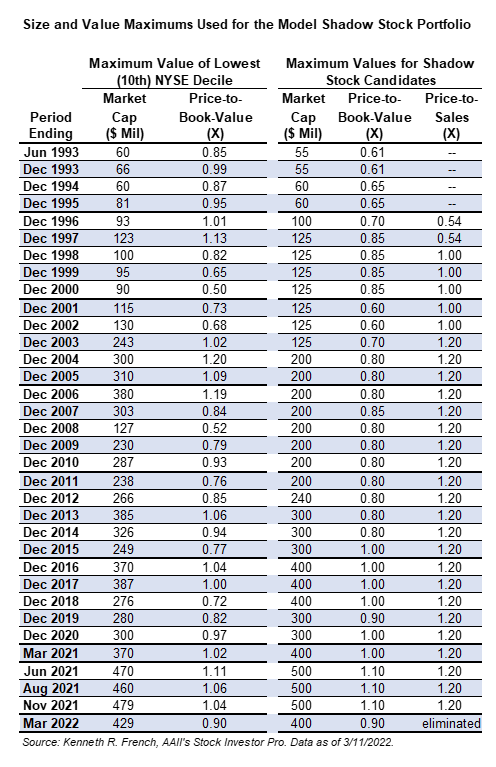
The NYSE market-cap cutoff for the lowest decile is currently $429 million, compared to the portfolio’s $479 million maximum in November 2021, so the size cutoff was also adjusted for the Model Shadow Stock Portfolio during the quarterly review from $500 million to $400 million. The maximum market cap for inclusion in the Model Shadow Stock Portfolio is now $400 million, and holdings are sold if their market cap goes above three times the initial criterion at the time of the quarterly review: $1,200 million.
We also eliminated the maximum price-to-sales cutoff used to screen for inclusion in the Model Shadow Stock Portfolio. The price-to-sales screen was first added as a screening filter for the model portfolio based upon the work of James O’Shaughnessy, who found that the price-to-sales ratio was an effective measure to locate value stocks. O’Shaughnessy published separate growth and value approaches in the influential book, “What Works on Wall Street.” More recent editions of the book note the advantages of using composite factors to identify promising candidates and have moved beyond the price-to-sales ratio. (See “‘What Works’: Key New Findings on Stock Selection” by James O’Shaughnessy in the October 2013 AAII Journal.)
The price-to-sales filter has never been a primary valuation factor for the model portfolio, used only to help determine qualifying stocks and not used to remove stocks from the portfolio. Its removal from determining the initially qualifying list of companies will not dramatically change the list but will allow a slightly broader consideration in certain higher profit margin industries that traditionally trade with higher price-to-sales ratios.
The other major factor that leads to portfolio turnover is tied to negative earnings. If a company reports trailing 12-month earnings from continuing operations that are negative, the stock is placed on probation; if a subsequent quarter has negative earnings prior to trailing 12-month earnings becoming positive, the stock is sold. When available, adjusted (non-GAAP) earnings are used to put stocks on probation or sell them. These are earnings that have been adjusted to eliminate the impact of nonrecurring events such as markdown of inventory or goodwill. These are earnings reported in the media and firms reporting consensus estimates. The I/B/E/S adjusted earnings reported in Stock Investor Pro are used for Model Shadow Stock Portfolio decisions when they are available.
A stock can also be sold if it has been held over four years if it also no longer meets the initial rules for qualifying and has not gained at least 10% annually from its purchase price and there is a new qualifying stock to replace it.
After conducting the quarterly review of the Model Shadow Stock Portfolio, Orion Group Holdings Inc.  (ORN), Ranger Oil Corp. (ROCC), Rayonier Advanced Materials Inc. (RYAM) and SIFCO Industries Inc. (SIF) were removed from the tracking portfolio during regular trading hours on Monday, March 14, 2022. With the proceeds from these four sales, as well as the cash held in the portfolio, there were only enough funds to purchase three new holdings at the average portfolio holding size—Advanced Emissions Solutions Inc. (ADES), Fonar Corp. (FONR) and SigmaTron International Inc. (SGMA).
Ranger Oil Corp. (ROCC)
At the time of our quarterly review, Ranger Oil exceeded the market-cap sell cutoff of $1.2 billion with a market cap of $1.64 billion. It is the policy of the Model Shadow Stock Portfolio to sell a stock once its market cap reaches three times the initial purchase limit, which is now $400 million.
Ranger Oil, formerly Penn Virginia Corp., is an independent oil and gas company. It’s engaged in the development and production of oil, natural gas liquids (NGLs) and natural gas, with operations in the Eagle Ford shale in South Texas. Ranger Oil’s operations consist of drilling unconventional horizontal development wells and operating its producing wells. Its operating wells are located in Eagle Ford Shale (the Eagle Ford) in Gonzales, Lavaca, Fayette and DeWitt Counties in South Texas.
Orion Group Holdings Inc. (ORN)
Orion Group Holdings is a specialty construction company, which serves the infrastructure, industrial and building sectors, providing services both on and off the water in the continental U.S., Alaska, Canada and the Caribbean Basin. Orion Group operates through two segments, marine and concrete. The marine segment provides construction and dredging services relating to marine transportation facility construction, marine pipeline construction, marine environmental structures, dredging of waterways, channels and ports, environmental dredging, design and specialty services. The concrete segment provides turnkey concrete construction services including pour and finish, dirt work, layout, forming, rebar and mesh across the light commercial, structural and other associated business areas.
Orion Group is being removed from the portfolio because of the Model Shadow Stock Portfolio’s negative earnings rule. On March 2, 2022, the company reported an adjusted quarterly loss of $0.17 per share, while trailing 12-month earnings remained negative. Adjusted trailing 12-month earnings per share first turned negative on October 27, 2021, when the company reported a loss of $0.27 per share on adjusted third-quarter earnings.
It is the policy of the Model Shadow Stock Portfolio to sell a stock once its trailing 12-month adjusted earnings go negative and the company reports a quarterly loss in a subsequent quarter while trailing earnings are still negative.
Rayonier Advanced Materials Inc. (RYAM)
Rayonier Advanced Materials is a cellulose-based technology company whose products are used in the production liquid-crystal display (LCD) displays, filters, fibers, performance additives for pharmaceutical, food and other industrial applications. It also manufactures products for paperboard and high-yield pulp markets. It conducts its manufacturing operations across the U.S., Canada and France.
Rayonier Advanced Materials is being removed from the portfolio because of the Model Shadow Stock Portfolio’s negative earnings rule. On February 23, 2022, the company reported an adjusted quarterly loss of $0.37 per share, while trailing 12-month earnings remained negative. Adjusted trailing 12-month earnings per share first turned negative on November 2, 2021, when the company reported a loss of $0.21 per share on adjusted third-quarter earnings.
It is the policy of the Model Shadow Stock Portfolio to sell a stock once its trailing 12-month adjusted earnings go negative and the company reports a quarterly loss in a subsequent quarter while trailing earnings are still negative.
SIFCO Industries Inc. (SIF)
SIFCO Industries is a worldwide provider of highly engineered forged components to the aerospace, energy and defense markets. It supplies flight-critical forged components and machined assemblies to all of the leading aircraft and engine manufacturers in the world. SIFCO’s products are also supplied to the leading steam and gas turbine manufacturers and oil producers serving the energy sector.
SIFCO is being removed from the portfolio because of the Model Shadow Stock Portfolio’s negative earnings rule. On February 23, 2022, the company reported a quarterly loss of $0.636 per share, while trailing 12-month earnings remained negative. Adjusted trailing 12-month earnings per share first turned negative last quarter, when the company reported a loss of $0.43 per share on third-quarter earnings.
It is the policy of the Model Shadow Stock Portfolio to sell a stock once its trailing 12-month adjusted earnings go negative and the company reports a quarterly loss in a subsequent quarter while trailing earnings are still negative.
As of March 11, 21 stocks met the initial selection criteria for the Model Shadow Stock Portfolio. This is down from 36 passing companies last month; however, last month the price-to-book maximum was 1.10 and the market-cap ceiling was $500 million. Using the old cutoffs, 40 companies passed the initial selection criteria. AAII members can see and research which companies are currently passing the initial selection criteria in the Shadow Stock Ideas table on AAII.com. The list of new Shadow Stock Ideas is updated daily—Tuesday through Saturday.
Two stocks already in the Model Shadow Stock Portfolio passed the updated criteria at the time of the review: Key Tronic Corp. (KTCC) and Strattec Security Corp. (STRT).
The remaining 19 stocks were examined to ensure adequate liquidity, timely financial filings and appropriate industry and foreign considerations. Seven stocks were excluded from consideration because their average daily dollar trading volume was too low, indicating that they might be difficult to purchase without severely impacting the share price. The Shadow Stock Portfolio Rules on AAII.com provide guidance for factors to consider when selecting stocks for your portfolio.
Price momentum is used as the tie breaker among qualifying stocks. The remaining stocks were ranked using the weighted relative strength ranking, which considers price performance over the last year but places a higher weight on the most recent quarterly price performance.
Three holdings were added using the average position size of the remaining holdings: Advanced Emissions Solutions, Fonar and SigmaTron International.
Advanced Emissions Solutions Inc. (ADES)
Advanced Emissions Solutions is engaged in the sale of consumable air and water treatment options, including activated carbon (AC) and chemical technologies. The firm’s segments include refined coal (RC) and advanced purification technologies (APT). The RC segment consists of equity ownership in Tinuum Group LLC and Tinuum Services LLC. Tinuum Group provides reduction of mercury and nitrogen oxide emissions at select coal-fired power generators. The APT segment operates through a wholly owned subsidiary, Carbon Solutions. The company sells consumable products that utilize AC and chemical-based technologies to a range of customers, including coal-fired utilities, industrials, water treatment plants and other diverse markets.
Advanced Emissions Solutions has a book value per share of $8.05 as of December 31, 2021. If you wish to stay within the 0.90 price-to-book maximum, you should pay no more than $7.25 per share ($8.05 × 0.90). However, if the stock price has moved up after being added to the portfolio, you can still purchase the stock unless the price-to-book ratio goes above 1.00, which equates to a price of $8.05 per share. To calculate the maximum purchase price based on the maximum desired price-to-book ratio, multiply the current book value per share ($8.05 for Advanced Emissions Solutions) by the maximum price-to-book ratio to be considered for the Model Shadow Stock Portfolio (currently 0.90, or 1.00 for loosened consideration).
Fonar Corp. (FONR)
Fonar is engaged in the research, development, production and marketing of magnetic resonance imaging (MRI) scanners for the detection and diagnosis of human diseases in the U.S. Fonar operates through two segments: manufacturing and the servicing of medical equipment, and management of diagnostic imaging centers. It offers upright MRI, which is used to scan any part of the body. The upright MRI allows patients to be scanned in various conditions, such as standing, sitting, bending or lying down in any position. Fonar’s products and services also offer the FONAR 360° and the Open Sky MRI.
Fonar has a book value per share of $21.01 as of December 31, 2021. If you wish to stay within the 0.90 price-to-book maximum, you should pay no more than $18.91 per share ($21.01 × 0.90). However, if the stock price has moved up after being added to the portfolio, you can still purchase the stock unless the price-to-book ratio goes above 1.00, which equates to a price of $21.01 per share.
SigmaTron International Inc. (SGMA)
SigmaTron International is a provider of electronic manufacturing service (EMS), which includes printed circuit board assemblies and completely assembled box-build electronic products to customers. SigmaTron also provides services to its customers, including automatic and manual assembly and testing of products; material sourcing and procurement; manufacturing and test engineering support; design services; warehousing and distribution services and assistance in obtaining product approval from governmental and other regulatory bodies. SigmaTron operates in three diverse end-user markets: industrial, consumer and medical/life sciences for its customers in the U.S., Mexico, China and Vietnam.
SigmaTron is a former holding within the Model Shadow Stock Portfolio. It was removed from the portfolio on December 3, 2018, when it violated the portfolio’s positive earnings rules.
SigmaTron has a book value per share of $16.95 as of October 31, 2021. If you wish to stay within the 0.90 price-to-book maximum, you should pay no more than $15.26 per share ($16.95 × 0.90). However, if the stock price has moved up after being added to the portfolio, you can still purchase the stock unless the price-to-book ratio goes above 1.00, which equates to a price of $16.95 per share.
The next quarterly review of the Model Shadow Stock Portfolio will take place following the end of May 2022. Any changes to the portfolio will be announced at the time they are made in our Model Shadow Stock Portfolio Update emails (sign up at www.aaii.com/email).
Small-cap and value holdings held up better in February than the broad market. The Model Shadow Stock Portfolio lost 1.0% during February 2022 and is now down 5.9% for the year. The S&P 500 index as measured by the performance the Vanguard S&P 500 Index fund (VFINX) had a loss of 3.0% during February and is down 8.0% for the first two months of the year. The Vanguard Small Cap Index fund (NAESX) is down 7.1% for the year after gaining 0.8% in February. The DFA U.S. Micro Cap fund (DFSCX) gained 1.6% during February and is down 5.0% for the year.
Value stocks outperformed growth stocks during February across all size segments, and value stocks are outperforming growth stocks for the first two months of 2022.
In the large-cap segment, growth stocks were down 4.5% during February, contributing to a 12.5% loss year to date for 2022. Large-cap value stocks were down 1.4% during February and are now down 3.0% year to date.
In the mid-cap segment, growth stocks are down 9.5% for the year, after gaining 1.0% during February. Mid-cap value stocks are down 2.8% for the year, after gaining 1.3% during the month.
Small-cap growth stocks are down 13.0% year to date, while small-cap value stocks are down 4.3%. Small-cap growth stocks gained 0.4% during February, while small-cap value stocks gained 1.7% during the month.
Since its inception in 1993, the AAII Model Shadow Stock Portfolio has a compound annual average return of 14.6% versus the Vanguard 500 Index fund’s gain of 10.2% per year on average over the same period. Over the same period, the Vanguard Small Cap Index fund posted an average annual gain of 10.2%.
Pangaea Logistics Solutions Ltd. (PANL) was the top-performing stock for the month, up by 27.0%. The company raised its dividend during the month, with CEO Mark Filanowski commenting on the continuation of strong demand in the shipping markets.
SIFCO Industries Inc. (SIF) was the second-best-performing stock for the month, up by 15.9%. There was no company-specific news tied to the increase.
Big 5 Sporting Goods Corp. (BGFV) was the worst-performing stock for the month, down by 15.9%. There was no company-specific news tied to the decrease.
Container Store Group Inc. (TCS) was the second-worst-performing stock for the month, down by 13.4%. The company reported year-over-year decreases in both earnings and net sales for the third quarter of 2021.
Here are some news highlights from February for the holdings in the Model Shadow Stock Portfolio:
Container Store Group Inc. (TCS) reported adjusted earnings of $0.28 per share for the third quarter of fiscal 2021, which beat the I/B/E/S consensus estimate of $0.21 per share by 33.3%. Adjusted earnings decreased year over year by 33.3%. Consolidated net sales decreased 3.0% over the same period to $267.3 million.
Net sales in the Container Store retail business were $248.6 million, down 3.1% compared to the third quarter of fiscal 2020, inclusive of a 5.4% decrease in general merchandise categories while custom closets business was flat. Compared to the third quarter of fiscal 2019, net sales were up 17.3%, which included a 19.5% increase in custom closets and a 15.6% increase in general merchandise categories.
“Our third-quarter results exceeded our expectations, and we achieved a third straight quarter in fiscal 2021 of at least 16% sales growth compared to fiscal 2019,” said president and CEO Satish Malhotra. “Our recent acquisition of Closet Works provides us with the opportunity to meet the growing consumer demand for custom closets, specifically for premium wood-based spaces with an expanded assortment. As we look forward, our financial results combined with the progress we are making against our strategic initiatives position us well to finish out our fiscal year strong despite continued pandemic-related headwinds.”
Container Store currently expects fourth-quarter fiscal-2021 consolidated sales to decline about 11% year over year. Earnings for the quarter are expected to be about $0.24 per share.
Covenant Logistics Group Inc. (CVLG) completed the acquisition of AAT Carriers Inc., which specializes in highly regulated, time-sensitive loads for the U.S. government and will become a part of the expedited segment. For 2021, AAT Carriers generated approximately $25 million in revenue. The total purchase price, including any earnout achieved, is expected to range from $35 million to $55 million and represent between 3.3 times and 5.5 times adjusted earnings before interest, taxes, depreciation and amortization (EBITDA), depending on the results achieved by AAT Carriers.
Also, Covenant Logistics announced a stock repurchase program of up to $30 million of common stock.
Delta Apparel Inc. (DLA) reported earnings per share of $0.51 for the first quarter of 2022, which beat the I/B/E/S consensus estimate of $0.30 per share by 70.0%. Earnings increased by over 300% year over year. Net sales increased by 17.0% to $110.7 million over the same period.
Net sales in the Delta group segment grew 16% to $101.9 million compared to $87.6 million in the first fiscal quarter of the prior year. Salt Life segment net sales grew 24% from the first quarter of the prior year to $8.8 million. Net inventory as of December 2021 was $183.1 million, an increase of $21.4 million from September 2021 and $34.6 million from December 2020. The improved inventory levels reflect increased production during the past year as the company reached record manufacturing levels.
“We delivered strong first-quarter results that not only exceeded our expectations but reached a first-quarter record for our company with sales surpassing $110 million,” said chairman and CEO Robert Humphreys. “Our bottom-line results were also impressive as we registered EPS growth of nearly 300%. The fast start to the new fiscal year reflected broad-based performance across both our Delta and Salt Life business segments.”
Ducommun Incorporated (DCO) reported adjusted earnings per share of $0.79 for the fourth quarter of 2021, which was in line with the I/B/E/S consensus estimate. Adjusted earnings per share decreased year over year by 11.2%. Net revenue increased by 4.5% to $164.8 million over the same period.
In revenue, Ducommun reported $4.9 million higher revenue from its industrial end-use markets due to timing of customer requirements and $4.4 million higher revenue from its commercial aerospace end-use markets due to higher build rates on other commercial aerospace platforms and regional and business aircraft platforms. Lower revenue from Ducommun’s military and space end-use markets partially offset this revenue growth due to lower build rates on military rotary-wing aircraft platforms.
“2021 was a return to growth story for Ducommun and I’m pleased with how much we accomplished along with positioning the company for continued success in the years ahead,” said CEO Stephen Oswald. “Ducommun ended the year with a strong backlog of approximately $905 million, with gains driven by a recent uptick in commercial aerospace orders. For 2021, we posted revenues of approximately $645 million, led by another record year for military and space, topping $450 million, along with strong gross margins. In 2022, with growing travel demand and subsiding pandemic-related related restrictions, the commercial aerospace industry should continue its recovery especially in the narrow body market. Our longstanding customer relationships with Boeing, Raytheon and other leading OEMs [original equipment manufacturers], along with our five-year Airbus contract for titanium products awarded in 2021 are expected to drive stronger performance in 2022 and beyond.”
Global Ship Lease Inc. (GSL) declared a regular quarterly dividend of $0.25 per share, in line with its previous payment. The dividend was payable on March 4 to shareholders of record as of February 22.
Key Tronic Corp. (KTCC) reported earnings per share of $0.05 for the second quarter of 2022, which decreased year over year by 64.3%. Total revenue increased by 5.0% to $134.5 million over the same period.
During the second quarter, the global supply chain, pandemic and transportation issues continued to disrupt production, including intermittent parts supply, factory downtime and overtime expenses. In addition, the company had a seasonal closure for two weeks at the end of December and revenue attributed to customer reimbursements did not contribute to its gross margin.
Legal costs related specifically to the U.S. Securities and Exchange Commission’s (SEC) review of last year’s whistleblower complaint totaled approximately $0.7 million during the quarter. For the second quarter of fiscal-year 2022, Key Tronic’s gross margin was 7.3% and its operating margin was 1.2%, compared to a gross margin of 8.3% and an operating margin of 2.1% in the same period of fiscal-year 2021.
For the third quarter of fiscal-year 2022, Key Tronic expects to report revenue in the range of $130 million to $140 million and earnings in the range of $0.05 to $0.10 per share. These expected results assume an effective tax rate of 25% in the coming quarter. Despite growing customer demand and backlog, the company expects ongoing disruptions from the global supply chain and pandemic issues to continue to significantly limit production and adversely impact operating efficiencies.
Kimball Electronics Inc. (KE) reported adjusted earnings per share of $0.20 for the second quarter of 2022, which missed the I/B/E/S consensus estimate of $0.40 per share by 50.0%. Adjusted earnings decreased year over year from $0.60 per share. Net sales decreased by 2.0% over the same period to $315.3 million.
“Q2 was another hard-fought quarter for our company, as global supply chain issues stemming from the COVID-19 pandemic persisted and adversely impacted our results,” said chairman and CEO Donald Charron. “Component shortages continued to make it extremely challenging to obtain the materials needed to support customer demand. While conditions improved modestly in December with sales accelerating, the lost absorption was significant once again this quarter.”
The company reiterated its sales guidance for fiscal-year 2022 with net sales in the range of $1.4 billion to $1.5 billion, an 8% to 16% increase year over year, although the final result is expected to be at the lower end of the range. Operating income is estimated to be between 3.75% and 4.25% of net sales, compared to the original guidance of 4.5% to 5.0% of net sales.
Mesa Air Group (MESA) announced a net loss of $14.3 million, or $0.40 per diluted share, for the first quarter compared to net income of $14.1 million, or $0.39 per diluted share in the prior-year quarter. Mesa Air’s adjusted net loss of $9.3 million was down compared to net income of $13.2 million in 2021.
Possible contributors could be a $22.5 million decrease related to the coronavirus pandemic, such as canceled flights, a catch-up in deferred heavy maintenance expense and a spike in sick-related absence rates.
“Mesa’s results reflect the impact of Covid to our quarter’s operations and financials,” said chairman and CEO Jonathan Ornstein. “Its effect on this quarter was significant and unlike anything we have seen in 20 years. This was further impacted by elevated pilot attrition as the major and national airlines have accelerated hiring. Looking ahead, we are cautiously optimistic that we are already seeing a decrease in Covid-related absence rates. Managing through the challenges of pilot attrition in our core regional operation remains our team’s top priority.”
Pangaea Logistics Solutions Ltd. (PANL) declared a regular quarterly dividend of $0.05 per share, an increase of 43% over its prior payment. The dividend is payable on March 15 to shareholders record as of March 1.
Perion Network Ltd. (PERI) announced earnings per share of $0.62 for fourth-quarter 2021, beating the I/B/E/S consensus estimate by $0.12 per share. Revenue was $15 million, which grew 33.6% year over year and beat estimates by $13 million. Perion Network also raised its financial guidance for 2022, including a $20 million increase in revenue and an $8 million increase in adjusted EBITDA.
CEO Doron Gerstel said, “What are the cost[s] for this high profitability? I mentioned the hub-and-spoke model, and it has a huge potential of saving resources. The second thing is that our investment the previous year in automation and technology is really paying off. And as you can see, while we are scaling our business, we’re able to leverage our expenses. One of our major efforts was to establish offshore operations on some of the repeat tasks that we have in India, and that’s definitely helping us from a cost-structure standpoint.”
Rayonier Advanced Materials Inc. (RYAM) announced a quarterly loss per share of $0.37, missing the I/B/E/S consensus estimate of a loss of $0.07 per share for fourth-quarter 2021. Quarterly sales of $374 million also missed analyst expectations, a 26.38% year-over-year decrease.
“I am excited to be joining Rayonier Advanced Materials at such an important inflection point in our history,” said Vito Consiglio, new CEO as of January 2022. “The actions taken by the team to streamline the portfolio, negotiate higher contract prices and volumes for cellulose specialties and highlight our sustainability objectives set the company on a path to achieve significant improvements in 2022 and beyond.”
SIFCO Industries Inc. (SIF) reported a quarterly loss of $0.64 per share. This represents a 225.49% decrease over positive earnings of $0.51 per share from the same period last year. The company reported $19.20 million in sales this quarter, representing a 23.44% decrease over sales of $25.08 million during the same period last year.
“Our first quarter was challenging as we delivered products in line with lower requirements as the markets continue to work through the effects of the pandemic,” said CEO Peter Knapper. “We remain focused on delivering for and supporting our customers as we manage working capital and position the business in anticipation of a recovery in the A&E [architecture & engineering] markets.”
Ultralife Corp. (ULBI) reported fourth-quarter 2021 adjusted diluted loss per share of $0.09, missing the I/B/E/S consensus estimate of a loss per adjusted diluted share of $0.04. Total revenue for the quarter was $23.7 million, a decrease from the $28.9 million reported in the comparable quarter. Full-year revenue totaled $98.3 million, decreasing from the $107.7 million reported in 2020.
The company reported gross profit of $5.3 million for the quarter, representing a gross profit margin of 22.2%, decreasing from gross profit of $7.3 million and gross profit margin of 25.3% in the fourth quarter of 2020. Net loss for the quarter totaled $1.1 million, a decrease from the $2.1 million of net income a year ago. Full-year net loss for the company was $234,000, a decline from the net income of $5.2 million reported a year ago.
“The supply chain challenges associated with the global pandemic persisted during the fourth quarter and weighed heavily on both revenue and earnings,” said president and CEO Michael Popielec. “While year-over-year revenues for government/defense and medical were most impacted by these challenges, we were encouraged by the rebound in oil & gas revenues, the performance of our China operations and the initial contribution of Excell. Order flow remained strong primarily in our medical and military end markets, and backlog at the end of the quarter increased to over $53 million representing a 35% increase over year-end 2020 for our core business and increasing to over $63 million representing a 61% increase bolstered by Excell … As we look ahead, our backlog, durable customer relationships and new product initiatives anchor our view that our long-term profitable growth drivers and strategy are sound and achievable.”
The company did not provide outlook for fiscal-year 2022, but I/B/E/S estimates currently project the company to report diluted earnings per share of $0.32 for full-year 2022.
Vishay Precision Group Inc. (VPG) reported fourth-quarter 2021 adjusted diluted earnings per share of $0.56, an increase over adjusted diluted earnings per share of $0.43 reported in the fourth quarter of 2020. Earnings beat the I/B/E/S consensus estimate of $0.54 per share by 3.7%. Full-year adjusted diluted earnings per share were $1.87, as compared to the prior-year period’s earnings of $1.32 per share. Revenue for the quarter totaled $90 million, a 19.3% increase over 2020. Full-year revenue totaled $317.9 million, up 17.8% year over year.
The company reported net income of $5.9 million, a significant increase over $97,000 net income in the comparable quarter of 2020. Full-year net income was $20.2 million, an 87.4% increase over $10.7 million reported in 2020. Operating income for the quarter was $8.7 million, representing a 9.7% operating profit margin, compared to operating income of $5.9 million and an operating profit margin of 7.8% in 2020.
“We delivered another strong quarter, which capped a successful year for VPG,” said CEO Ziv Shoshani. “Fiscal 2021 was one of best years in VPG’s history, as we grew our fiscal-2021 sales by 17.8% and our adjusted diluted EPS by 42.0%. In the fourth quarter, we grew our revenue and adjusted diluted earnings per share sequentially and compared to the fourth quarter a year ago. Order trends in the fourth quarter remained firm across the majority of our markets, as we ended the quarter with a book-to-bill of 1.06 and a record level backlog of $150.5 million.”
The company did not provide an outlook for the fiscal-year 2022, but I/B/E/S consensus is estimating diluted earnings per share of $1.98 for the company.
 Get updates about the portfolio that has outperformed the market by 211.9%
since inception!
Get updates about the portfolio that has outperformed the market by 211.9%
since inception!