


John Bajkowski
is the president of AAII.
The Model Shadow Stock Portfolio gained 11.1% during December, boosting its full-year 2023 return to 20.8%. It was a welcome bounce back from the 19.7% loss experienced in 2022, but the Model Shadow Stock Portfolio underperformed the S&P 500 index’s 2023 gain of 26.1% as measured by the Vanguard 500 Index fund  (VFINX). The S&P 500 gained 4.5% during December with smaller, valued-focused companies outperforming larger growth companies during the year-end rally.
The relative performance of small-cap stocks to large-cap stocks often runs in streaks. Small-company stocks have outperformed large-company stocks over the long term, but as we have seen they do not outperform large-cap stocks every year, and they tend to exhibit flashes of outperformance followed by periods underperformance.
Over its 31-year existence, the Model Shadow Stock Portfolio outperformed the Vanguard 500 Index fund in 17 of the 31 calendar years, or 55%.
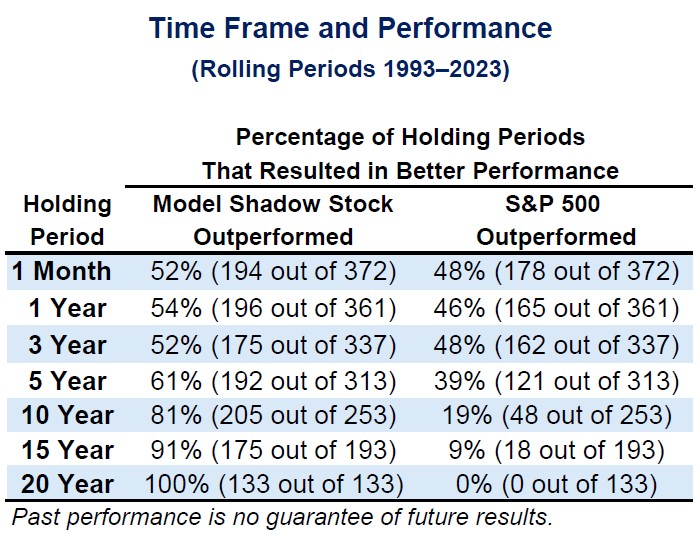
Since calendar years are somewhat arbitrary start and end dates, rolling periods are often used to smooth out seasonality. There have been 361 rolling 12-month time periods over the last 31 years. The Model Shadow Stock Portfolio has outperformed the Vanguard 500 Index fund in 54% of the one-year periods. When it comes to three-year holding periods, the Model Shadow Stock Portfolio has outperformed the Vanguard 500 Index fund in 52% of the periods, while outperforming the index fund in 61% of the five-year rolling periods and in 81% of the rolling 10-year periods over last 31 years. The S&P 500 has outperformed the Model Shadow Stock Portfolio in 18 out of the 193 15-year holding periods, but not in any of the 133 20-year holding periods.
It is important to consider that a historical pattern may not repeat itself in the future, but longer holding periods normally provide a greater likelihood that stocks exhibit their potential for positive returns. A very practical way to view investor risk is to examine the likelihood that your invested money will diminish from the time of the initial investment to the end of the holding period time frame and to keep in mind that the variability of expected annual returns is reduced with longer holding periods.
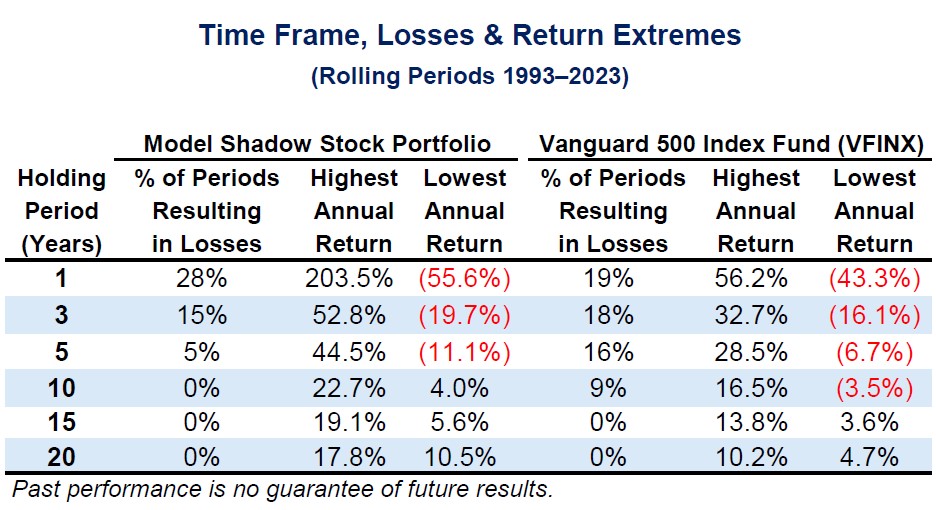
The table here assumes an investment in the Model Shadow Stock Portfolio or the Vanguard 500 Index fund that remains invested for the holding period indicated. The table indicates the percentage of times the portfolio would have suffered a loss from 1993 through 2023. It also includes the greatest compound annual gain and loss observed for the various holding periods. For example, using five-year holding periods, the Model Shadow Stock Portfolio experienced a loss in 5% of the 313 holding periods. The greatest compound annual loss was 11.1% for the five-year holding period of April 2015 through March 2020, and the greatest compound annual gain was 44.5% for the five-year holding period of March 2009 through February 2014.
We can expect a large variability in stock market returns over the short term, but that variability starts to get reduced as the holding period increases. The Model Shadow Stock Portfolio gained as much as 203.5% for one 12-month holding period (April 2020 through March 2021), but it has also lost more than half its value during a 12-month holding period (55.6% loss from March 2008 through February 2009). Stocks offer the potential for greater returns over the long term compared to safer holdings such as Treasury bills, but you must have a longer time horizon to help realize the potential. The variability of returns—risk as measured by the chance of loss—goes down as the holding period gets longer.
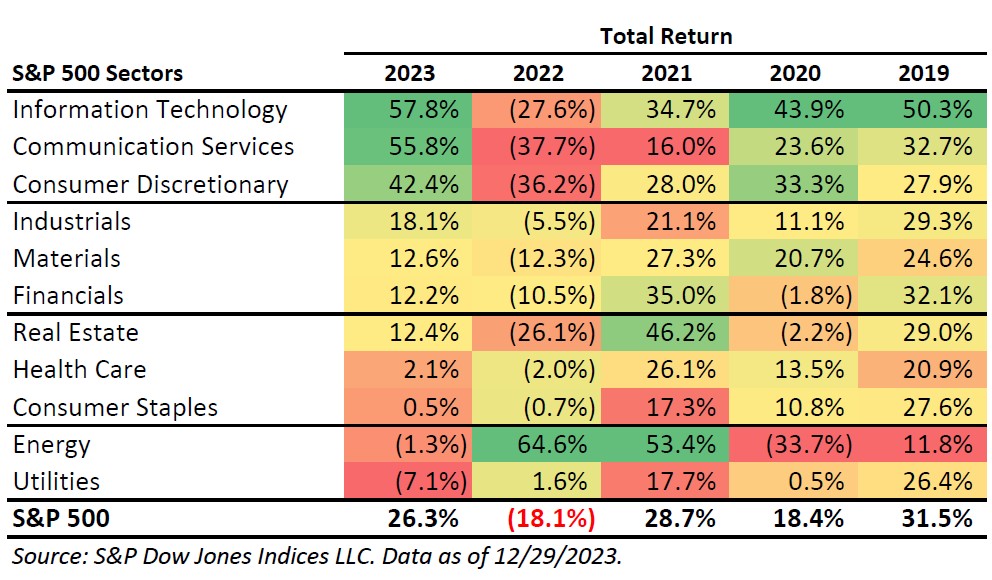
The table here displays the annual returns for the S&P 500 select sectors, ranked by their 2023 performance. We have color coded the returns for each year so that the best-performing groups are bright green while the weakest groups are a vibrant red. The color scaling allows you to more easily see how fortunes of the sectors have flipped from year to year.
The energy and utilities sectors were the only two sectors with negative returns during 2023 and they were the only two sectors to realize gains during 2022. As we have often observed, dramatic rotation occurs from year to year as leadership shifts along with the economic climate and investor sentiment. Information technology, communication services and consumer discretionary sectors dominated during 2023, as investors poured money into investments tied to artificial intelligence (AI) and confidence in the economy grew.
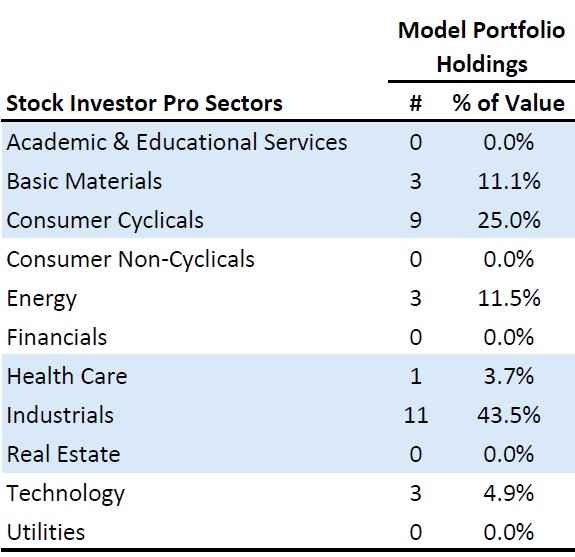
The Model Shadow Stock Portfolio uses a bottom-up quantitative approach to making stock additions and deletions. Financials and utilities are excluded from consideration. Financials are excluded because their balance sheet assets and liabilities are not well suited to analysis using the price-to-book-value (P/B) ratio. The sector makeup of the Model Shadow Stock Portfolio is not actively managed, yet it does impact the portfolio’s performance. The table below indicates the current composition of the portfolio using the sector designations provided by LSEG Data & Analytics and used in AAII’s Stock Investor Pro fundamental stock screening and research database. The portfolio is currently very heavily weighted toward industrials and consumer cyclicals (discretionary).
After the regional bank crisis in 2023, market leadership shifted back to large-cap growth companies. Large-company stocks have generally been the dominant segment over the last 10 years. As displayed in the table below, small-cap stocks were leaders only in 2016 and 2013.

Within the S&P indexes, the large-cap S&P 500 gained 26.3% during 2023, while the S&P MidCap 400 index gained 16.4% and the S&P SmallCap 600 index gained 16.1% during 2023.
Looking at the large-cap segment, growth stocks were up 30.0% for the year, after gaining 3.7% during December. Large-cap value stocks were up 22.2% for 2023, after gaining 5.5% during December.
In the mid-cap segment, growth stocks were up 17.5% for the year, after gaining 7.4% during December. Mid-cap value stocks were up 15.4% for 2023, after gaining 10.2% during December.
Small-cap growth stocks were up 17.1% during 2023, after gaining 12.1% during December. Small-cap value stocks were up 14.9% during 2023 after gaining 13.4% during December.
Since its inception in 1993, the AAII Model Shadow Stock Portfolio has a compound annual average return of 13.8% versus the Vanguard 500 Index fund’s gain of 10.0% per year on average over the same period, and the Vanguard Small Cap Index fund’s (NAESX) average annual gain of 9.8%.
Twenty stocks met the initial selection criteria for the Model Shadow Stock Portfolio as of January 10, 2024, down from 24 passing stocks one month ago. AAII members can see and research which companies are currently passing the initial selection criteria in the Shadow Stock Ideas table on AAII.com. The list of new Shadow Stock Ideas is updated daily—Tuesday through Saturday.
Of the 20 qualifying companies, seven are currently held in the Model Shadow Stock tracking portfolio: Fonar Corp. (FONR), Hurco Companies Inc. (HURC), Key Tronic Corp. (KTCC), L.S. Starrett Co. (SCX), Natural Gas Services Group Inc. (NGS), Rocky Brands Inc. (RCKY) and StealthGas Inc. (GASS). Qualifying companies are those held in the Model Shadow Stock Portfolio that currently meet the initial addition rules. (They are designated as “currently qualifies” in the notes column of the Model Shadow Stock Portfolio table on AAII.com. However, if you go online, the notes may not match the list discussed here since the notes on the website table are dynamically updated daily.)
Friedman Industries Inc. (FRD) and Lakeland Industries Inc. (LAKE) came off the qualifying list when their price-to-book ratios went above 0.90. Rocky Brands started to qualify again when its price-to-book ratio dropped below 0.90. Saga Communications Inc. (SGA) came off the qualifying list when it lost an analyst estimate for the current quarter.
As of January 10, 2024, Escalade Inc. (ESCA) had the highest price-to-book ratio in the Model Shadow Stock Portfolio. Its ratio of 1.63 is above the 0.90 maximum value used for initially qualifying a stock for inclusion to the portfolio. However, stocks are not removed from the portfolio until their price-to-book ratio rises to three times the initial maximum value (2.70).
Global Ship Lease Inc. (GSL) had the highest market capitalization in the portfolio, with a value of $729.5 million as of January 10, 2024. The Model Shadow Stock Portfolio looks for stocks with a market cap (share price times shares outstanding) greater than $30 million but less than $300 million when adding stocks to the portfolio. Shadow stocks with a market cap three times the initial market-cap maximum ($300 million × 3 = $900 million) at the time of a quarterly review are removed from the portfolio, assuming there is a suitable replacement.
Click here to see the current addition and deletion rules for the portfolio.
The next quarterly review of the AAII Model Shadow Stock Portfolio will take place around the beginning of March 2023, after most of the holdings have announced their quarterly earnings. Any changes to the portfolio will be announced at the time they are made in a special Model Shadow Stock Portfolio Update email (sign up at www.aaii.com/email).
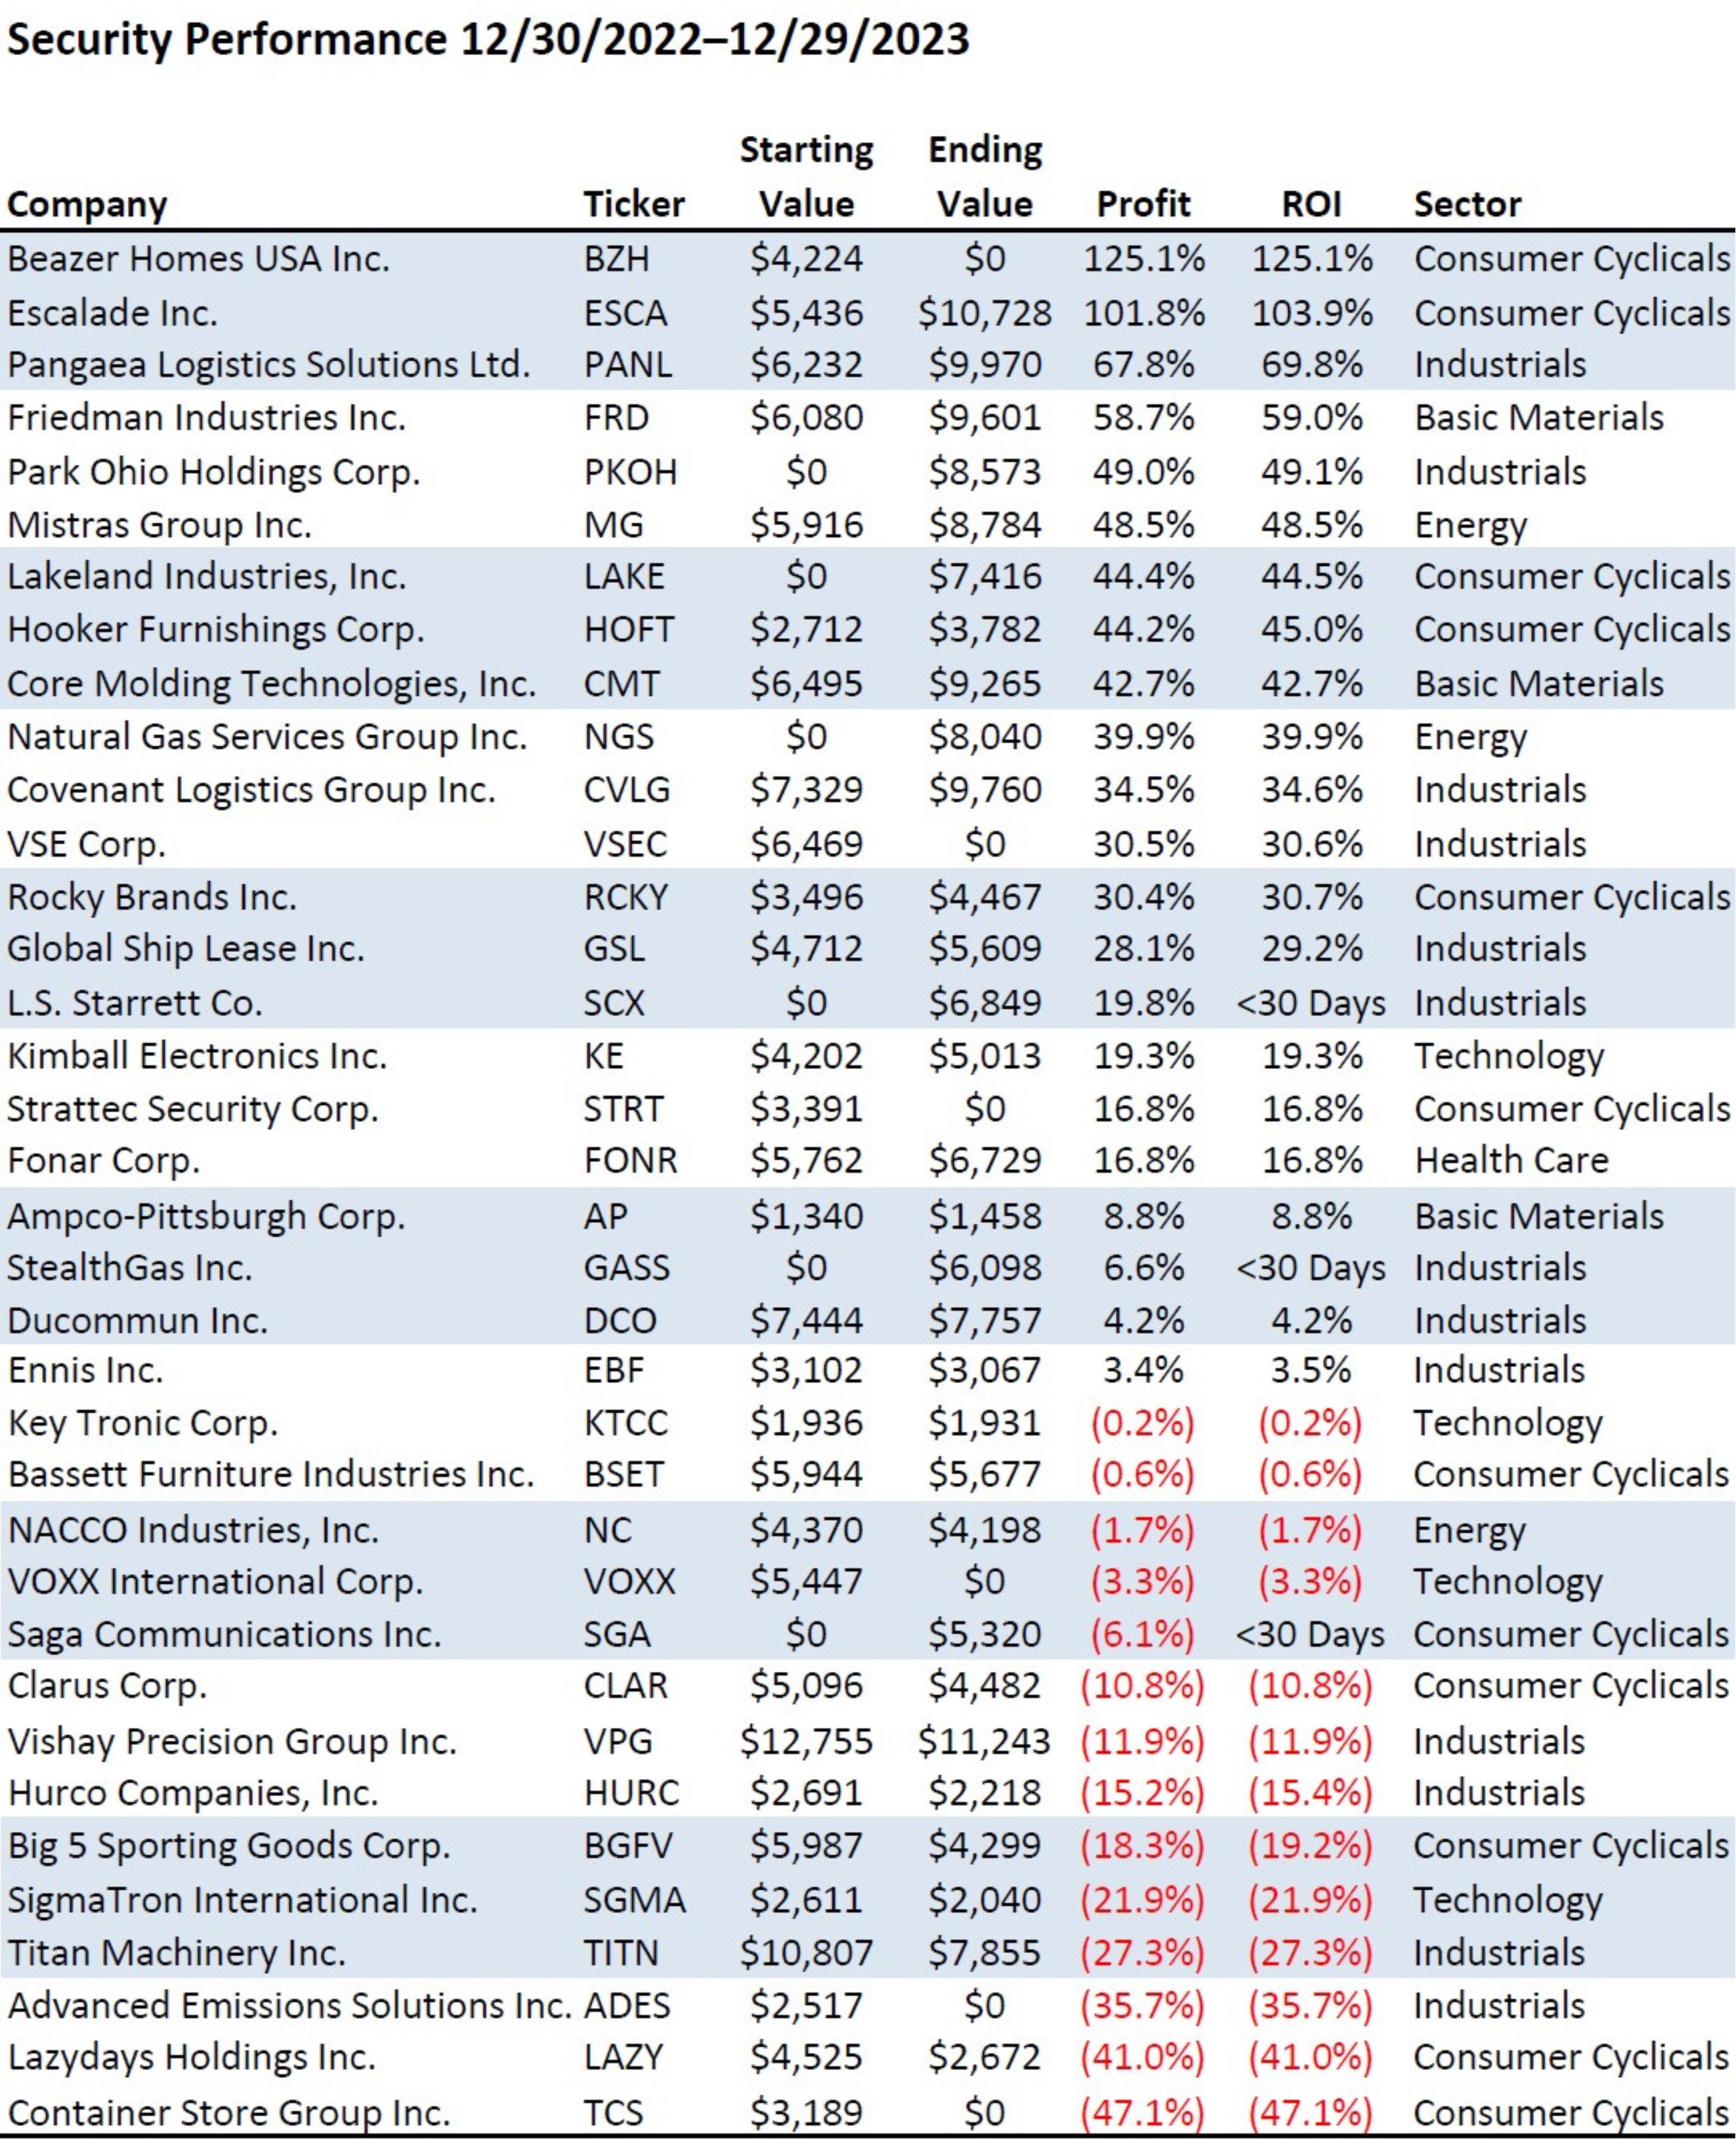
The final table below shows the 2023 performance of all the holdings within the Model Shadow Stock Portfolio during the year. If you see a value of zero at the start of the year, it indicates that the stock was added to the portfolio during 2023. An ending value of zero indicates that the holding was removed before the end of the year. We ended the year with 30 holdings but the portfolio held 36 stocks over the course of 2023. The turnover ratio was 18% in 2023, which translates to an average holding period of 5.7 years. The turnover ratio was a little lower than the long-term average of 25%, which equates to a four-year average holding period. Note that the turnover ratio is calculated by dollar value of additions and deletions and how they relate to the average portfolio value.
Homebuilders, transportation, mining and energy stocks were the best-performing stocks during 2023, while retailers and recreational manufacturers had the weakest performance in 2023. The profit and return on investment (ROI) columns both consider the impact of cash dividend distributions during the year.
In case you missed it, we held a webinar for members on Monday, January 8, where we delved into the Model Shadow Stock Portfolio’s annual performance, spotlighting key stocks. We also discussed 2023’s small-cap trends and answered member questions. To watch the recording, go to our Webinars page at AAII.com.
(12/29/2023)
Clarus finalized a deal to sell its precision sport segment, including Sierra Bullets and Barnes Bullets subsidiaries, to an undisclosed U.S. buyer for $175 million in cash. The transaction is scheduled to conclude in the first quarter of 2024, subject to customary closing conditions.
(01/05/2024)
Hurco Companies reported total revenue for fourth-quarter 2023 ended October 31 of $66.11 million, up 4.2% year over year. Net income for the quarter was $2.4 million, up 70% from one year ago. Earnings per diluted share were $0.36, up 63% from one year ago. Fiscal-year 2023 revenue totaled $227.8 million, a 9.1% decrease from fiscal-year 2022. Fiscal-year net income totaled $4.4 million, down 46% from fiscal-year 2022. Diluted earnings per share for fiscal-year 2023 were $0.66, compared to $1.23 per share reported in fiscal-year 2022.
(01/09/2024)
Key Tronic announced that starting June 30, 2024, Brett R. Larsen will take over from Craig D. Gates as president and CEO. Gates will officially retire from the company on June 30, 2024, but continue as a member of the board of directors. Larsen joined the company in May 2004 and has been the executive vice president of administration, CFO and treasurer since July 2015. Tony Voorhees, currently vice president of finance and controller, will step into Larsen’s position.
Lazydays Holdings, Inc. (GORV)
(01/02/2024)
Lazydays Holdings officially completed the closing of a $35 million mortgage loan facility, with funding provided by clients associated with Coliseum Capital Management. The facility is backed by mortgages on specific dealership facilities and land earmarked for future development. The loan carries a 12% interest rate and has a maturity date of December 2026.
Park-Ohio Holdings Corp. (PKOH)
(01/03/2024)
Park Ohio Holdings officially concluded the sale of its aluminum products business to Angstrom Automotive Group. Effective December 29, 2023, the completion involved a payment of approximately $50 million in cash and promissory notes, along with Angstrom Automotive assuming approximately $3 million in finance lease obligations.
(01/11/2024)
Titan Machinery officially completed the acquisition of the assets of Scott Supply Co. located in Mitchell, South Dakota. This acquisition encompasses a full-line dealership that includes Case IH and New Holland brand agricultural equipment.
 Get updates about the portfolio that has outperformed the market by 211.9%
since inception!
Get updates about the portfolio that has outperformed the market by 211.9%
since inception!