

John Bajkowski
is the president of AAII.
 AP
BSET
CVLG
DFSCX
EBF
GSL
HOFT
HURC
KE
KTCC
NAESX
PANL
PERI
RCKY
STRT
TITN
VFINX
VPG
VSEC
AP
BSET
CVLG
DFSCX
EBF
GSL
HOFT
HURC
KE
KTCC
NAESX
PANL
PERI
RCKY
STRT
TITN
VFINX
VPG
VSEC
The relatively volatile first quarter of 2022 resulted in deep declines across most stock segments during January and February, with a partial rebound in March. The Russia-Ukraine conflict, continued supply constraints, rising inflation and corresponding nominal interest rates seemed to weigh most heavily on the minds of investors.
The S&P 500 index underwent a correction in the first quarter of 2022 for the first time since the 2020 stock market decline brought about by the coronavirus pandemic. Many broader market segments recently observed even more severe and longer-lasting corrections.
As we have often noted, less-liquid micro-capitalization stocks typically go down more deeply during corrections, only to bounce back more strongly in the subsequent market upturn.
Generally, riskier and less-liquid assets are the stronger-performing groups during a recovery. During the financial crisis, the Model Shadow Stock Portfolio lost more than the large-cap S&P 500 (down 63.4% versus 51.0%) but recovered to its previous high more quickly (3.4 years versus 4.8 years). It is important to note that past patterns do not always repeat, but it is helpful to study historical patterns.
The Model Shadow Stock Portfolio has been in operation for just over 29 years. Its 14.5% annualized rate of return since inception is meaningfully greater than that of the Vanguard 500 Index fund  (VFINX), which gained 10.3% over the same time period, but that higher return has come with more frequent corrections and bear market periods for the Model Shadow Stock Portfolio.
We examined the monthly total returns of the Model Shadow Stock Portfolio along with the Vanguard 500 Index fund to gain a sense of the frequency, duration and severity of corrections and bear markets over its 29-year history.
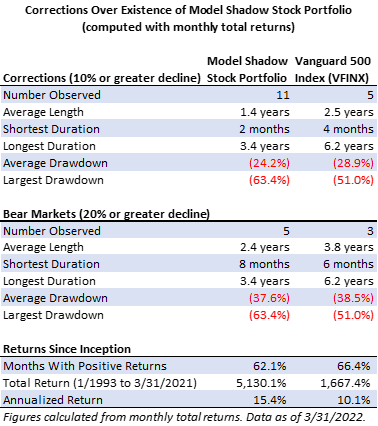
Drawdowns measure the severity of a loss. The drawdown is the decline from a prior high in portfolio or market value. Drawdowns reflect the total drop experienced during a bear market, but the duration is longer since the drawdown also reflects time needed before the full loss is recouped, not just when the downturn is reversed. For example, the Vanguard 500 Index fund hit bottom during March 2021, but it did not recoup its losses until June 2021.
Our analysis relied on monthly total-return data, which can mask some of the shorter-lived corrections that occur mid-month. For example, the S&P 500 correction that occurred on February 22, 2022, was not part of the monthly return data, which registered a combined 8.0% total-return loss for the Vanguard 500 Index fund in the first two months of 2022.
Corrections are generally classified as declines of 10% or greater. The Model Shadow Stock Portfolio has had 11 observed corrections, and five of them have turned into bear markets of 20% or greater. The average correction has been 1.4 years in length, with an average drawdown of 24.2%. The longest correction for the Model Shadow Stock Portfolio was 3.4 years and had a drawdown of 63.4% (July 2007 to November 2010).
Using monthly total-return data, the Vanguard 500 Index fund has had five observed corrections and three of them have gone on to become bear markets of 20% or greater. The average correction has been 2.5 years in length, with an average drawdown of 28.9%. The longest correction (September 2000 to October 2006) was 6.2 years, with a drawdown of 44.8%, but the greatest drawdown of 51.0% was with the 2007 bear market that lasted 4.8 years (November 2007 to July 2012).
The Model Shadow Stock Portfolio has more frequent corrections and bear market cycles than the S&P 500, but the down periods have generally been shorter in duration and bull market reversals stronger.
The Model Shadow Stock Portfolio lost 0.9% during March, bringing its year-to-date loss to 6.7%. In contrast, the S&P 500 as measured through the Vanguard 500 Index fund was up 3.7% in March and is down 4.6% year to date, while the Vanguard Small Cap Index fund (NAESX) gained 1.5% in March and is down 5.8% year to date through March. The DFA U.S. Micro Cap fund (DFSCX) was up 0.4% during March and is down 4.6% during the first quarter of the year.
The performance of growth- versus value-oriented stocks was slanted toward large-cap growth stocks during the month, but value stocks showed stronger relative performance within the mid- and small-cap segments of the domestic stock market.
In the large-cap segment, growth stocks were up 4.5% for the month, stemming their year-to-date loss of 8.6% for the first quarter 2022. Large-cap value stocks were up 3.0% during March and are now down just 0.2% year to date.
In the mid-cap segment, value stocks are down 0.6% for the year, after gaining 2.2% during March. Mid-cap growth stocks are down 9.1% for the year, after gaining 0.5% during the month.
Small-cap value stocks are down 2.4% year to date, while small-cap growth stocks are down 12.6% for the year. Small-cap value stocks gained 2.0% during March, while small-cap growth stocks gained 0.5% during the month.
Stocks in the energy (+37.7%), utilities (+4.0) and consumer staples (–1.6%) sectors are the best-performing groups in the market this year.
Sectors that are weakest this year include communication services (–12.1%), consumer discretionary (–9.2%) and information technology (–8.6%).
Only two sectors within the S&P 500 are up year to date, with a 49.8-percentage-point spread between the top- and bottom-performing groups.
Nineteen stocks met the initial selection criteria for the Model Shadow Stock Portfolio as of April 14, 2022, down from 21 passing stocks one month ago. AAII members can see and research which companies are currently passing the initial selection criteria in the Shadow Stock Ideas table on AAII.com. The list of Shadow Stock Ideas is updated daily—Tuesday through Saturday.
Of the 19 qualifying companies, six are currently held in the Model Shadow Stock tracking portfolio: Advanced Emissions Solutions Inc. (ADES), Covenant Logistics Group Inc. (CVLG), Fonar Corp. (FONR), Hurco Companies Inc. (HURC), Key Tronic Corp. (KTCC), and Strattec Security Corp. (STRT).
Qualifying companies are those held in the Model Shadow Stock Portfolio that currently meet the initial purchase rules. (They are designated as “currently qualifies” in the notes column of the Model Shadow Stock Portfolio table on AAII.com. However, if you go online, the notes may not match the list discussed here since the notes on the website table are dynamically updated daily.)
We have opened special interest groups in our online Community. There was a question in the Stock Screening Community that asked why we continue to hold stocks in the Model Shadow Stock Portfolio that no longer qualify for addition.
The answer to the great question is that behaviorally, investors tend to sell their winners too quickly and hold on to their losers too long. Price-to-book ratio, market cap and profitability are the primary drivers of the buy and sell decisions in the Model Shadow Stock Portfolio. Profitability is the most binary factor that drives buy and sell decisions, although we do wait for a second negative quarter of adjusted earnings per share before we sell for negative earnings.
The buy and sell rules of the Model Shadow Stock Portfolio look to identify very small companies with attractive valuations. The object is then to hold them as they grow larger and get discovered by Wall Street. Selling for valuation is not considered until the price-to-book ratio is three times the buy level, and selling for size is not considered until the stock has a market cap that is three times the current buy level. To help guard against stocks that are held too long without strong performance, stocks are sold after four years if they are not up at least 10% per year.
The range between a stock currently qualifying and being sold can be thought of as a hold range. The hold range is designed to let winners rise before selling them off.
These rules are suggested best practices and you are certainly free to modify them to suit your personal philosophy. Once you set your personal rules though, it is best not to keep changing them as a reaction to recent market activity, but instead to make any rule change because of a rational strategic shift.
SigmaTron International Inc. (SGMA) came off the list of qualifying stocks over the course of the month after it reported negative GAAP earnings per share during the quarter. As noted in the news section below, SigmaTron merged with Wagz Inc., which, under U.S. generally accepted accounting principles (GAAP), required SigmaTron’s previous investment in Wagz of $12.6 million to be recalculated to the fair value of $6.3 million resulting in a noncash impairment charge of $6.3 million. Refinitiv has adjusted normalized earnings per share of positive $0.29 for the quarter. This further illustrates why a company lacking the “currently qualifies” note should not be automatically considered a sell candidate.
Two current Model Shadow Stock Portfolio holdings started to pass the initial list of qualifying companies again—Covenant Logistics Group, which last qualified on October 31, 2019, and Hurco Companies, which last passed on February 11, 2022.
As of April 14, 2022, Perion Network Ltd. (PERI) had the highest price-to-book-value ratio in the Model Shadow Stock Portfolio. Its ratio of 1.90 is above the 0.90 maximum value used for initially qualifying a stock for inclusion in the portfolio. However, stocks are not removed from the portfolio until their price-to-book-value ratio rises to three times the initial maximum value (2.70). Vishay Precision Group Inc. (VPG) had the second-highest price-to-book ratio in the portfolio of 1.56, followed closely by Ennis Inc. (EBF) which is trading with value of 1.55.
Perion Network also had the highest market cap in the portfolio, with a value of $1,098.9 million as of April 14, 2022. The Model Shadow Stock Portfolio looks for stocks with a market cap (share price times shares outstanding) greater than $30 million but less than $400 million when adding stocks to the portfolio. Shadow stocks with a market cap three times the initial market cap maximum ($400 million × 3 = $1,200 million) at the time of a quarterly review are removed from the portfolio, assuming there is a suitable replacement. No other Model Shadow Stock holdings are trading with market caps above $1 billion. Global Ship Lease Inc. (GSL) is the closest with a market cap of $875.5 million.
Click here to see the current purchase and sell rules for the portfolio.
The next quarterly review of the AAII Model Shadow Stock Portfolio will take place around the beginning of June 2022, after most of the holdings have announced their quarterly earnings. Any changes to the portfolio will be announced at the time they are made in a special Model Shadow Stock Portfolio Update email (sign up at www.aaii.com/email).
Kimball Electronics Inc. (KE) was the top-performing stock in the portfolio for March, up by 16.0%. There was no company-specific news during the month. Kimball Electronics’ March performance is a reverse of its performance in February.
Global Ship Lease Inc. (GSL) was the runner-up for the month, up by 10.4%. The company was up on positive numbers and news from its most recent quarterly report, detailed below.
Dixie Group Inc. (DXYN) was the worst-performing stock in the portfolio in March, down by 23.8%. The company reported several setbacks in its most recent quarter. Details from its report are below.
SigmaTron International Inc. (SGMA) was the second-worst performing stock in the portfolio in March, down by 16.1%. The company reported negative numbers in its most recent quarterly report, detailed below.
Here are some news highlights from March for the holdings in the Model Shadow Stock Portfolio:
Advanced Emissions Solutions Inc. (ADES) reported that fourth-quarter 2021 net income was $5.8 million, compared to $0.4 million for the fourth quarter of 2020. Revenue was $25.8 million, reflecting a year-over-year increase from $19.7 million the year before. Adjusted earnings before interest, taxes, depreciation and amortization (EBITDA) for the quarter was $1.9 million, down from $2.3 million the year before.
“The strong demand environment for our APT [advanced purification technology] segment persisted through the end of the year and drove a 45% increase in segment revenue in the fourth quarter compared to the prior year,” said CEO Greg Marken. “Continued high prices for alternative energy sources such as natural gas, coupled with the cold winter months, along with fully implementing the Cabot supply agreement, are supporting strong performance for the APT segment and delivering better gross margin leverage compared to 2020.”
Ampco-Pittsburgh Corp. (AP) reported a fourth-quarter 2021 loss of $0.65 per share. Revenue was $84.5 million, reflecting a 2.9% year-over-year increase. Despite the disappointing quarter in terms of profit, full-year 2021 sales grew by 5% year over year. Net loss was $12.3 million for the fourth quarter.
“We are pleased with the continuing improvement in our backlog, a 19% increase from a year ago,” said CEO Brett McBrayer. “Inflationary cost pressures, however, contributed significantly to our disappointing fourth-quarter results. In October and November, we announced major price increase actions for rolls and forged engineered products which are now implemented.
“We raised base prices and expanded surcharge coverage beyond raw materials to include relevant energy and transportation costs. We expect these actions will begin to restore margins during Q1 2022 with a full benefit expected by Q2 2022.”
Bassett Furniture Industries Inc. (BSET) reported first-quarter 2022 earnings of $0.44 per share, beating the I/B/E/S consensus estimate by $0.08 per share. Revenue was $117.9 million, reflecting a 3.69% or $8.0 million year-over-year increase from the year before.
CEO and chair Robert Spilman Jr. gave his thoughts on the results, “Although incoming wholesale orders remained relatively strong for our first quarter of 2022, we began to make progress in reducing the enormous backlog that has ballooned during the 18 months of the pandemic that preceded the start of our fiscal year.”
Additionally, earlier in the month Bassett Furniture declared a quarterly dividend of $0.14 per share, payable on May 27 to shareholders on record by the end of the business on May 13.
Big 5 Sporting Goods Corp. (BGFV) reported fourth-quarter 2021 earnings of $0.89 per share, beating the I/B/E/S consensus estimate by $0.04 per share. Revenue was $273.36 million, reflecting a 5.9% decline but beating expectations by $3.91 million year over year.
Net income for the quarter was $19.9 million. Adjusted EBITDA was $31.5 million for the quarter and $152 million for the entire year. The company ended the year with no debt on its balance sheet and around $97.4 million in cash and cash equivalents.
“Our fourth-quarter performance capped off a second consecutive record year of sales and earnings,” said chair, president and CEO Steven Miller. “In addition to strong top line sales, our 2021 results were driven by continued expansion of our merchandise margins, which reflected robust consumer demand, a constrained supply chain and a reduction in our promotions compared to pre-pandemic periods. With our strong earnings performance over the course of 2021, we enhanced our balance sheet while providing more than $69 million of capital back to shareholders through dividends and stock repurchases.”
Additionally, earlier in the month Bassett Furniture declared a quarterly dividend of $0.25 per share, payable on March 25 to shareholders on record by the end of the business day on March 11.
Dixie Group Inc. (DXYN) reported net income for the quarter of $1.6 million. Income from continuing operations was $5.2 million. Last in, first out (LIFO) reserve inventory increased by $16.2 million for the year. Full-year 2021 earnings per share were $0.09. Revenue was $341.24 million, reflecting a 36.0% year-over-year increase.
Chair, president and CEO Daniel Frierson said the company was impacted by a ransomware attack and a shift in the fiber supply market.
Ennis Inc. (EBF) declared a $0.25 per share quarterly dividend payment, in line with previous declarations. The dividend is payable on May 9 to shareholders of record as of April 18.
Global Ship Lease Inc. (GSL) reported fourth-quarter 2021 earnings of $1.84 per share, beating the I/B/E/S consensus estimate by $0.58 per share. Revenue was $153.5 million, reflecting a 119.4% or $28.47 million year-over-year increase.
Net income for the quarter was $66.1 million. Adjusted EBITDA was $85.4 million for the quarter. The company ended the year with no debt on its balance sheet and around $97.4 million in cash and cash equivalents.
“Supply and demand fundamentals in the containership sector look set to remain positive through at least the medium term, with congestion expected to be a continuing feature and large retail inventory restocking needs representing a substantial incremental contributor to overall demand,” said chair George Youroukos.
Hooker Furniture Corp. (HOFT) announced a quarterly dividend payment of $0.20 per share, in line with previous declarations. The dividend was paid on March 31, to those on record as of March 17.
Pangaea Logistics Solutions Ltd. (PANL) reported fourth-quarter 2021 earnings of $0.56 per share, beating the I/B/E/S consensus estimate of $0.53 per share. Earnings increased year over year from $0.14 per share. Fourth-quarter 2021 income from operations increased year over year by 271% to $30.8 million.
Rocky Brands Inc. (RCKY) reported fourth-quarter 2021 earnings per diluted share of $1.86, which increased year over year from $1.41 adjusted earnings per diluted share reported in the fourth quarter of 2020. Earnings beat the I/B/E/S consensus estimate of $0.95 per share by 95.8%. Rocky Brands reported quarterly sales of $169.5 million, year-over-year growth of 93.4%. Quarterly sales beat the I/B/E/S consensus estimate by 3.9%.
“There were many highlights from 2021 led by sustained demand for our brands and products and a transformational acquisition that significantly enhanced our size and brand portfolio,” said chair, president and CEO Jason Brooks. “While we encountered fulfillment challenges starting in the third quarter that pressured margins and hindered our ability to deliver a portion of orders on time, we have since made good progress regaining efficiencies in our Ohio distribution center and bringing our new Reno, Nevada, distribution center online.”
SigmaTron International Inc. (SGMA) reported a fourth-quarter 2021 loss per diluted share of $0.58, a significant year-over-year decrease from earnings of $0.06 per share. SigmaTron reported $93.7 million in sales, increasing year over year by 31.0%. Recently, the company agreed to a merger with Wagz Inc. which, under U.S. generally accepted accounting principles (GAAP), required SigmaTron’s previous investment in Wagz of $12.6 million to be recalculated to the fair value of $6.3 million resulting in a noncash impairment charge of $6.3 million.
“I’m pleased to report another strong quarter in terms of revenue and operating results. This was especially pleasing as our third quarter has historically been somewhat slower than other quarters because of the holiday period,” said chair and CEO Gary Fairhead. “In addition, the third quarter results include one month of operations for Wagz which, as an emerging company, is currently running at a monthly loss, which is expected.”
Titan Machinery Inc. (TITN) reported fourth-quarter 2022 financial results. The company reported diluted earnings per share of $0.99, beating the I/B/E/S consensus estimate of $0.54 per share by 84%. Revenue for the quarter totaled $507.6 million, a 16.2% increase over the same period of 2021. Gross profit for the quarter was $94.2 million, up 39.7% from $67.4 million reported in the comparable period. Net income for the quarter was $22.3 million, an increase of 0.65%.
I/B/E/S consensus estimates project the company to earn $2.84 per share for fiscal 2023, similar to the results seen in fiscal 2022.
VSE Corp. (VSEC) announced fourth-quarter 2021 financial results. The company reported diluted earnings per share for the quarter of $0.53, missing the I/B/E/S consensus estimate of $0.76 per share by 30.4%. Revenue for the quarter totaled $210 million, a 40.1% increase over the $150 million reported in the comparable period of 2020.
Operating profit for the quarter was $10.7 million, a 10% decline over the same period of 2020. Adjusted net income for the quarter equaled $6.7 million, an increase of 17% year over year.
“2021 was a year of strong progress for VSE as we continued to execute on our multi-year business transformation plan to develop a market-leading, global aftermarket distribution and service solutions company,” stated president and CEO John Cuomo. “Last year, we moved closer to the end-user, strengthened relationships with our supplier partners, and identified new methods to solve complex customer problems.
The company also declared a regular cash dividend of $0.10 per share. The dividend is payable on May 18, to shareholders of record as of the close on May 4. The stock will trade ex-dividend on Tuesday, May 17.
 Get updates about the portfolio that has outperformed the market by 211.9%
since inception!
Get updates about the portfolio that has outperformed the market by 211.9%
since inception!