


John Bajkowski
is the president of AAII.
While the S&P 500 index continued its winning ways in January, the rest of the market generally suffered losses during the month. The market rally was again confined to the Magnificent Seven technology stocks, which accounted for 45% of the S&P 500 return, according to S&P senior index analyst Howard Silverblatt. If you exclude the performance of Tesla Inc.  (TSLA), which stumbled in January, the other six stocks accounted for 71% of the S&P 500 return.
The Model Shadow Stock Portfolio was down 2.1% during January, compared to a 1.7% gain for the S&P 500, a 1.8% loss for the S&P MidCap 400 index and a 4.0% loss for the S&P SmallCap 600 index. While the S&P 500 managed to hit new highs during January, the number of declining issues outnumbered the number of advancing issues, and the ratio was weaker for smaller companies. Only 140 companies in the S&P SmallCap 600 were up during January, while 459 companies were down. Within the Model Shadow Stock Portfolio, 10 holdings were up for the month, while 19 were down.
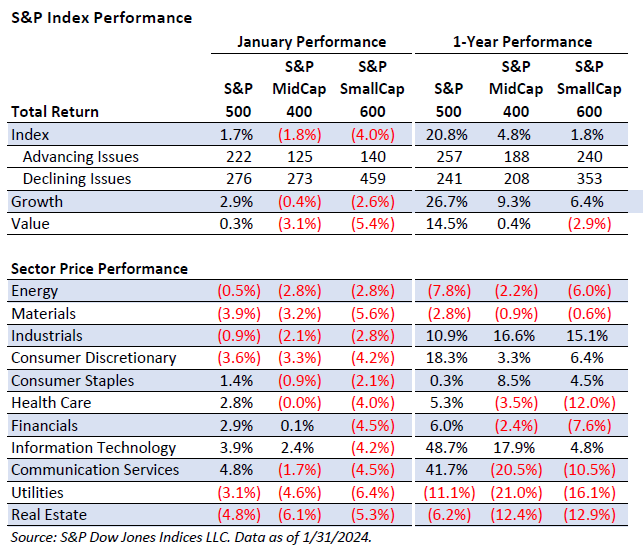
Continued strong economic growth contributed to an understanding that the Federal Reserve likely will not start cutting interest rates this spring. In the large-cap segment, value stocks were up 0.3% for the month, while growth was up 2.9%. Over the last year, large-cap value stocks are up 14.5%, compared to a return of 26.7% for large-cap growth stocks.
During January, mid-cap value stocks lost 3.1% and mid-cap growth stocks lost just 0.4%. Mid-cap value stocks are up just 0.4% over the last year, while mid-cap growth stocks are up 9.2%.
Small-cap value stocks are down 2.9% over the last year, while small-cap growth stocks are up 6.4%. Small-cap value stocks lost 5.4% during January and small-cap growth stocks lost 2.6%.
The Model Shadow Stock Portfolio lost 2.1% for the month and is up 3.9% over the last year. The Vanguard Small Cap Index fund (NAESX) lost 2.6% during January and is up 4.4% over the last year.
Since its inception in 1993, the AAII Model Shadow Stock Portfolio has a compound annual average return of 13.6%, versus the Vanguard 500 Index fund’s (VFINX) gain of 10.1% per year on average over the same period. Over the same period, the Vanguard Small Cap Index fund posted an average annual gain of 9.7%.
Only five of the sectors in S&P 500 were up during January, compared to 10 out of 11 during December. There was a wide difference of 9.6 percentage points between the best-performing sector, communication services (+4.8%), and the weakest sector, real estate (–4.8%). In the mid-cap segment, the only sectors up during January were information technology (+2.4%) and financials (+0.1%). No sectors were up during January among small caps.
Overall, the top-performing sectors during January within the large-cap segment were communication services (+4.8%), information technology (+3.9%) and financials (+2.9%). Within the S&P SmallCap 600, the best-performing sectors were consumer staples (–2.1%), energy (–2.8%) and industrials (–2.8%).
With a mixed start to 2024, how does the adage “as goes January, so goes the year” apply to the Model Shadow Stock Portfolio? A strong January in 2023 held true for the year as a whole, but not without strong movement during the year.
Yale Hirsch, the founder of the Stock Trader’s Almanac, first documented this January observation in 1972 based on a study of the S&P 500 since 1950. The Stock Trader’s Almanac refers to this as the January Barometer and notes in the 2023 edition that since 1950 this barometer has only had 12 major errors and eight flat-year errors (less than +/– 5%) for an accuracy ratio of 72%.
The Model Shadow Stock Portfolio lost 2.1% in January, after being up 20.8% during 2023. In contrast, the S&P 500 as measured by the Vanguard 500 Index fund gained 1.7% in January after returning 26.1% during 2023. The two are flashing different signals for 2024.
Small-cap stocks, such as those held in the Model Shadow Stock Portfolio, often move in a cycle slightly different than that of the large-cap S&P 500, so we thought it might be interesting to update our table of the January Barometer for the Model Shadow Portfolio that first appeared in the April 2023 issue of AAII Journal.
The table displays the year-by-year performance for both the Model Shadow Stock Portfolio and the S&P 500, as measured by the Vanguard 500 Index fund, coupled with our analysis of the January Barometer.

One issue with the barometer is that the annual price performance presented in the Stock Trader’s Almanac includes the performance during January. We present four columns of data in the table for each portfolio. The first column for each investment displays its total-return performance for the whole year. The next column simply notes if the model portfolio or Vanguard 500 Index fund had a negative January return for a given year. The next two columns make an adjustment based upon the January performance. For the third columns, we skip the entire year if the given portfolio was down during January. For the last column, we assume that you are always invested during January, and then that you are invested for the rest of the year if January was up or not invested if January was down.
Overall, the Model Shadow Stock Portfolio had 13 losses during January, compared to 13 for the Vanguard 500 Index fund. However, comparing the second columns in the table reveals that for over one-third of the years, the January signal is different for the two investments. This confirms how differently the portfolio and index can behave over time.
The third and fourth columns seek to answer the question of whether you could have benefited from acting on the January Barometer with the Model Shadow Stock Portfolio. Unfortunately, over the last 31 years, the market moves were such that any advantages gained through the January Barometer were outweighed by the misses of either being out of the market when the market was strong after a weak January or suffering losses for the given year after a positive January.
For the Model Shadow Stock Portfolio, some of the most impactful misses occurred during the financial crisis and the years that followed. The Model Shadow Stock Portfolio gained 1.9% in January 2008, only for the portfolio lose 50.8% for the year. The next year, the Model Shadow Stock Portfolio lost 0.6% during January, while the portfolio gained 72.3% during 2009.
Overall, the Model Shadow Stock Portfolio has a compound annual gain of 13.6% over its full history. Following the January Barometer and being out of the market in the years January was down would have actually lowered the compound annual return to 11.3%. Staying invested during January and then going into cash for the remainder of the year when January performance was negative would have reduced the performance even further to 9.6%.
The Vanguard 500 Index fund had a total return of 10.1% being fully invested. Following the January Barometer and being out of the market in the years January was down would have lowered the compound annual return to 8.9%. Staying invested during January and then going into cash for the remainder of the year when January performance was negative would have reduced the performance even further to 7.2% for the Vanguard 500 Index fund.
The January Barometer is different from the January effect, during which small out-of-favor companies often perform strongly during January. The other thing to keep in mind is that these returns ignore the impact of swiftly buying and selling the type of less-liquid stocks that constitute the Shadow Stock universe.
The Shadow Stock approach is best suited for the investor willing to take a longer-term perspective and capable of withstanding the greater volatility of smaller-company stocks, which will likely undergo periods of underperformance.
Even with the market weakness last month, fewer companies passed the initial Shadow Stock screen this month. Nineteen stocks met the initial selection criteria for the Model Shadow Stock Portfolio as of February 12, down from 20 passing stocks last month. AAII members can see and research which companies are currently passing the initial selection criteria in the Shadow Stock Ideas table on AAII.com. The list of new Shadow Stock Ideas is updated daily—Tuesday through Saturday.
Of the 19 qualifying companies as of February 12, 2024, eight are currently held in the Model Shadow Stock tracking portfolio: Big 5 Sporting Goods Corp. (BGFV), Fonar Corp. (FONR), Hurco Companies Inc. (HURC), Key Tronic Corp. (KTCC), L.S. Starrett Co. (SCX), Natural Gas Services Group Inc. (NGS), Saga Communications Inc. (SGA) and StealthGas Inc. (GASS). Qualifying companies are those held in the Model Shadow Stock Portfolio that currently meet the initial purchase rules. They are designated as “currently qualifies” in the notes column of the Model Shadow Stock Portfolio table on AAII.com. However, if you go online, the notes may not match the list discussed here since the notes on the website table are dynamically updated daily.
During the month, eight stocks in the Model Shadow Stock Portfolio qualified, one stopped meeting the initial rules for qualification and one started to meet the qualification rules again.
Rocky Brands Inc. (RCKY) came off the qualifying list during the last month when its price-to-book-value (P/B) ratio moved above 0.90 to 1.02.
Big 5 Sporting Goods had positive earnings for the last quarter and trailing four quarters. To initially qualify, companies cannot have negative quarterly earnings.
The Model Shadow Stock Portfolio looks for stocks with a market capitalization (share price times shares outstanding) less than $300 million. Shadow stocks with a market cap three times the initial market cap maximum—$900 million ($300 million × 3)—at the time of a quarterly review are removed from the model portfolio, assuming there is a suitable replacement. As of February 12, 2024, Ducommun Inc. (DCO) had market cap of $733.0 million.
As of February 12, 2024, Covenant Logistics Group Inc. (CVLG) had the highest price-to-book-value (P/B) ratio in the Model Shadow Stock Portfolio. Its ratio of 1.78 is well above the 0.90 maximum value used for initially qualifying a stock for inclusion to the portfolio. However, stocks are not removed from the portfolio until their price-to-book ratio rises to three times the initial maximum value, 2.70 (0.90 × 3). It may help you to think about values below 0.90 as being attractive, while those three times above the initial value are expensive. Allowing the price-to-book ratio to expand for stocks that you own allows your winners to run up a little, since the price-to-book ratio typically gets richer as the stock price goes up. The initial price-to-book level is adjusted over time to reflect the changing market conditions, and we are examining the valuation and size limits for the next quarterly portfolio review.
Click here to see the current addition and deletion rules for the portfolio.
The next quarterly review of the AAII Model Shadow Stock Portfolio will take place around the beginning of March 2024, after most of the holdings have announced their quarterly earnings.
Only a handful of companies in the Model Shadow Stock Portfolio have reported quarterly earnings so far, as noted in the News section below. If a company in the tracking portfolio reports trailing 12-month earnings from continuing operations that are negative, the stock is placed on probation; if a subsequent quarter has negative earnings prior to trailing 12-month earnings becoming positive, the stock is removed. When available, adjusted (non-GAAP) earnings are used to put stocks on probation or delete them. These are earnings that have been adjusted to eliminate the impact of nonrecurring events such as markdown of inventory or goodwill. These are earnings reported in the media and firms reporting consensus estimates. The LSEG I/B/E/S adjusted earnings reported in AAII’s Stock Investor Pro are used for Model Shadow Stock Portfolio decisions when they are available.
Bassett Furniture Industries Inc. (BSET) just went on earnings probation when it reported a quarterly loss of $0.47 per share, which pushed its trailing 12-month earnings per share into the red.
If there any changes to the model portfolio, they will be announced at the time with a special Model Shadow Stock Portfolio Update email (sign up at www.aaii.com/email).
Bassett Furniture Industries, Incorporated (BSET)
(01/25/2024)
Bassett Furniture Industries reported a fourth-quarter 2023 GAAP earnings loss of $0.47 per share, missing the LSEG I/B/E/S consensus estimate of a loss of $0.055 per share. Total revenue decreased 21.8% from the prior-year quarter to $94.7 million. The company recorded a loss for the quarter due to a noncash goodwill impairment charge of $5.4 million. The charge came from financial performance “well below the original projections” from Noa Home Inc. Consolidated sales fell by 21.7%, resulting in significantly reduced operating results, and the comparison to last year’s pandemic-fueled results highlighted the company’s poor performance this quarter. However, Bassett Furniture improved its quarterly gross margin to 54.3% and produced an operating profit for the period if the goodwill impairment charge is not considered.
CEO Robert H. Spilman Jr. remains optimistic about the future of home furnishings as millennial household formation unfolds. He attributed the company’s weak results to the difficult period after the post-pandemic boom. Spillman stated that the company will focus its attention on product innovation, improving sales technology, updating its stores, enhancing margins, bringing in new talent and carefully managing its balance sheet.
Big 5 Sporting Goods Corporation (BGFV)
(01/17/2024)
Big 5 Sporting Goods reported exclusively on sales results for fourth-quarter and full-year 2023, with net sales of $196.3 million compared to $238.3 million in the prior-year quarter. Same-store sales decreased 17.7% and merchandise margins decreased 43 basis points (bps) from the prior-year quarter. The warm weather in 2023 and lack of snow weighed heavily on the company’s sales of winter products. For full-year 2023, net sales were $884.7 million compared to $995.5 million for 2022. Same-store sales decreased 11.2% and merchandise margins stayed flat compared to the prior year.
Regarding earnings, the company expects to report an earnings loss in the range of $0.38 to $0.40 per share for the fourth quarter. This compares to the previous guidance for a fourth-quarter loss in the range of $0.20 to $0.35 per share. For 2023, the company now expects to report a loss in the range of $0.30 to $0.32 per share.
Covenant Logistics Group, Inc. (CVLG)
(01/23/2024)
Covenant Logistics Group reported fourth-quarter 2023 non-GAAP earnings per share of $1.07, in line with the LSEG I/B/E/S consensus estimate. Full-year 2023 total revenue decreased 9.3% from the prior year to $1.1 billion. This decrease may have been driven by the challenging freight market. Asset-based segments contributed approximately 67% of revenue, while the company’s asset-light segments contributed approximately 33%.
(02/15/2024)
Ducommun reported fourth-quarter 2023 non-GAAP earnings per share of $0.70, missing the LSEG I/B/E/S consensus estimate of $0.625 by 12.0%. Total revenue increased 2.1% from the prior-year quarter to $192.9 million. This increase was primarily due to a $12.1 million rise in its commercial aerospace markets, driven by higher build rates on large and rotary-wing aircraft platforms, somewhat balanced by declines in other commercial aerospace areas.
The company reported full-year 2023 record revenue of $757 million, beating the previous level set in 2012. Diluted earnings per share were $1.14, compared to $2.33 per share in full-year 2022.
Chairman, president and CEO Stephen G. Oswald commented that Ducommun’s strong performance was driven by strong commercial aerospace market recovery, along with a solid year-end backlog of $994 million and optimistic outlook for 2024 driven by high order bookings and increased production rates from Boeing and Airbus.
(02/14/2024)
Fonar reported second-quarter 2024 GAAP earnings per share of $0.54. Total revenue increased 4.5% from the prior-year quarter to $25.4 million.
President and CEO Timothy Damadian announced a record scan volume at Health Management Company of America MRI centers for the quarter, with a 12.8% increase in MRI scan volume driven by new centers and the return to normal hours from pandemic hours. He also noted the buyback of 218,656 shares for $3.6 million under a stock repurchase plan and expressed optimism for full-year 2024, emphasizing expansion as a growth strategy.
Friedman Industries, Incorporated (FRD)
(02/14/2024)
Friedman Industries reported third-quarter 2024 GAAP earnings per share of $0.16. Total revenue increased 3.7% from the prior-year quarter to $115.9 million. Sales volume increased 11% compared to the prior-year quarter.
President and CEO Michael J. Taylor reported that higher hot rolled coil prices improved the gross margin to 9.0%. This was partly offset by downside hedging, with a substantial inventory value increase expected in fourth-quarter 2024 and increased sales volume indicating positive trends toward maximizing facility utilization. Friedman Industries expects a strong full-year 2024, with solid margins and a substantial increase in hot rolled coil prices. Sales volume is expected to slightly increase.
Kimball Electronics, Inc. (KE)
(02/05/2024)
Kimball Electronics reported second-quarter 2024 adjusted earnings per share of $0.33, missing the LSEG I/B/E/S consensus estimate of $0.402 per share by 18.2%. This was a 25% decrease from the prior-year quarter. Net sales were $421.2 million, a 3.5% decline compared to the prior-year quarter. Operating income was $16.6 million, a 5% decrease from one year ago. Net income was $8.3 million, down 22.6% from the previous year.
Lakeland Industries, Inc. (LAKE)
(02/05/2024)
Lakeland Industries announced the acquisition of Italy and Romania-based Jolly Scarpe S.p.A. and Jolly Scarpe Romania S.R.L. in an all-cash transaction valued at approximately $9.3 million subject to post-closing adjustments. Lakeland Industries CEO Jim Jenkins stated that the company expects these acquisitions to add $14 million to $16 million of sales revenue to the current fiscal year, and earnings will be immediately accretive.
Lazydays Holdings, Inc. (GORV)
(01/17/2024)
Lazydays Holdings announced a rebranding campaign, including new logos, colors and fonts. In addition, the stock changed its ticker symbol from LAZY to GORV.
Natural Gas Services Group, Inc. (NGS)
(02/01/2024)
Natural Gas Services announced the appointment of Justin Jacobs as its new CEO, effective February 12. Jacobs will be taking over the position from Stephen Taylor, who has been serving as interim CEO. While Taylor will continue as the board chairman, he will also offer transition services for a period of six months, aligning with his retirement agreement. Jacobs comes to Natural Gas Services from investment firm Mill Road Capital, where he held the role of managing director.
Vishay Precision Group, Inc. (VPG)
(02/14/2024)
Vishay Precision Group reported fourth-quarter 2023 revenue of $89.5 million, a 7.0% decrease year over year. Net income was $8.2 million, a decrease of 21.0% from one year ago. Earnings were $0.61 per share, an increase of 31.1% year over year. This beat the LSEG I/B/E/S consensus estimate of $0.360 per share by 69.4%.
CEO Ziv Shoshani commented that based on constant exchange rates from the quarter, the company anticipates net revenues for first-quarter 2024 within the range of $80 million to $90 million.
 Get updates about the portfolio that has outperformed the market by 211.9%
since inception!
Get updates about the portfolio that has outperformed the market by 211.9%
since inception!