


John Bajkowski
is the president of AAII.
After the quarterly review of the Model Shadow Stock Portfolio at the beginning of March, one stock is being removed and one stock is being added.
Investor sentiment continues to be positive with interest primarily focused on growth-oriented companies. The S&P MidCap 400 index led the market during February with a 5.9% gain, outpacing the 5.3% return of S&P 500 index and 3.3% gain of the S&P SmallCap 600 index. The Model Shadow Stock Portfolio was down slightly, giving up 0.4% during February.
Small-cap stocks continue to lag larger companies on a trailing 12-month basis. The S&P SmallCap 600 is up 6.5% over the last year, compared with a 13.0% gain for the S&P MidCap 400 and a 30.4% gain for the S&P 500. The Model Shadow Stock Portfolio is up 3.5% over the last year.
Small-cap value stocks are back in positive territory over the last year, up 1.1%, while small-cap growth stocks are up 11.9%. Small-cap value stocks gained 2.3% during February and small-cap growth stocks gained 4.3%.
Mid-cap value stocks are up 5.2% over the last year, compared to a 20.9% gain for mid-cap growth stocks. During February, mid-cap value stocks were up 1.9% and mid-cap growth stocks gained 9.7%.
In the large-cap segment, growth stocks were up 7.3% for the month, while value was up 3.1%. Over the last year, large-cap growth stocks are up 38.6%, compared to a return of 21.7% for large-cap value stocks.

Advancing issues managed to outpace declining issues across all market segments, but the ratio of advancing issues to declining issues was strong with larger companies. Within the S&P 500 there were 350 advancing issues compared to 149 declining issues—a ratio of 2.35. The ratio was 1.93 in the S&P MidCap 400 and 1.44 for the S&P SmallCap 600. Looking back one year, there are more declining issues compared to advancing issues within the S&P SmallCap 600, while the ratio of advancing issues to declining issues is positive 1.77 for S&P 500 constituents.
All 11 of the sectors in the S&P 500 were up during February, compared to five out of 11 during January. The difference between the best- and worst-performing sector narrowed slightly during February: 8.1 percentage points compared to 9.6 percentage points last month. Utilities was the weakest sector, up 0.5% during the month, while consumer discretionary was the strongest with an 8.6% gain. Consumer spending continues to help drive the economy upward. It was interesting that consumer staples was the strongest sector within the MidCap 400, while the communications services sector was the weakest with a decline of 6.3% during February. Consumer discretionary was the top performer in the S&P SmallCap 600 with a 7.4% gain, while utilities were the weakest with a 2.7% loss.
Information technology continues to be the leading sector for the year with a 57.5% gain, followed closely by communication services (up 57.0%) and consumer discretionary (up 31.4%). There is only one sector within the S&P 500 in the red over the last year: utilities, down 4.6%. Other weak sectors include energy and real estate, both up 2.4% over the last year.
Small-cap stocks remain attractively priced relative to large-cap stocks. The median price-to-book-value (P/B) ratio of the companies in the S&P SmallCap 600 is 1.75, well below the 3.49 median price-to-book ratio for the companies in the S&P 500. The S&P SmallCap 600 normally trades at a discounted multiple relative to the S&P 500. The discount has averaged 0.66 since 1998 and is currently 0.50. The stocks in the Model Shadow Stock Portfolio are even cheaper, with a median price-to-book value of 0.92.
Attractive relative valuation comparisons of small-cap stocks also hold true if price-earnings (P/E) ratios are considered. The median price-earnings ratio of the companies in the S&P SmallCap 600 is 18.2, below the 25.3 median ratio for the companies in the S&P 500. Stocks in the S&P SmallCap 600 are trading with a median price-earnings ratio that is currently 0.72 times that observed with S&P 500 stocks. When it comes to the price-earnings ratio, small-cap stocks have not always traded a discount compared to large-cap stocks. As noted in the chart below, small caps traded at premium from 2004 through 2017 (indicated by the red line above the 1.0 mark on the right axis of the chart) and are now trading at a significant discount compared to the 0.97 average observed since 1998.

The Model Shadow Stock Portfolio was designed to test the strategy of investing in the 1% intersection of the smallest and cheapest publicly traded stocks. Research conducted by Eugene Fama and Kenneth French (Journal of Finance, June 1992) showed that the smaller the market capitalization of a company, the higher its stock returns. In addition, the lower the ratio of market price to book value, the higher the returns. The highest returns came from those stocks that were in the lowest market-cap decile and the lowest price-to-book decile.
The primary Model Shadow Stock Portfolio selection criteria target the intersection of the smallest 10% of domestic stocks as measured by market cap, along with the “cheapest” 10% of domestic stocks as measured by the price-to-book ratio. These decile breakpoints are determined by examining domestic companies that are listed on the New York Stock Exchange (NYSE) and then applying the size and value breakpoints for stocks listed on all domestic exchanges. This 1% intersection (10% and 10% combined) constitutes the primary initial selection universe.
The Model Shadow Stock Portfolio is reviewed quarterly to determine portfolio deletions and additions. The quarterly review cycle is tied to the reporting cycle of most firms and limits costly portfolio turnover. AAII’s fundamental stock screening and research database Stock Investor Pro, with data as of March 8, 2024, was used for the market decile analysis.
Value
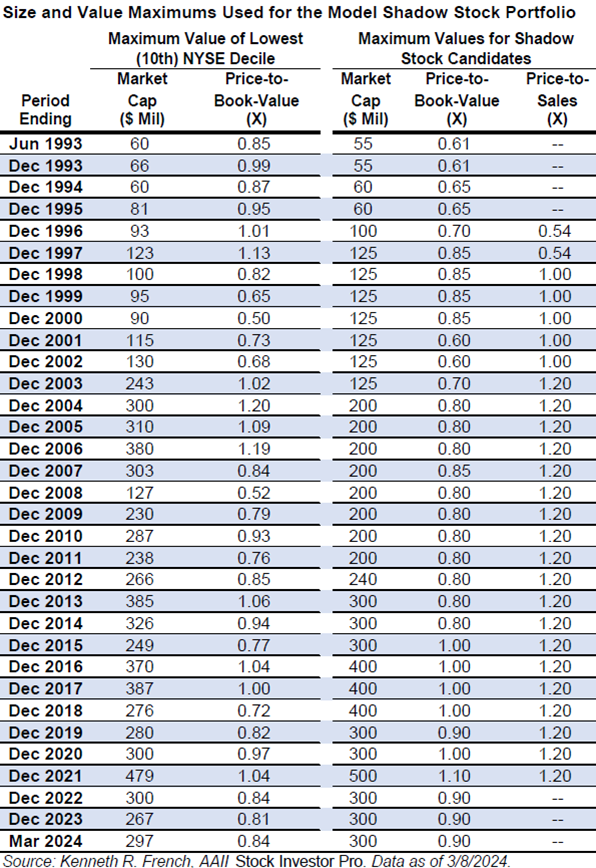
The price-to-book cutoff has increased slightly from 0.81 in December to 0.84. The current initial qualifying maximum price-to-book ratio is 0.90 and we left it unchanged. Qualifying stocks must have a price-to-book ratio of 0.90 or lower when added to the model portfolio. There are currently 1,229 exchange-listed securities with a price-to-book ratio less than or equal to 0.90. Stocks in the model portfolio are removed for valuation if they exceed three times the initial maximum price-to-book ratio at the time of a quarterly portfolio review.
Covenant Logistics Group Inc.  (CVLG) and Ennis Inc. (EBF) have the highest price-to-book ratio of 1.47 in the model portfolio. No stocks in the model portfolio exceeded the maximum price-to-book ratio at the time of review.
Size
We examined the market-cap levels of domestic companies listed on the NYSE to determine the size cutoff for the lowest decile when adding stocks to the model portfolio. The lowest decile market-cap level increased from $267 million in December 2023 to $297 million using data in Stock Investor Pro as of March 8, 2024. We left the maximum initial qualifying market-cap value unchanged at $300 million. There are currently 1,460 exchange-listed securities with a market cap between $30 million and $300 million. Holdings are removed if their market cap goes above three times the initial criterion at the time of the quarterly review.
Ducommun Inc. (DCO) has the largest market cap of $735.7 million in the model portfolio. No stocks in the model portfolio exceeded the maximum market cap at the time of review.
Earnings
If a company has trailing 12-month earnings from continuing operations that are negative, the stock is placed on probation; if a subsequent quarter has negative earnings prior to trailing 12-month earnings becoming positive, the stock is deleted. When available, adjusted (non-GAAP) earnings are used to put stocks on probation or remove them.
Lazydays Holdings Inc. (GORV) and Hooker Furnishings Corp. (HOFT) were on earnings probation at the start of the latest earnings season.
Hooker Furnishings has been on earnings probation since the first quarter of 2023. While it reported positive quarterly earnings in July and December, its trailing 12-month earnings are still in the red and the company remains on earnings probation.
Lazydays Holdings went on earnings probation when it reported a third-quarter 2023 loss of $0.48 per share, which pushed its trailing 12-month earnings into the red. Lazydays Holdings reported a fourth-quarter 2023 loss of $1.09 per share on March 8, 2024. It is the policy of the Model Shadow Stock Portfolio to remove a stock once its trailing 12-month adjusted earnings go negative and the company reports a subsequent quarterly loss while trailing earnings are still negative.
Lazydays Holdings operates recreational vehicle (RV) dealerships and offers a portfolio of products and services for RV owners and outdoor enthusiasts. After strong sales during the pandemic, demand has slowed recently, and financing costs for customers have increased along with higher interest rates. The company increased its marketing budget last year and aggressively discounted prices in 2022 and 2023 to reduce its amount of aging inventory. While the company anticipates returning to positive earnings for full-year 2024, the stock meets the negative earnings deletion rule.
Lazydays Holdings is being removed from the portfolio due to negative earnings. Lazydays Holdings was added to the Model Shadow Stock Portfolio on December 12, 2022, at a price of $13.98 per share. It was deleted on March 13, 2024, at $4.61 per share, for a loss of 67%.
As of March 12, 14 stocks met the initial selection criteria for the Model Shadow Stock Portfolio. AAII members can see and research which companies are currently passing the initial selection criteria in the Shadow Stock Ideas table on AAII.com. The list of new Shadow Stock Ideas is updated daily—Tuesday through Saturday.
Four qualifying stocks were already in the Model Shadow Stock Portfolio at the time of the review. The remaining 10 stocks were examined to ensure adequate liquidity, timely financial filings and appropriate industry and foreign considerations. The Shadow Stock Portfolio Rules on AAII.com provide guidance on factors to consider when selecting stocks for your portfolio.
With the proceeds from the deletion, as well as the cash held in the portfolio, we were able to take a position in one company.
Amplify Energy Corp. (AMPY)
Amplify Energy Corp. (AMPY) is an independent oil and natural gas company engaged in the acquisition, development, exploration and production of oil and natural gas properties in the U.S. Amplify Energy’s operations are focused in Oklahoma, the Rockies (Bairoil), federal waters offshore Southern California (Beta), East Texas/North Louisiana and the Eagle Ford Shale Basin. Amplify Energy is headquartered in Houston, Texas, and its properties consist of mature, legacy oil and natural gas fields.
Amplify Energy has a book value per share of $10.00 as of December 31, 2023. If you wish to stay within the 0.90 price-to-book maximum, you should pay no more than $9.00 per share ($10.00 × 0.90). However, if the stock price has moved up after being added to the portfolio, you can still purchase the stock unless the price-to-book ratio goes above 1.00, which equates to a price of $10.00 per share. To calculate the maximum purchase price based on the maximum desired price-to-book ratio, multiply the current book value per share ($10.00 for Amplify Energy) by the maximum price-to-book ratio to be considered for the Model Shadow Stock Portfolio (currently 0.90, or 1.00 for loosened consideration).
The next quarterly review of the Model Shadow Stock Portfolio will take place in early June 2024. Any changes to the portfolio will be announced at the time they are made in our Model Shadow Stock Portfolio Update emails (sign up at www.aaii.com/email).
Big 5 Sporting Goods Corporation (BGFV)
(02/27/2024)
Big 5 Sporting Goods reported a fourth-quarter 2023 GAAP loss of $0.41 per share. Total revenue decreased 17.6% from the prior-year quarter to $196.35 million.
According to CEO Steven G. Miller, the company’s results were negatively impacted by a challenging macroeconomic environment that led to reduced discretionary spending. Additionally, less snowfall and warmer temperatures in the company’s western regions adversely affected winter product sales, which are crucial for fourth-quarter performance. Miller also noted that while the first quarter showed some improvement in winter category sales due to better weather in February, this was offset by significant rainfall affecting other outdoor activities sales, like baseball. Despite these challenges, the company is focused on managing what it can control, such as optimizing merchandise margins, managing inventory levels and controlling expenses.
For first-quarter 2024, the company expects same-store sales to decrease in the low-double-digit range compared to the prior-year quarter. Net loss is expected to be in the range of $0.30 to $0.40 per share.
Big 5 Sporting Goods also declared a regular quarterly dividend of $0.05 per share, a decrease of 60% from the previous declaration of $0.125 pers hare. The dividend is payable on March 22 to shareholders of record as of March 8. The stock will trade ex-dividend on Thursday, March 7. Big 5 Sporting Goods began paying dividends in 2004 and has a current dividend yield of 3.8%.
Core Molding Technologies, Inc. (CMT)
(03/12/2024)
Core Molding Technologies reported fourth-quarter 2023 GAAP earnings per share of $0.25, beating the I/B/E/S consensus estimate of $0.060 per share. Total revenue decreased 14.6% from the prior-year quarter to $73.78 million, with product sales down 12.9%. Sales declined primarily due to lower demand from customers in building products and industrial and utilities markets.
Full-year 2023 sales totaled $357.7 million, down 5.2% from 2022. The company cited sales declines attributable to lower end-market demand in building products and industrial and utility verticals. Net income totaled $20.3 million, compared to $12.2 million in 2022.
(03/11/2024)
Core Molding Technologies authorized a stock repurchase program of up to $7.5 million of its common stock. CEO David Duvall said, “The combination of the company’s operational performance and the strength of the balance sheet enables the company to allocate capital to the repurchase of company shares while also allocating capital to the growth of the company.”
(03/04/2024)
Global Ship Lease reported fourth-quarter 2023 GAAP earnings per share of $2.49, beating the LSEG I/B/E/S consensus estimate of $2.350 per share. Total revenue increased 8.41% from the prior-year quarter to $178.89 billion. Net income was $64.7 million, a 10.9% decrease from $72.6 million reported for the prior-year quarter.
Full-year 2023 total revenue increased 4.5% to $674.8 million.
(03/08/2024)
Hurco Companies reported a first-quarter 2024 decline in sales of 17.6% to $45.05 million. The company reported a net loss of $1.6 million. This resulted in a loss per share of $0.25, reflecting a 20% decrease from the corresponding period a year earlier.
Lazydays Holdings, Inc. (GORV)
(03/08/2024)
Lazydays Holdings reported a fourth-quarter 2023 18.7% year-over-year decline in sales to $198 million. The company reported a net loss of $13.8 million, a decrease of 228%. This translates to an earnings loss of $1.09 per share, down 5,350% from one year ago. Earnings missed the LSEG I/B/E/S consensus estimate for a loss of $0.663 per share by 48.7%.
(03/06/2024)
Mistras Group reported a fourth-quarter 2023 8.2% year-over-year increase in sales to $182.1 million. Net income increased 3.7% to $2.9 million. This translates to earnings per share of $0.10, up 11.1% year over year. Earnings missed the LSEG I/B/E/S consensus estimate of $0.147 per share by 32.0%.
For full-year 2023, the company reported revenue of $705.5 million, representing a 2.6% increase and surpassing the high end of its revised guidance. The company reported a net loss of $17.5 million, or a loss of $0.58 per share, mainly due to reorganization and other costs of $12.3 million and a $13.8 million noncash goodwill impairment charge. Adjusted earnings before interest, taxes, depreciation and amortization (EBITDA) were $65.8 million, a 13.2% increase.
For full-year 2024, the company reaffirmed its preliminary guidance, anticipating revenue between $725 million and $750 million and adjusted EBITDA between $84 million and $89 million. Additionally, the company expects to generate free cash flow between $34 million and $38 million.
(03/06/2024)
NACCO Industries reported a fourth-quarter 2023 10.7% year-over-year decline in sales to $56.76 million. The company reported a net loss of $44.0 million. This translates to an earnings loss of $5.88 per share, which is down 31.3% from one year ago. Adjusted earnings before interest, taxes, depreciation and amortization (EBITDA), excluding an asset impairment charge, stand at $7.1 million. This declined from $23.6 million reported in the prior year.
Pangaea Logistics Solutions Ltd. (PANL)
(03/13/2024)
Pangaea Logistics Solutions reported a fourth-quarter 2023 year-over-year sales increase of 3.1% to $131.8 million. Net income plummeted 92.7% to $1.1 million. Earnings were $0.03 per share, down 91.2% compared to the prior-year quarter. Earnings missed the LSEG I/B/E/S consensus estimate of $0.336 per share by 91.1%. Adjusted net income was $7.4 million, or $0.16 per diluted share. Operating cash flow was $23.9 million, with adjusted earnings before interest, taxes, depreciation and amortization (EBITDA) reaching $19.7 million.
Park-Ohio Holdings Corp. (PKOH)
(03/05/2024)
Park Ohio Holdings reported a fourth-quarter 2023 1.9% year-over-year increase in sales to $389.3 million. The company reported a net loss of $14.5 million, a decrease of 64.8%. This translates to earnings per share of $0.54, which increased 28% year over year. Earnings missed the LSEG I/B/E/S consensus estimate of $0.555 per share by 2.7%.
The company also reported full-year 2023 record net sales from continuing operations of $1.7 billion, reflecting impressive 11% year-over-year growth. GAAP earnings from continuing operations were $2.72 per diluted share. Adjusted earnings from continuing operations reached $3.07 per diluted share, up 74% compared to $1.76 per diluted share in 2022. Earnings before interest, taxes, depreciation and amortization (EBITDA) from continuing operations increased 33% to $134 million. Strong operating cash flows amounted to $53 million, coupled with free cash flow of $25 million.
For full-year 2024, the company anticipates year-over-year revenue growth in the mid-single-digit range.
(02/28/2024)
Rocky Brands reported a fourth-quarter 2023 year-over-year decline in sales of 9.3% to $126 million. Sales in the wholesale segment declined by 13.3%, while retail segment sales increased 1.5%. Net income was down 8.3% to $8.3 million. This translates to earnings per share of $0.98, a decrease of 9.3% from one year ago. This figure missed the LSEG I/B/E/S consensus estimate of $1.023 per share by 4.2%.
Full fiscal-year 2023 net sales were down 25.0%, totaling $461.8 million compared to $615.5 million in 2022. Income from operations in 2023 was $35.4 million, or 7.7% of net sales, compared to $44.0 million, or 7.2% of net sales in 2022. Adjusted operating income was $41.9 million, or 9.0% of adjusted net sales, compared to $48.6 million, or 7.9% of adjusted net sales, in the prior year. Net income was $10.4 million, or $1.41 per diluted share, compared to $20.5 million, or $2.78 per diluted share, in 2022. Adjusted net income was $14.3 million, or $1.93 per diluted share, compared to $24.1 million, or $3.27 per diluted share, in 2022.
SigmaTron International, Inc. (SGMA)
(03/08/2024)
SigmaTron International reported a third-quarter 2023 year-over-year sales increase of 3.4% to $95.9 million. Net income rose by 97.4% to $0.6 million. This equates to earnings per share of $0.10, up 102.6% year over year.
 Get updates about the portfolio that has outperformed the market by 211.9%
since inception!
Get updates about the portfolio that has outperformed the market by 211.9%
since inception!