


John Bajkowski
is the president of AAII.
The stock market rally continued through March, fueled by strong domestic economic performance and positive investor sentiment. The fear of missing out (FOMO) is a powerful influence on behavior, and investors continued to pour money into the stocks positioned to benefit from the computing and infrastructure demands of artificial intelligence (AI) systems. The S&P 500 index and the S&P MidCap 400 index reached all-times highs on March 28, 2024, but the S&P SmallCap 600 index remained 8.3% off its all-time high at the end of the month.
The Model Shadow Stock Portfolio was up 1.7% during March, compared to a 3.2% gain for the S&P 500, a 5.6% gain for the S&P MidCap 400 and a 3.2% gain for the S&P SmallCap 600. Market breadth improved during the month. The number of advancing issues outnumbered the number of declining issues across all S&P indexes, although the ratio was weaker for smaller companies. Within the S&P 500, advancing issues outpaced declining issues 400 to 97 for a ratio of 4.12, up from 2.35 last month. The ratio was 3.94 in the S&P MidCap 400 (up from 1.93 last month) and 2.20 for the S&P SmallCap 600 (up from 1.44 last month). Looking back one year, there are more declining issues compared to advancing issues. Within the Model Shadow Stock Portfolio, the breadth was much weaker: 13 holdings were up for the month, while 17 were down, for a ratio of 0.76.
In the large-cap segment, value stocks were up 4.6% for the month, while growth stocks were up 2.1%. Over the last year, large-cap value stocks are up 25.6%, compared to a return of 33.7% for large-cap growth stocks.
During March, mid-cap value stocks gained 5.4% and mid-cap growth stocks were up 5.8%. Mid-cap value stocks are up 17.2% over the last year, while mid-cap growth stocks are up 29.3%.
Small-cap value stocks are up 11.6% over the last year, while small-cap growth stocks are up 20.1%. Small-cap value stocks gained 3.4% during March and small-cap growth stocks gained 3.1%.
The Model Shadow Stock Portfolio gained 1.7% for the month and is up 10.9% over the last year. The Vanguard Small Cap Index fund  (NAESX) gained 4.4% during March and is up 22.4% over the last year.
Since its inception in 1993, the AAII Model Shadow Stock Portfolio has a compound annual average return of 13.6%, versus the Vanguard 500 Index fund’s (VFINX) gain of 10.3% per year on average over the same period. Over the same period, the Vanguard Small Cap Index fund posted an average annual gain of 10.0%.

Once again, all 11 sectors in the S&P 500 were up for the month. Energy was the best performer, up 10.4%, while the weakest sector was consumer discretionary, unchanged for the month. In the mid-cap segment, the only sector down during March was communication services (–1.1%). Energy (+10.9%) and utilities (+10.3%) were the best-performing sectors within the mid-cap segment. Three sectors were in the red within the S&P SmallCap 600—consumer staples (–0.6%), information technology (–0.3%) and communications services (–0.3%).
Looking back one year, communication services (+48.4%) and information technology (+44.8%) are top performers in the S&P 500; industrials (+34.0%) and information technology (+32.4%) had the best performance in the S&P MidCap 400; and industrials (+32.7%) and consumer discretionary (+22.7%) had the best performance in the S&P SmallCap 600. The weakest-performing sectors among large-company stocks were defensive: utilities (–3.1%) and consumer staples (+4.3%). Communication services (–20.0%) and real estate (–14.4%) were the weakest sectors in the S&P MidCap 400, while utilities (–15.1%) and communication services (–2.6%) were the weakest S&P SmallCap 600 sectors over the last year.
Industry and sector competition play a strong role in company performance and stock price valuations. The Model Shadow Stock Portfolio strategy is a deep-value micro-cap approach using the price-to-book-value (P/B) ratio as its primary valuation filter. Notably, the Shadow Stock screen excludes stocks in the financial sector since their financial ratios are not comparable to firms in other sectors. Not surprisingly, the sector weights of the Model Shadow Stock Portfolio are quite different from that of the S&P 500. What is equally surprising is how the sector weights vary across the three S&P indexes.
The table below provides the weighted-average sector weights of the Model Shadow Stock Portfolio as well as the three S&P indexes. LSEG Data & Analytics supplies the fundamental stock data for AAII’s Stock Investor Pro fundamental stock screening and research database. It has slightly different sector designations than those used by S&P Dow Jones Indices, but the results are equally revealing.
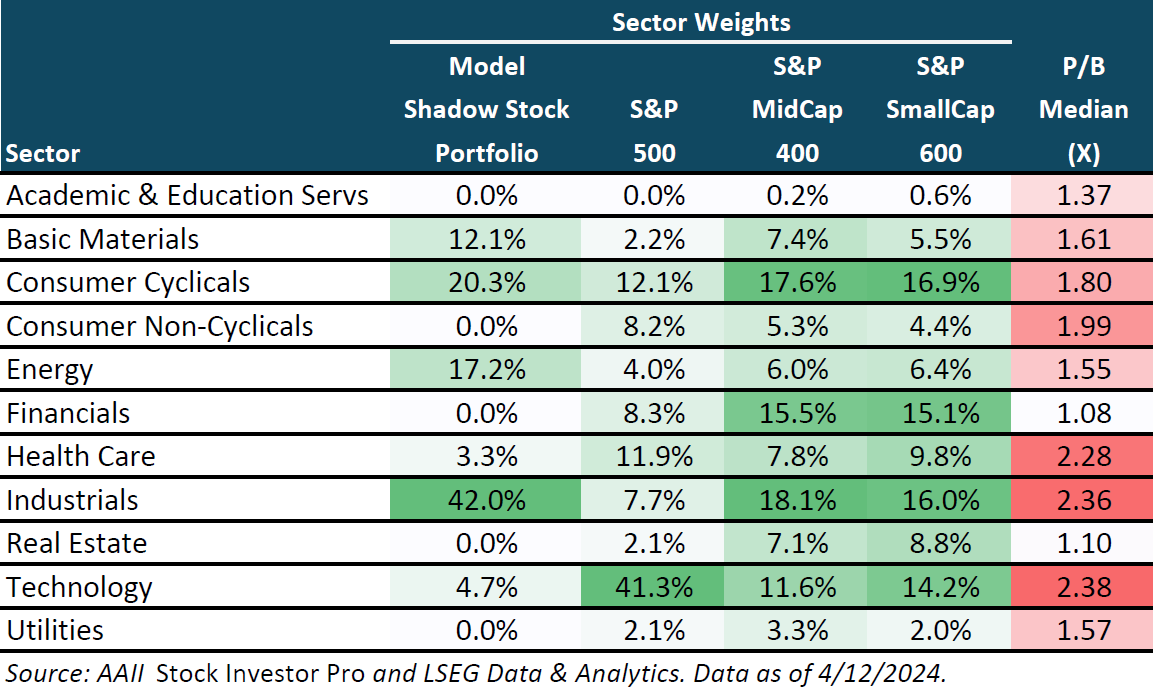
The sector weights have been highlighted to easily show the dominant sectors across the indexes. Higher weights are more darkly shaded. The last column provides the median price-to-book-value ratio of all the stocks that constitute a given sector. For the price-to-book ratio, darker red shading is related to relatively higher ratios.
The S&P 500 is dominated by the technology sector. Eighteen percent of the companies in the S&P 500 are in the technology sector and, when you consider their market cap, they account for 41.3% of the index. The technology sector accounts for only 11.6% of the S&P MidCap 400 and 14.2% of the S&P SmallCap 600. Technology takes up an even smaller proportion of the Model Shadow Stock Portfolio, accounting for only 4.7% of the portfolio value.
The median price-to-book ratio for the stocks in the technology sector is 2.38, the highest among the sectors. Given the generally higher valuation levels of the technology sector, these stocks are less likely to pass the initial screen for the Model Shadow Stock Portfolio. Twenty-one companies passed the initial screen on April 12, 2024; six were consumer cyclicals, five were industrials, three were energy, three were health care, two were consumer non-cyclicals, and two were in the technology sector.
Consumer cyclicals, financials and industrials sectors account for the greatest sector concentration of S&P MidCap 400 and the S&P SmallCap 600. Within the Model Shadow Stock Portfolio, industrials make up 42.0% of the portfolio, followed by consumer cyclicals (20.3%) and energy (17.2%). As it currently stands, the Model Shadow Stock Portfolio is more closely linked to the overall economic cycle based on the sector analysis.
Given the market retreat in early April, more companies passed the initial Shadow Stock screen this month. Twenty-one met the initial selection criteria for the Model Shadow Stock Portfolio as of April 12, up from 14 passing stocks last month. AAII members can see and research which companies are currently passing the initial selection criteria in the Shadow Stock Ideas table on AAII.com. The list of new Shadow Stock Ideas is updated daily—Tuesday through Saturday.
Of the 21 qualifying companies as of April 12, 2024, seven are currently held in the Model Shadow Stock tracking portfolio: Amplify Energy Corp. (AMPY), Fonar Corp. (FONR), Hooker Furnishings Corp. (HOFT), Key Tronic Corp. (KTCC), Rocky Brands Inc. (RCKY), Saga Communications Inc. (SGA) and StealthGas Inc. (GASS).
Qualifying companies are those held in the Model Shadow Stock Portfolio that currently meet the initial addition rules. They are designated as “currently qualifies” in the notes column of the Model Shadow Stock Portfolio table on AAII.com. However, if you go online, the notes may not match the list discussed here since the notes on the website table are dynamically updated daily.
Notably, Hooker Furnishings came off the negative earnings probation list after its latest earnings release and met the initial selection criteria again.
The Model Shadow Stock Portfolio looks for stocks with a market capitalization (share price times shares outstanding) less than $300 million. Shadow stocks with a market cap three times the initial market cap maximum—$900 million ($300 million × 3)—at the time of a quarterly review are removed from the model portfolio, assuming there is a suitable replacement. As of April 12, 2024, Ducommun Inc. (DCO) had the highest market cap of $813.5 million and Global Ship Lease Inc. (GSL) had a second-highest market cap of $759.3 million.
As of April 12, 2024, Covenant Logistics Group Inc. (CVLG) had the highest price-to-book ratio in the Model Shadow Stock Portfolio. Its ratio of 1.46 is above the 0.90 maximum value used for initially qualifying a stock for inclusion in the portfolio. However, stocks are not removed from the portfolio until their price-to-book ratio rises to three times the initial maximum value, 2.70 (0.90 × 3). Ennis Inc. (EBF) also had an elevated price-to-book value ratio of 1.45.
Click here to see the current addition and deletion rules for the portfolio.
The next quarterly review of the AAII Model Shadow Stock Portfolio will take place around the beginning of July 2024, after most of the holdings have announced their quarterly earnings.
If a company in the tracking portfolio reports trailing 12-month earnings from continuing operations that are negative, the stock is placed on probation; if a subsequent quarter has negative earnings prior to trailing 12-month earnings becoming positive, the stock is removed. When available, adjusted (non-GAAP) earnings are used to put stocks on probation or delete them. These are earnings that have been adjusted to eliminate the impact of nonrecurring events such as markdown of inventory or goodwill. These are earnings reported in the media and firms reporting consensus estimates. The LSEG I/B/E/S adjusted earnings reported in AAII’s Stock Investor Pro are used for Model Shadow Stock Portfolio decisions when they are available.
Ampco-Pittsburgh Corp. (AP) just went on earnings probation when it reported an adjusted quarterly loss of $0.77 per share, which pushed its trailing 12-month earnings per share into the red. Other model portfolio holdings on earnings probation include Bassett Furniture Industries Inc. (BSET) and Big 5 Sporting Goods Corp. (BGFV).
If there any changes to the model portfolio, they will be announced at the time with a special Model Shadow Stock Portfolio Update email (sign up at www.aaii.com/email).
Ampco-Pittsburgh Corporation (AP)
(03/25/2024)
Ampco-Pittsburgh reported a fourth-quarter 2023 earnings loss of $2.12 per share. Total revenue increased 15.6% from the prior-year quarter to $108.1 million.
For full-year 2023, the company reported a loss from operations of $34.6 million. Revenue increased 8.2% from the prior year to $422.3 million. It reported a net loss of $38.1 million, compared to net income of $5.5 million in 2022.
Bassett Furniture Industries, Incorporated (BSET)
(04/03/2024)
Bassett Furniture Industries reported a first-quarter 2024 earnings loss of $0.14 per share, missing the LSEG I/B/E/S consensus estimate for earnings of $0.005 per share. Total revenue decreased 19.6% from the prior-year quarter to $86.6 million. The company reported a loss from operations of $2.3 million.
CEO Robert H. Spilman Jr. attributes the quarter’s losses to the challenging sales environment and start-up expenses due to new stores in Tampa and Houston. Spilman said the company is working to explore expense reduction strategies that will generate profitability at the reported level of sales while not being detrimental to gaining market share.
(04/12/2024)
Ducommun announced that it received two significant contracts worth over $50 million in total from Raytheon Technologies for the SPY-6 radar systems. These contracts include a $25 million follow-on order for a circuit card assembly currently in production and another $25 million order for a new circuit card assembly. All the circuit cards involved in these contracts will be manufactured at Ducommun’s engineering and manufacturing center in Tulsa, Oklahoma.
(04/08/2024)
Ducommun announced that its board of directors received an unsolicited, nonbinding offer from private investment firm Albion River LLC, proposing to buy all of Ducommun’s outstanding shares for $60.00 each in cash. The board, prioritizing its fiduciary responsibilities and with advice from legal and financial experts, intends to thoroughly evaluate this proposal to ascertain its alignment with the company’s and its shareholders’ best interests. Ducommun shares closed on Thursday, April 11, 2024, at $55.56 per share.
(03/29/2024)
Escalade reported fourth-quarter 2023 GAAP earnings per share of $0.21. Total revenue decreased 9.2% from the prior-year quarter to $65.5 million, primarily due to softer consumer demand across the majority of the company’s product categories. The company also reported net income of $2.9 million versus $2.1 million reported in the prior-year quarter.
Full-year 2023 net sales decreased 16% to $263.6 million. Net income was $9.8 million, or $0.71 per diluted share, down from $18.0 million, or $1.31 per diluted share, for 2022.
Friedman Industries, Incorporated (FRD)
(03/21/2024)
Friedman Industries declared a quarterly dividend of $0.04 per share, representing a 100% increase from the prior declaration of $0.02 per share. The dividend is payable on May 24 to shareholders of record as of April 26. The stock will trade ex-dividend on Thursday, April 25. Friedman Industries’ current dividend yield is 0.5%.
Hooker Furnishings Corporation (HOFT)
(04/11/2024)
Hooker Furnishings reported fourth-quarter 2024 GAAP earnings per share of $0.06. Total revenue decreased 26.3% from the prior-year quarter to $96.8 million.
Fiscal full-year 2024 revenue decreased 25.7% from the prior year to $433.2 million, driven by weak demand in the home furnishings industry and the exit of unprofitable product lines in the Home Meridian segment, which resulted in a $21 million reduction in revenue.
According to CEO Jeremy Hoff, some of the company’s accomplishments during the fiscal year include successfully restructuring its Home Meridian International business model, improving profitability and strengthening its balance sheet. Despite the current demand environment, which is still healing from the coronavirus pandemic, Hoff remains optimistic about the company’s performance over the intermediate term and long term due to its continued investments in initiatives that it believes will ideally position it for when demand improves, including the naming of a new chief creative officer, Caroline Hipple.
Lakeland Industries, Inc. (LAKE)
(04/10/2024)
Lakeland Industries reported a fourth-quarter 2023 year-over-year uptick in sales of 7.6% to $31.2 million. The company also reported a net loss of $1.0 million, down 120% from the prior-year quarter. This equates to a loss per share of $0.13, reflecting a significant 7.5% year-over-year decrease. Gross margin slightly declined to 35.9%, compared to 37.5% in the prior-year quarter. This decrease can be attributed to a one-time charge of $2.7 million for excess and obsolete inventory.
Additionally, significant business developments included the completed acquisition of Jolly Scarpe boots and the announcement of an agreement to acquire LHD Group’s fire and rescue business, further enhancing Lakeland Industries’ fire service offerings.
(03/21/2024)
Titan Machinery reported results for its fiscal fourth-quarter and full-year 2024 ending in January. Fourth-quarter sales increased 46.2% to $852.1 million. Net income was $24.0 million, for earnings per diluted share of $1.05. This compares to net income of $18.1 million, or earnings per diluted share of $0.80 in the prior-year quarter. Full-year 2024 revenue increased 24.9% to $2.8 billion. Net income was $112.4 million, for record earnings of $4.93 per diluted share. This compares to $101.9 million, or $4.49 per diluted share, for the prior year.
 Get updates about the portfolio that has outperformed the market by 211.9%
since inception!
Get updates about the portfolio that has outperformed the market by 211.9%
since inception!