


John Bajkowski
is the president of AAII.
After the quarterly review of the Model Shadow Stock Portfolio at the beginning of June, five stocks are being removed and five stocks are being added.
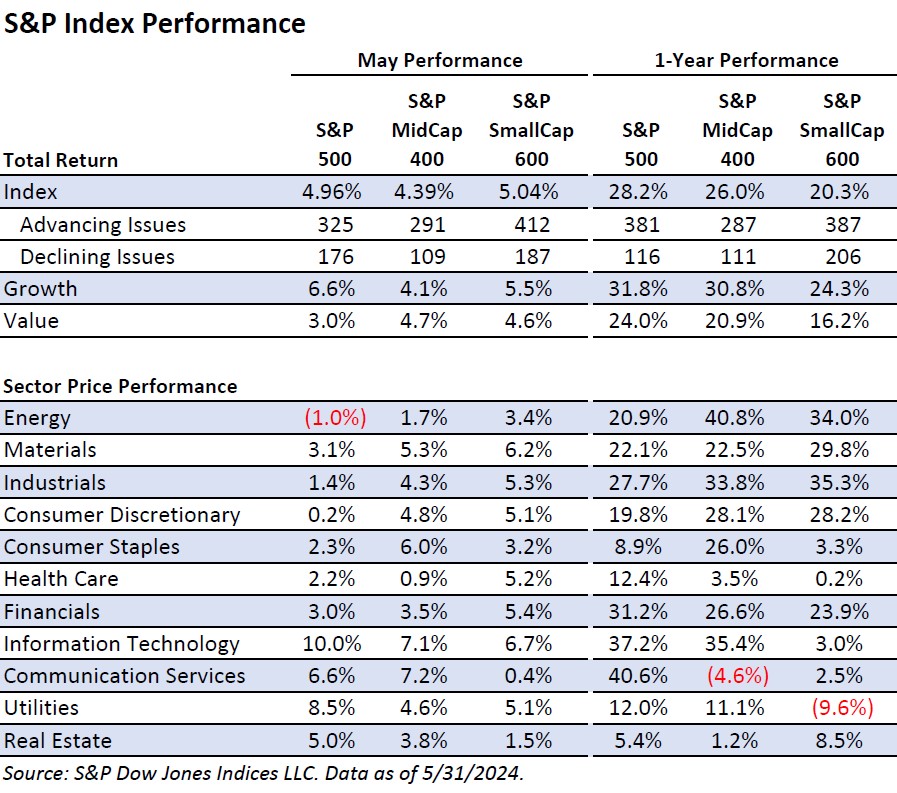
It is hoped that you did not sell at the beginning of May and go away. While growth stocks continued to outperform value stocks, there were meaningful gains across size segments of the market. The S&P SmallCap 600 index led the market during May with a 5.04% gain, just outpacing the 4.96% return of the S&P 500 index and 4.39% gain of the S&P MidCap 400 index. The Model Shadow Stock Portfolio was up 5.14% during May.
Small-cap stocks continue to lag larger companies on a trailing 12-month basis. The S&P SmallCap 600 is up 20.3% over the last year, compared with a 26.0% gain for the S&P MidCap 400 and a 28.2% gain for the S&P 500. The Model Shadow Stock Portfolio is up 23.8% over the last year.
Small-cap value stocks remain in the red for the year, down 2.1% year to date, while small-cap growth stocks are up 5.3% year to date. Small-cap value stocks gained 4.6% during May and are up 16.2% over the last year, while small-cap growth stocks gained 5.5% during the month and are up 24.3% over the last year.
Mid-cap value stocks are up 20.9% over the last year, compared to a 30.8% gain for mid-cap growth stocks over the same period. During May, mid-cap value stocks were up 4.7% and mid-cap growth stocks gained 4.1%.
In the large-cap segment, growth stocks were up 6.6% for the month, while value was up 3.0%. Over the last year, large-cap growth stocks are up 31.8%, compared to a return of 24.0% for large-cap value stocks.
Advancing issues managed to outpace declining issues across all market segments, but the ratio of advancing to declining issues was strongest with mid-cap companies. Within the S&P MidCap 400, there were 291 advancing issues compared to 109 declining issues—a ratio of 2.67. The ratio was 2.20 in the S&P SmallCap 600 and 1.85 for the S&P 500. Looking back one year, breadth was strongest with larger companies. The ratio of advancing issues to declining issues was 3.28 for the S&P 500 constituents, but 1.88 for the S&P SmallCap 600 constituents.
Ten of 11 sectors in the S&P 500 were up during May, compared to one out of 11 up during April. The difference between the best- and worst-performing sector widened slightly during May: 10.9 percentage points compared to 10.2 percentage points in April. Energy was the only sector down in the S&P 500 during the month, down 1.0%. Oil closed down 5.4% during May. Information technology was the strongest S&P 500 sector with a 10.0% gain. Health care was the weakest sector within the S&P MidCap 400 with a 0.9% gain, while communication services was the strongest with a 7.2% gain during May. Information technology was also the top performer in the S&P SmallCap 600 with a 6.7% gain, while communication services was the weakest with a 0.4% gain. It is interesting how sector leadership varies between the three S&P indexes. Communication services is the leading S&P 500 sector for the year with a 40.6% gain, yet it is the only sector down for the year within the S&P MidCap 400, down 4.6%.
Small-cap stocks remain attractively priced relative to large-cap stocks. The median price-to-book-value (P/B) ratio of the companies in the S&P SmallCap 600 is 1.71, well below the 3.41 median price-to-book ratio for the companies in the S&P 500. The S&P SmallCap 600 normally trades at a discounted multiple relative to the S&P 500. The discount has averaged 0.66 since 1998 and is currently 0.50. The stocks in the Model Shadow Stock Portfolio are even cheaper, with a median price-to-book value of 0.82.
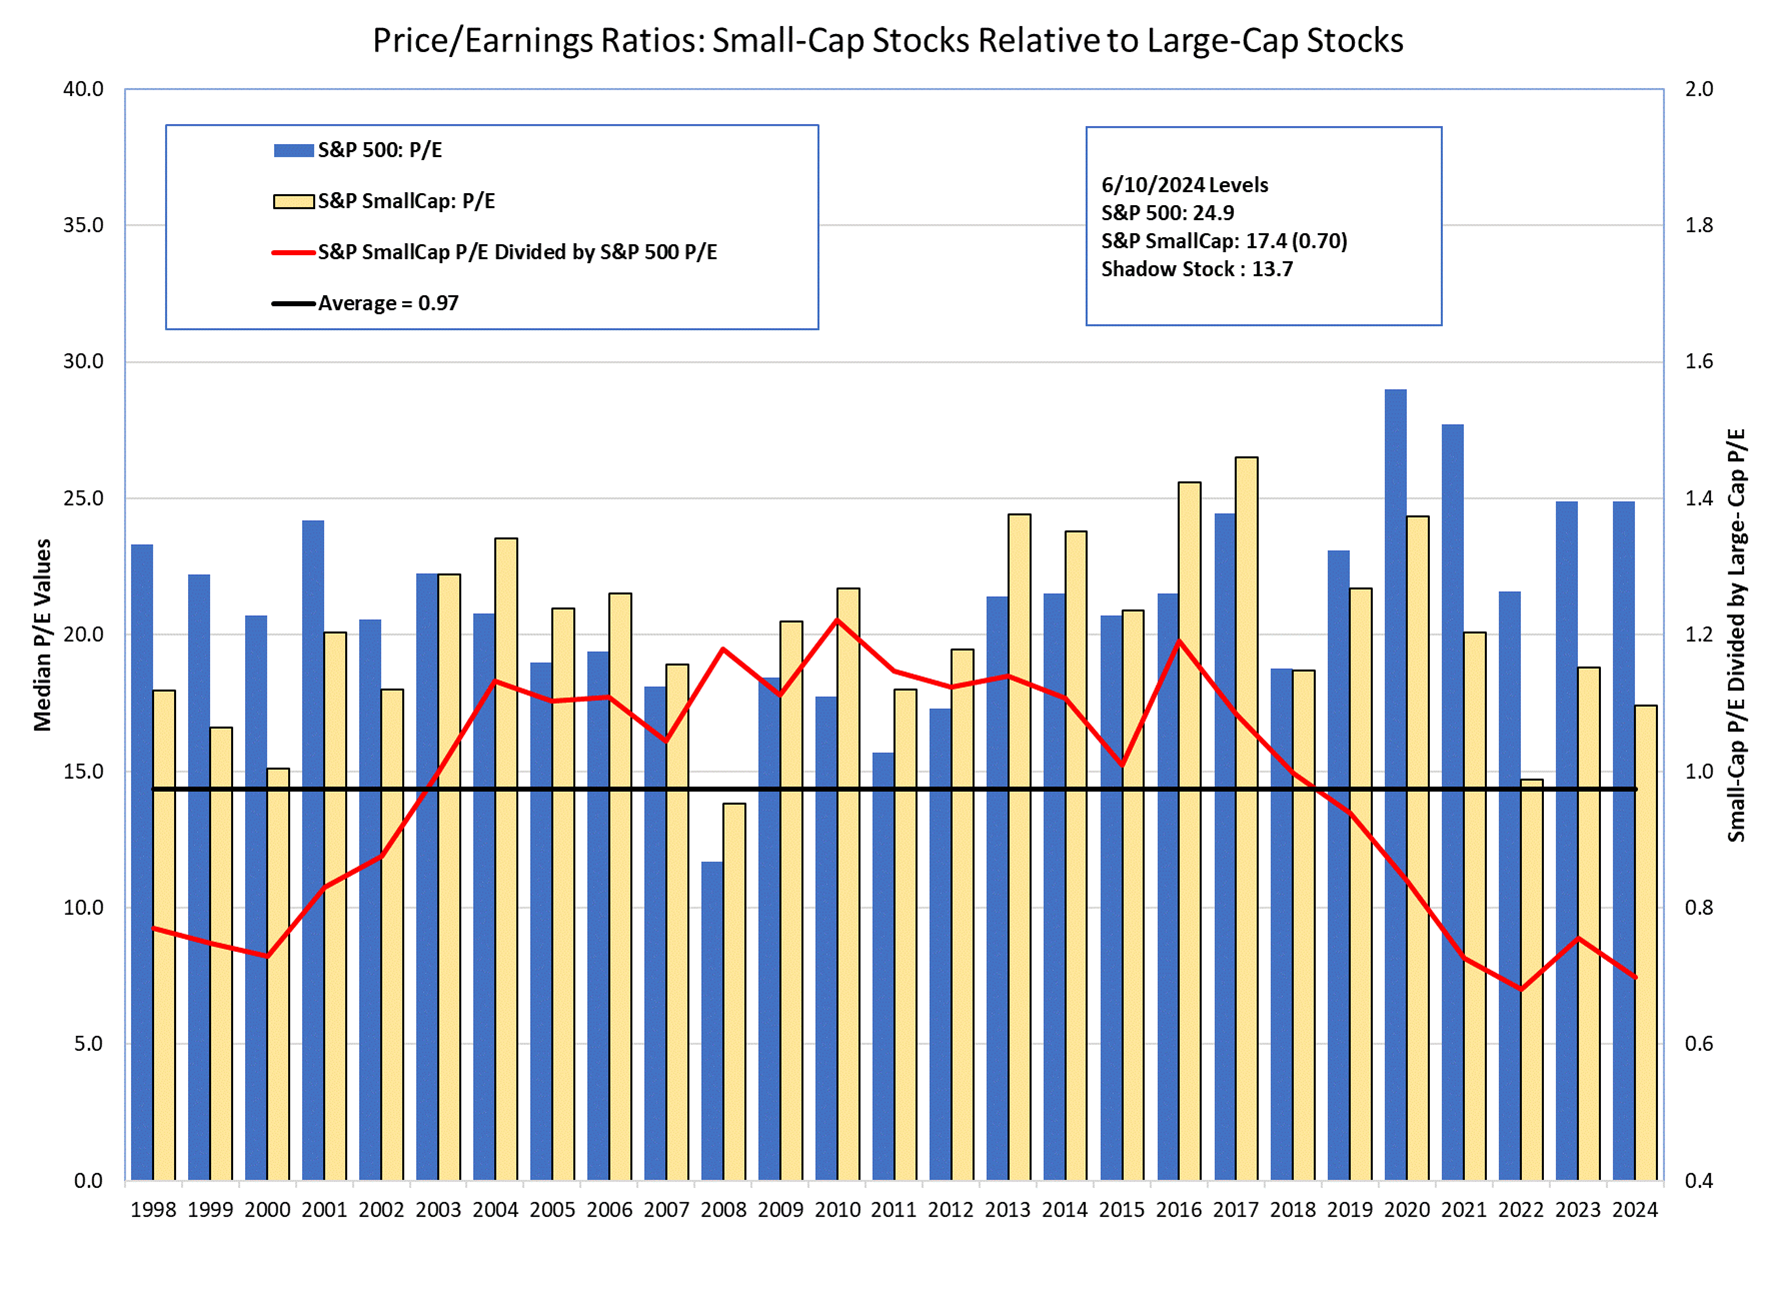
Attractive relative valuation comparisons of small-cap stocks also hold true if price-earnings (P/E) ratios are considered. The median price-earnings ratio of the companies in the S&P SmallCap 600 is 17.4, below the 24.9 median ratio for the companies in the S&P 500. Stocks in the S&P SmallCap 600 are trading with a median price-earnings ratio that is currently 0.70 times that observed with S&P 500 stocks. When it comes to the price-earnings ratio, small-cap stocks have not always traded at a discount compared to large-cap stocks. Small caps traded at premium from 2004 through 2017 but are now trading at a significant discount compared to the 0.97 average observed since 1998.
Acquisition
L.S. Starrett Co. announced on March 11, 2024, that it entered into a definitive merger agreement to go private with an affiliate of MiddleGround Capital in an all-cash transaction for $16.19 per share. The purchase price represented an approximately 63% premium to the closing stock price on March 8, 2024, the last trading day prior to the transaction announcement. The merger was completed on May 24, 2024. L.S. Starrett was added to the Model Shadow Stock Portfolio on December 13, 2023, at a price of $10.10 per share. It was removed on May 24, 2024, at $16.19 per share, for a gain of 60.3%.
The Model Shadow Stock Portfolio was designed to test the strategy of investing in the 1% intersection of the smallest and cheapest publicly traded stocks. Research conducted by Eugene Fama and Kenneth French (Journal of Finance, June 1992) showed that the smaller the market capitalization of a company, the higher its stock returns. In addition, the lower the ratio of market price to book value, the higher the returns. The highest returns came from those stocks that were in the lowest market-cap decile and the lowest price-to-book decile.
The primary Model Shadow Stock Portfolio selection criteria target the intersection of the smallest 10% of domestic stocks as measured by market cap, along with the “cheapest” 10% of domestic stocks as measured by the price-to-book ratio. These decile breakpoints are determined by examining domestic companies that are listed on the New York Stock Exchange (NYSE) and then applying the size and value breakpoints for stocks listed on all domestic exchanges. This 1% intersection (10% and 10% combined) constitutes the primary initial selection universe.
The Model Shadow Stock Portfolio is reviewed quarterly to determine portfolio deletions and additions. The quarterly review cycle is tied to the reporting cycle of most firms and limits costly portfolio turnover. AAII’s fundamental stock screening and research database Stock Investor Pro, with data as of June 7, 2024, was used for the market decile analysis.
Value
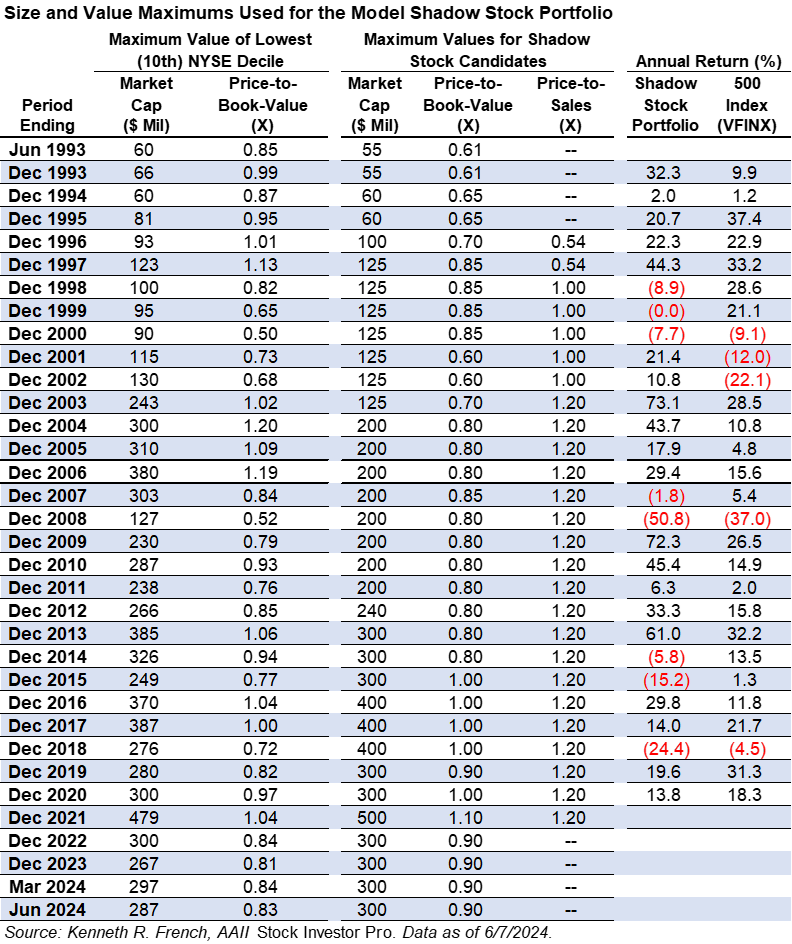
The price-to-book cutoff has decreased slightly from 0.84 in March to 0.83. The current initial qualifying maximum price-to-book ratio is 0.90 and we left it unchanged. Qualifying stocks must have a price-to-book ratio of 0.90 or lower when added to the model portfolio. There are currently 1,197 exchange-listed securities with a price-to-book ratio less than or equal to 0.90, down from 1,229 in March. Stocks in the model portfolio are removed for valuation if they exceed three times the initial maximum price-to-book ratio at the time of a quarterly portfolio review.
Covenant Logistics Group Inc.  (CVLG) has the highest price-to-book ratio of 1.56 in the model portfolio. No stocks in the model portfolio exceeded the maximum price-to-book ratio at the time of review.
Size
We examined the market-cap levels of domestic companies listed on the NYSE to determine the size cutoff for the lowest decile when adding stocks to the model portfolio. The lowest decile market-cap level decreased from $297 million in March to $287 million using data in Stock Investor Pro as of June 7, 2024. We left the maximum initial qualifying market-cap value unchanged at $300 million. There are currently 1,443 exchange-listed securities with a market cap between $30 million and $300 million, down from 1,460 in March. Holdings are removed if their market cap goes above three times the initial criterion at the time of the quarterly review.
Global Ship Lease Inc. (GSL) has the largest market cap of $1.02 billion in the model portfolio, above the $900 million maximum level (3 × $300 million). Global Ship Lease is being removed from the model portfolio because it exceeded the maximum market cap at the time of review. Global Ship Lease was added to the Model Shadow Stock Portfolio on December 14, 2020, at a price of $10.64 per share. It was deleted on June 11, 2024, at $28.51 per share, for a gain of 168.0%.
Earnings
If a company has trailing 12-month earnings from continuing operations that are negative, the stock is placed on probation; if a subsequent quarter has negative earnings prior to trailing 12-month earnings becoming positive, the stock is deleted. When available, adjusted (non-GAAP) earnings are used to put stocks on probation or remove them.
Ampco-Pittsburgh Corp. (AP), Bassett Furniture Industries Inc. (BSET) and Big 5 Sporting Goods Corp. (BGFV) were on earnings probation at the start of the latest earnings season.
Ampco-Pittsburgh went on earnings probation when it reported a fourth-quarter 2023 adjusted loss of $0.773 per share, which pushed its trailing 12-month adjusted earnings into the red. Ampco-Pittsburgh reported a first-quarter 2024 loss of $0.138 per share on May 14, 2024. It is the policy of the Model Shadow Stock Portfolio to remove a stock once its trailing 12-month adjusted earnings go negative and the company reports a subsequent quarterly loss while trailing earnings are still negative. Ampco-Pittsburgh is being removed from the portfolio due to negative earnings. Ampco-Pittsburgh was added to the Model Shadow Stock Portfolio on December 14, 2020, at a price of $5.61 per share. It was deleted on June 11, 2024, at $1.09 per share, for a loss of 80.6%.
Bassett Furniture Industries went on earnings probation when it reported a fourth-quarter 2023 adjusted loss of $0.47 per share, which pushed its trailing 12-month adjusted earnings into the red. Bassett Furniture Industries reported a first-quarter 2024 loss of $0.14 per share on April 3, 2024. Bassett Furniture Industries is being removed from the portfolio due to negative earnings. Bassett Furniture Industries was added to the Model Shadow Stock Portfolio on December 13, 2019, at a price of $15.39 per share. It was deleted on June 11, 2024, at $14.055 per share, for a loss of 8.7%.
Big 5 Sporting Goods went on earnings probation when it reported a fourth-quarter 2023 adjusted loss of $0.388 per share, which pushed its trailing 12-month adjusted earnings into the red. Big 5 Sporting Goods reported a first-quarter 2024 loss of $0.38 per share on April 30, 2024. Big 5 Sporting Goods is being removed from the portfolio due to negative earnings. Big 5 Sporting Goods was added to the Model Shadow Stock Portfolio on December 5, 2017, at a price of $7.03 per share. It was deleted on June 11, 2024, at $3.1308 per share, for a loss of 55.5%.
As of June 10, 15 stocks met the initial selection criteria for the Model Shadow Stock Portfolio, unchanged from May. AAII members can see and research which companies are currently passing the initial selection criteria in the Shadow Stock Ideas table on AAII.com. The list of new Shadow Stock Ideas is updated daily—Tuesday through Saturday.
Two qualifying stocks were already in the Model Shadow Stock Portfolio at the time of the review. The remaining 13 stocks were examined to ensure adequate liquidity, timely financial filings and appropriate industry and foreign considerations. The Shadow Stock Portfolio Rules on AAII.com provide guidance on factors to consider when selecting stocks for your portfolio.
With the proceeds from the deletions, as well as the cash held in the portfolio, the portfolio was able to take positions in five new companies.
Alpha Pro Tech, Ltd. (APT)
Alpha Pro Tech Ltd. (APT) develops, manufactures and markets a line of high-value protective apparel garments, face masks and face shields, as well as a line of construction weatherization building products for the housing market. The company began as a face shield company in 1989 and made various acquisitions that added face masks, disposable protective garments, automated shoe covers and lamination capabilities. In 2005, Alpha Pro Tech developed a line of construction weatherization products, namely house wrap and synthetic roof underlayment for the building supply market.
Alpha Pro Tech has a book value per share of $5.46 as of March 31, 2024. If you wish to stay within the 0.90 price-to-book maximum, you should pay no more than $4.914 per share ($5.46 × 0.90). However, if the stock price has moved up since passing the Shadow Stock screen, you can still purchase the stock unless the price-to-book ratio goes above 1.00, which equates to a price of $5.46 per share. To calculate the maximum purchase price based on the maximum desired price-to-book ratio, multiply the current book value per share ($5.46 for Alpha Pro Tech) by the maximum price-to-book ratio to be considered for the Model Shadow Stock Portfolio (currently 0.90, or 1.00 for loosened consideration).
American Vanguard Corp. (AVD)
American Vanguard Corp. (AVD) is a diversified specialty and agricultural products company. The company develops and markets products for crop protection and management, turf and ornamentals management and public and animal health.
American Vanguard has a book value per share of $13.35 as of March 31, 2024. If you wish to stay within the 0.90 price-to-book maximum, you should pay no more than $12.015 per share ($13.35 × 0.90). However, if the stock price has moved up since passing the Shadow Stock screen, you can still purchase the stock unless the price-to-book ratio goes above 1.00, which equates to a price of $13.35 per share.
Castor Maritime Inc. (CTRM)
Castor Maritime Inc. (CTRM) is a Cyprus-based company engaged in the ocean transportation of dry-bulk cargoes worldwide through the ownership and operation of bulk carrier vessels. Castor Maritime owns a fleet of 10 vessels, with an aggregate capacity of 0.7 million deadweight tonnage (dwt), currently consisting of three Kamsarmax vessels, five Panamax dry-bulk vessels and two 2,700 twenty-foot equivalent unit (TEU) containership vessels. Castor Maritime completed a 1-for-10 reverse stock split on March 27, 2024, meeting the minimum $1.00 per share bid price requirement for maintaining its listing on the Nasdaq exchange.
Castor Maritime has a book value per share of $49.96 as of March 31, 2024. If you wish to stay within the 0.90 price-to-book maximum, you should pay no more than $44.964 per share ($49.96 × 0.90). However, if the stock price has moved up since passing the Shadow Stock screen, you can still purchase the stock unless the price-to-book ratio goes above 1.00, which equates to a price of $49.96 per share.
DMC Global Inc. (BOOM)
DMC Global Inc. (BOOM) is an owner and operator of asset-light manufacturing businesses. It owns and operates Arcadia Products, DynaEnergetics and NobelClad, three asset-light manufacturing businesses that provide differentiated products and engineered solutions to segments of the construction, energy, industrial processing and transportation markets.
DMC Global has a book value per share of $20.90 as of March 31, 2024. If you wish to stay within the 0.90 price-to-book maximum, you should pay no more than $18.81 per share ($20.90 × 0.90). However, if the stock price has moved up since passing the Shadow Stock screen, you can still purchase the stock unless the price-to-book ratio goes above 1.00, which equates to a price of $20.90 per share.
Nortech Systems Inc. (NSYS)
Nortech Systems Inc. (NSYS) is a provider of design and manufacturing solutions for complex electromedical devices, electromechanical systems, assemblies and components. Nortech Systems primarily serves the medical, aerospace & defense and industrial markets. Its design services span concept development to commercial design, and include medical device, software, electrical, mechanical and biomedical engineering. Headquartered in Maple Grove, Minnesota, Nortech Systems currently has seven manufacturing locations and design centers across the U.S., Latin America and Asia.
Nortech Systems has a book value per share of $13.04 as of March 31, 2024. If you wish to stay within the 0.90 price-to-book maximum, you should pay no more than $11.736 per share ($13.04 × 0.90). However, if the stock price has moved up since passing the Shadow Stock screen, you can still purchase the stock unless the price-to-book ratio goes above 1.00, which equates to a price of $13.04 per share.
The next quarterly review of the Model Shadow Stock Portfolio will take place in early September 2024. Any changes to the portfolio will be announced at the time they are made in our Model Shadow Stock Portfolio Update emails (sign up at www.aaii.com/email).
Friedman Industries, Incorporated (FRD)
(06/11/2024)
Friedman Industries reported a GAAP earnings loss of $0.39 per share for its fourth-quarter 2024 ended March 31. Total revenue increased 6.5% from the prior-year quarter to $132.23 million. The company had a 9% increase in quarterly sales volume year over year and a 19% increase in sales volume for fiscal-year 2024 compared to the prior year.
According to CEO Michael J. Taylor, the company ended fiscal-year 2024 with a strong fourth quarter, making it one of the most profitable years in its history. He noted a significant increase in sales volume, driven by output from the new Sinton, Texas, facility, and anticipates further growth as the facility approaches full production capacity in fiscal 2025.
Looking forward, Friedman Industries expects to continue its success into fiscal 2025, backed by a strong team and a solid company foundation aimed at growing long-term shareholder value. Despite anticipated downtime for new equipment installation at the Decatur, Alabama, facility and planned maintenance at the Sinton facility, sales volume for the first quarter of fiscal 2025 is expected to mirror the fourth quarter of fiscal 2024. However, first-quarter margins are projected to be lower due to declining hot rolled coil steel prices, although this is expected to be offset by hedging gains.
(05/16/2024)
Global Ship Lease reported first-quarter 2024 non-GAAP earnings per share of $2.53, beating the LSEG I/B/E/S consensus estimate of $2.266 per share by 11.7%. First-quarter revenue increased 12.7% from the prior-year quarter to $179.6 million. Net income available to common shareholders was reported to be $89.5 million, representing a 24.0% increase from the prior-year period.
During the first quarter of 2024, Global Ship Lease repurchased an aggregate of 251,772 Class A common shares for a total consideration of $5.0 million. Repurchase prices ranged between $18.98 and $20.83 per share, with an average price of $19.84 per share. Approximately $33.0 million of capacity remains under the company’s share buyback authorization.
Hooker Furnishings Corporation (HOFT)
(06/04/2024)
Hooker Furnishings reported a non-GAAP loss of $0.39 per share for fiscal first-quarter 2025, which ended in April, missing the LSEG I/B/E/S consensus estimate for a loss of $0.025 per share. Total revenue decreased 23.2% from the prior-year quarter to $93.6 million. Operating loss totaled $5.2 million, down from operating income of $2.0 million in the prior-year quarter. All three reporting segments had sales declines.
According to CEO Jeremy Hoff, ongoing weak demand in the furniture industry posed challenges in the quarter. He attributed the company’s operating loss this quarter almost entirely to sales reductions in each segment and strongly believes in a return to profitability with the rebound of demand and revenues, strong economic fundamentals and improved consumer confidence in the future. However, Hoff noted that the company expects some short-term volatility in earnings until the industrywide downturn ends.
(06/07/2024)
Hurco Companies reported total revenue of $45.2 million for fiscal second-quarter 2024 ended April 30, down 16% year over year. The company reported a net loss of $3.9 million, down from net income of $377,000 in the prior-year quarter. The company reported a loss per share of $0.61, versus earnings per share of $0.06 one year ago.
CEO Greg Volovic stated, “In a year of global uncertainty and broader market softening, resulting in tighter margins and lower sales volumes, we are focusing on adjusting our overhead and operating expenses to minimize the impact on operating income while maintaining a strong balance sheet.”
Lakeland Industries, Inc. (LAKE)
(06/04/2024)
Lakeland Industries reported an uptick in sales of 7.6% to $36.3 million for its first-quarter 2025 ended in April compared to the same quarter one year ago. The company also reported net income of $1.7 million, up 30% from the prior-year quarter. Earnings per share were $0.22, which increased 22% year-over-year but missed the LSEG I/B/E/S consensus estimate of $0.31 per share by 29.0%. Gross margin slightly increased to 44.6%, compared to 43.4% in the prior-year quarter. This increase can be attributed to improved sales mix and operational efficiencies.
Looking forward, Lakeland Industries now expects revenue in the range of $150 million to $155 million for fiscal 2025 ending in January. This includes the recently announced Jolly Scarpe and Pacific Helmets acquisitions but does not include the LHD Group fire and rescue business, which is expected to close in June 2024.
(05/20/2024)
Lakeland Industries announced the appointment of James M. Jenkins as its new president and CEO, effective June 1, 2024. Jenkins most recently served as the chief legal officer, corporate development officer and corporate secretary for Transcat Inc.
Natural Gas Services Group, Inc. (NGS)
(06/10/2024)
Natural Gas Services announced the closing of an expansion to its existing credit facility by Texas Capital Bank. The company added $75 million to increase the committed borrowing capacity to $300 million.
(05/23/2024)
Titan Machinery reported first-quarter 2025 revenue of $628.7 million, up 10.4% year over year. Parts revenue was $108.2 million, compared to $96.6 million in the prior-year quarter. Revenue generated from service was $45.1 million, compared to $34.9 million in the prior-year quarter. Revenue from rental and other services was $7.3 million, compared to $8.7 million in the prior-year quarter. Net income was $9.4 million, for earnings per diluted share of $0.41. This compares to net income of $27.0 million, and earnings per diluted share of $1.19, in the prior-year quarter. Earnings missed the LSEG I/B/E/S consensus estimate of $0.41 per share by 36.2%. The main drivers of the decrease in profitability were lower equipment gross margins and incremental floor plan interest expense.
 Get updates about the portfolio that has outperformed the market by 211.9%
since inception!
Get updates about the portfolio that has outperformed the market by 211.9%
since inception!