


John Bajkowski
is the president of AAII.
After the quarterly review of the Model Shadow Stock Portfolio at the beginning of September, two stocks are being removed and two stocks are being added.
The market tumbled at the start of August before bouncing back to finish the month on a positive note, with market leadership shifting back toward larger companies. The Model Shadow Stock portfolio lost 3.6% during August, lowering its year-to-date return to 2.1%. By way of comparison, the Vanguard 500 Index fund (VFINX) gained 2.4% for the month and is up 19.4% for the year through August. The Vanguard Small Cap Index fund (NAESX) gained 0.1% during August and is up 10.1% year to date.
Looking at the S&P market indexes, the S&P 500 index led the market during August with a 2.4% gain, compared to a 0.1% loss for the S&P MidCap 400 index and a 1.4% loss for the S&P SmallCap 600 index.
Small-cap stocks continue to lag larger companies on a trailing 12-month basis. The S&P SmallCap 600 is up 17.3% over the last year, compared to an 18.8% gain for the S&P MidCap 400 and a 27.1% gain for the S&P 500. The Model Shadow Stock Portfolio is up 8.5% over the last year.
In the large-cap segment, growth stocks were up 2.2% for the month, while value was up 3.0%. Over the last year, large-cap growth stocks are up 30.5%, compared to a return of 23.6% for large-cap value stocks.
Mid-cap growth stocks lost 0.7% during August while mid-cap value stocks gained 0.6% during the month. Mid-cap growth stocks are up 20.9% over the last year, compared to a 16.4% gain for mid-cap value stocks over the same period.
Small-cap growth stocks lost 1.6% during August and are up 20.4% over the last year, while small-cap value stocks lost 1.2% during the month and are up 14.0% over the last year.
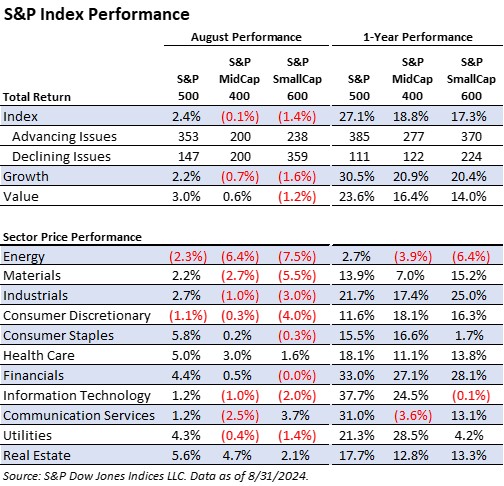
Advancing issues managed to outpace declining issues only in the large-cap segment last month. Within the S&P 500, there were 353 advancing issues compared to 147 declining issues—a ratio of 2.40. The ratio was 1.00 for the S&P MidCap, indicating an equal number of advancing and declining issues. In the S&P SmallCap 600, the ratio was 0.66, indicating that declining issues outnumbered advancing issues during August. Looking back one year, breadth was strongest with larger companies. The ratio of advancing issues to declining issues was 3.47 for S&P 500 constituents, but 1.65 for S&P SmallCap 600 constituents.
Nine of 11 sectors in the S&P 500 were up during August, matching the number from last month although leadership shifted. The difference between the best- and worst-performing sector narrowed during August: 8.1 percentage points, compared to 11.3 percentage points in July. Energy (–2.3%) and consumer discretionary (–1.1%) were the only sectors down in the S&P 500 during the month. Consumer staples was the strongest S&P 500 sector, up 5.8%, reflecting the preference for defensive stocks. Energy was also the weakest sector within the S&P MidCap 400 and the S&P SmallCap 600, reflecting the general downward trend in oil prices recently. Real estate was the strongest sector in the S&P MidCap 400, up 4.7% during August, boosted by the expectation of lower interest rates. Communication services was the top performer in the S&P SmallCap 600, up 3.7%. The other two sectors up during August within the S&P SmallCap 600 were real estate (+2.1%) and health care (+1.6%).
The Model Shadow Stock Portfolio was designed to test the strategy of investing in the 1% intersection of the smallest and cheapest publicly traded stocks. Research conducted by Eugene Fama and Kenneth French (Journal of Finance, June 1992) showed that the smaller the market capitalization of a company, the higher its stock returns. In addition, the lower the ratio of market price to book value, the higher the returns. The highest returns came from those stocks that were in the lowest market-cap decile and the lowest price-to-book decile.
The primary Model Shadow Stock Portfolio selection criteria target the intersection of the smallest 10% of domestic stocks as measured by market cap, along with the “cheapest” 10% of domestic stocks as measured by the price-to-book-value (P/B) ratio. These decile breakpoints are determined by examining domestic companies that are listed on the New York Stock Exchange (NYSE) and then applying the size and value breakpoints for stocks listed on all domestic exchanges. This 1% intersection (10% and 10% combined) constitutes the primary initial selection universe.
The Model Shadow Stock Portfolio is reviewed quarterly to determine portfolio deletions and additions. The quarterly review cycle is tied to the reporting cycle of most firms and limits costly portfolio turnover. AAII’s fundamental stock screening and research database Stock Investor Pro, with data as of September 6, 2024, was used for the market decile analysis.
Value
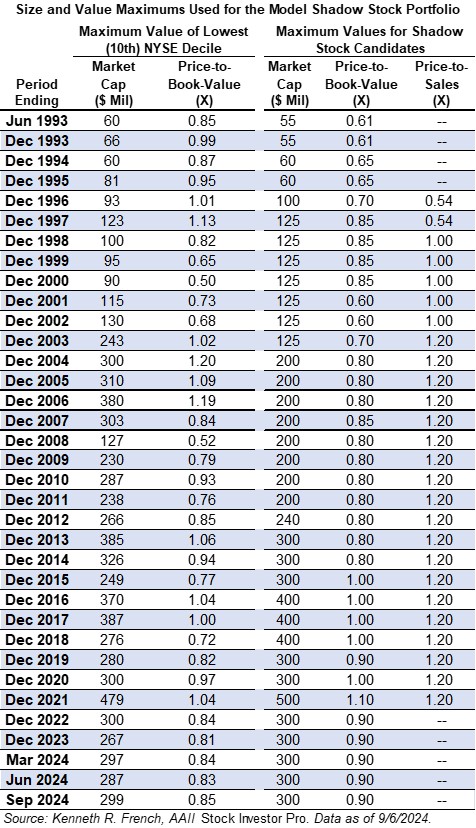
The price-to-book cutoff has increased slightly from 0.83 in June to 0.85. The current initial qualifying maximum price-to-book ratio is 0.90 and we left it unchanged. Qualifying stocks must have a price-to-book ratio of 0.90 or lower when added to the model portfolio. There are currently 1,170 exchange-listed securities with a price-to-book ratio less than or equal to 0.90, down from 1,197 in June. Stocks in the model portfolio are removed for valuation if they exceed three times the initial maximum price-to-book ratio at the time of a quarterly portfolio review.
Mistras Group Inc.  (MG) has the highest price-to-book ratio of 1.70 in the model portfolio. No stocks in the model portfolio exceeded the maximum price-to-book ratio at the time of review.
Size
We examined the market-cap levels of domestic companies listed on the NYSE to determine the size cutoff for the lowest decile when adding stocks to the model portfolio. The lowest decile market-cap level increased from $287 million in June to $299 million using data in Stock Investor Pro as of September 6, 2024. We left the maximum initial qualifying market-cap value unchanged at $300 million. There are currently 1,348 exchange-listed securities with a market cap between $30 million and $300 million, down from 1,443 in June. Holdings are removed if their market cap goes above three times the initial criterion at the time of the quarterly review.
Ducommun Inc. (DCO) has the largest market cap of $938.0 million in the model portfolio, above the $900 million maximum level (3 × $300 million). Ducommun is being removed from the model portfolio because it exceeded the maximum market cap at the time of review. Ducommun was added to the Model Shadow Stock Portfolio on March 7, 2012, at a price of $14.97 per share. It was deleted on September 12, 2024, at $63.20 per share, for a price gain of 322.2%.
Earnings
If a company has trailing 12-month earnings from continuing operations that are negative, the stock is placed on probation; if a subsequent quarter has negative earnings prior to trailing 12-month earnings becoming positive, the stock is deleted. When available, adjusted (non-GAAP) earnings are used to put stocks on probation or remove them.
Hurco Companies Inc. (HURC) and Key Tronic Corp. (KTCC) were on earnings probation at the start of the latest earnings season.
Hurco Companies went on earnings probation when it reported an adjusted loss of $0.61 per share for its fiscal second-quarter 2024 ended April 30, which pushed its trailing 12-month adjusted earnings into the red. Hurco Companies reported a loss of $1.47 per share for its fiscal third-quarter 2024 ended July 31. It is the policy of the Model Shadow Stock Portfolio to remove a stock once its trailing 12-month adjusted earnings go negative and the company reports a subsequent quarterly loss while trailing earnings are still negative. Hurco Companies is being removed from the portfolio due to negative earnings. Hurco Companies was added to the Model Shadow Stock Portfolio on September 6, 2019, at a price of $31.97 per share. It was deleted on September 12, 2024, at $17.90 per share, for a price loss of 44.0%.
Key Tronic went on earnings probation when it reported an adjusted loss of $0.21 per share for its fiscal third-quarter 2024 ended March 30, which pushed its trailing 12-month adjusted earnings into the red. Key Tronic reported an adjusted gain of $0.10 per share for its fiscal fourth-quarter 2024, which ended on June 29. We will continue to keep an eye on Key Tronic’s earnings.
During the second quarter of 2024, American Vanguard Corp. (AVD) and SigmaTron International Inc. (SGMA) reported adjusted losses that pushed their trailing 12-month adjusted earnings into the red. They have been placed on earnings probation.
As of September 11, 22 stocks met the initial selection criteria for the Model Shadow Stock Portfolio, up from 17 last month. AAII members can see and research which companies are currently passing the initial selection criteria in the Shadow Stock Ideas table on AAII.com. The list of new Shadow Stock Ideas is updated daily—Tuesday through Saturday.
Of the 22 qualifying companies, nine were already in the Model Shadow Stock Portfolio at the time of the review. The remaining 13 stocks were examined to ensure adequate liquidity, timely financial filings, and appropriate industry and foreign considerations. The Shadow Stock Portfolio Rules on AAII.com provide guidance on factors to consider when selecting stocks for your portfolio.
With the proceeds from the deletions, as well as the cash held in the portfolio, the portfolio was able to take positions in two new companies.
Gilat Satellite Networks Ltd. (GILT)
Gilat Satellite Networks Ltd. (GILT) is an Israel-based provider of satellite-based broadband communications. The company operates through three segments: commercial, mobility and services divisions. Gilat Satellite designs and manufactures satellite ground segment and networking communications equipment, which it sells to its customers either as network components—modems, block up converters (BUCs), antennas—or as complete network solutions (which include hubs and related terminals and services) or turnkey projects. The equipment that the company develops includes commercial very small aperture terminal (VSAT) systems, defense and homeland security satellite communications systems, solid-state power amplifiers (SSPAs), BUCs, low-profile antennas, on-the-move/on-the-pause terminals, and modems. The company’s equipment is used by satellite operators, service providers, telecommunications operators, system integrators, government and defense organizations, large corporations, and enterprises.
Gilat Satellite has a book value per share of $4.96 as of June 30, 2024. If you wish to stay within the 0.90 price-to-book maximum, you should pay no more than $4.46 per share ($4.96 × 0.90). However, if the stock price has moved up since passing the Shadow Stock screen, you can still purchase the stock unless the price-to-book ratio goes above 1.00, which equates to a price of $4.96 per share. To calculate the maximum purchase price based on the maximum desired price-to-book ratio, multiply the current book value per share ($4.96 for Gilat Satellite) by the maximum price-to-book ratio to be considered for the Model Shadow Stock Portfolio (currently 0.90, or 1.00 for loosened consideration).
Regis Corp. (RGS)
Regis Corp. (RGS) is a hair care company that franchises and owns hair care salons. The company operates through two segments: franchise salons and company-owned salons. The franchise segment consists of approximately 4,391 franchise salons located mainly in strip center locations and Walmart stores. Franchise salons offer hair care and beauty services and retail products. This segment operates primarily in the U.S., Puerto Rico and Canada and includes the Supercuts, SmartStyle, Cost Cutters, First Choice Haircutters, Roosters and Magicuts concepts.
Regis has a book value per share of $24.25 as of June 30, 2024. If you wish to stay within the 0.90 price-to-book maximum, you should pay no more than $21.83 per share ($24.25 × 0.90). However, if the stock price has moved up since passing the Shadow Stock screen, you can still purchase the stock unless the price-to-book ratio goes above 1.00, which equates to a price of $24.25 per share.
The next quarterly review of the Model Shadow Stock Portfolio will take place in early December 2024. Any changes to the portfolio will be announced at the time with a special Model Shadow Stock Portfolio Update email. Sign up for this email so you don’t miss it!
Covenant Logistics Group, Inc. (CVLG)
(08/19/2024)
Covenant Logistics’ board of directors has declared a regular quarterly cash dividend of $0.11 per share of Class A and Class B common stock. The quarterly cash dividend is payable to stockholders of record on September 6, 2024, and is expected to be paid on September 27, 2024. The stock will trade ex-dividend on September 27, 2024. The last dividend increase was in February 2023.
Hooker Furnishings Corporation (HOFT)
(09/05/2024)
Hooker Furnishings reported an earnings loss of $0.19 per share for its fiscal second-quarter 2025 ended in July, compared to positive earnings of $0.07 per share in the prior-year quarter. Earnings missed the LSEG I/B/E/S consensus estimate of –$0.13 per share by 46.2%. Net sales decreased 2.8% year over year from $97.8 million to $95.1 million. Income was reported at a net loss of $1.95 million, down over 200% from positive net income of $785,000 in the prior-year quarter. CEO Jeremy Hoff said, “Challenges in the macroeconomic and furniture retail environment have extended well beyond our expectations … The combination of high interest rates, a housing shortage and elevated home prices have created a sustained housing downturn for over two years.”
(09/03/2024)
Hooker Furnishings Corp. (HOFT) declared a regular quarterly dividend of $0.23 per share. The dividend is payable on September 30, to shareholders of record as of September 13. The stock will trade ex-dividend on Friday, September 13.
(09/06/2024)
Hurco Companies Inc. (HURC) reported an earnings loss of $1.47 per share for its fiscal third-quarter 2024 ended in July, compared to positive earnings of $0.04 per share in the prior-year quarter. Hurco Companies does not have coverage by LSEG I/B/E/S. Sales were $42.7 million, down 19.8% year over year from $53.2 million. The company reported a net income loss of $9.6 million, down from $260,000 in the prior-year quarter. Hurco Companies did not pay dividends this quarter but paid $0.16 in dividends in the prior-year quarter.
Lakeland Industries, Inc. (LAKE)
(09/04/2024)
Lakeland Industries Inc. (LAKE) reported an earnings loss of $0.19 per share for its fiscal second-quarter 2025 ended in July, compared to positive earnings of $0.33 per share in the prior-year quarter, down 157% year over year. Lakeland Industries missed the LSEG I/B/E/S earnings estimate of $0.36 per share by 153.5%. Net sales were $38.5 million, up 16.5% from $33.1 million in the prior-year quarter. Organic revenue growth fell 2.8% year over year.
Saga Communications, Inc. (SGA)
(09/11/2024)
Saga Communications declared a regular quarterly dividend of $0.25 per share. The dividend is payable on October 18, to shareholders of record as of September 25. The stock will trade ex-dividend on Wednesday, September 25.
SigmaTron International, Inc. (SGMA)
(09/03/2024)
SigmaTron International Inc. (SGMA) reported financial results for fiscal fourth-quarter and full-year 2024 ended in April, with a diluted earnings loss of $0.55 per share for the quarter, compared to positive earnings of $0.87 per share in the prior-year quarter. SigmaTron International does not have coverage by LSEG I/B/E/S. Quarterly revenues from operations decreased 25% year over year from $108.3 million to $81.1 million. Net losses were $3.4 million for the quarter, compared to net income of $5.3 million for the prior-year quarter.
(08/29/2024)
Titan Machinery Inc. (TITN) announced a fiscal second-quarter 2025 earnings loss of $0.19 per diluted share, compared to earnings per diluted share of $1.38 in the prior-year quarter. Titan’s earnings loss was in line with the LSEG I/B/E/S consensus estimate. Total revenue decreased 1.4% year over year from $642.6 million to $633.7 million. Cost of revenue for all segments increased 2.4% to $521.3 million, compared to $509.2 million in the prior-year quarter. Gross profit decreased to $112.4 million, compared to $133.4 million the prior-year quarter.
Looking forward to fiscal 2025, Titan Machinery expects adjusted diluted earnings per share of $0.00 to $0.50, down from the previous guidance of $2.25 to $2.75 per share.
 Get updates about the portfolio that has outperformed the market by 211.9%
since inception!
Get updates about the portfolio that has outperformed the market by 211.9%
since inception!