


John Bajkowski
is the president of AAII.
The market climbed a wall of worry to finish up the month of September, with the S&P 500 index gaining 2.1%, compared to a 0.1% loss for the Model Shadow Stock Portfolio. The Federal Reserve delivered its generally expected 0.50 percentage-point decrease in the interest rate, with two 0.25 percentage-point decreases expected later this year. Normally, a declining interest rate environment benefits smaller companies, but larger companies outperformed smaller firms during the month. The S&P 500’s gain of 2.1% compares to gains of 1.2% for the S&P MidCap 400 index and 0.9% for the S&P SmallCap 600 index.
Small-cap stocks continue to lag larger companies for the year. The S&P SmallCap 600 is up 9.3% year to date, compared to a 13.5% gain for the S&P MidCap 400 and a 22.1% gain for the S&P 500. The Model Shadow Stock Portfolio is up 2.0% year to date.
In the large-cap segment, growth stocks were up 2.8% for the month, while value was up 1.1%. Large-cap growth stocks are up 28.2% year to date, compared to a return of 15.4% for large-cap value stocks.
Mid-cap growth stocks gained 1.1% during September, while mid-cap value stocks gained 1.2% during the month. Mid-cap growth stocks are up 16.9% year to date, compared to a 10.0% gain for mid-cap value stocks.
Small-cap growth stocks gained 0.8% during September and are up 12.6% for the year, while small-cap value stocks gained 0.9% during the month and are up 6.1% year to date.
Value has slightly outperformed growth in the small- and mid-cap segments for each of the last three months.
The Model Shadow Stock Portfolio lost 0.1% for the month and is up 2.0% year to date. The Vanguard Small Cap Index fund  (NAESX) gained 2.0% during September and is up 12.3% for the year.
Since its inception in 1993, the AAII Model Shadow Stock Portfolio has a compound annual average return of 13.5%, versus the Vanguard 500 Index fund’s (VFINX) gain of 10.5% per year on average over the same period. Over the same period, the Vanguard Small Cap Index fund posted an average annual gain of 10.0%.

Advancing issues only managed to outpace declining issues in the large- and mid-cap segments last month. Within the S&P 500, there were 324 advancing issues compared to 178 declining issues in September—a ratio of 1.82, down from 2.40 during August. The ratio was 1.44 for the S&P MidCap 400, up from 1.00 during August. In the S&P SmallCap 600, the ratio was 0.91, indicating that declining issues outnumbered advancing issues during September—an improvement over the August ratio of 0.66. Looking back for the last nine months, breadth was strongest with larger companies. Year to date, the ratio of advancing issues to declining issues was 3.55 for S&P 500 constituents but 1.40 for S&P SmallCap 600 constituents.
Eight of 11 sectors in the S&P 500 were up during September, down from nine during August, accompanied by a shift in leadership. The difference between the best- and worst-performing sector widened during September to 9.8 percentage points, compared to 8.1 percentage points in August. Energy (–2.8%), health care (–1.8%) and financials (–0.7%) were the only sectors down in the S&P 500 during the month. Consumer discretionary was the strongest S&P 500 sector, up 7.0%, bouncing back from a loss of 1.1% during August as investors shifted from defensive sectors. Energy was also the weakest sector within the S&P MidCap 400 and the S&P SmallCap 600, but that will likely change in October, as oil prices are jumping on the escalation of fighting in the Middle East. Communication services was the strongest sector in both the S&P MidCap 400 and the S&P SmallCap 600.
Industry and sector competition play a strong role in company performance and stock price valuations. The Model Shadow Stock Portfolio strategy is a deep-value micro-cap approach using the price-to-book-value (P/B) ratio as its primary valuation filter. Notably, the Shadow Stock screen excludes stocks in the financial sector since their financial ratios are not comparable to firms in other sectors. Not surprisingly, the sector weights of the Model Shadow Stock Portfolio are quite different from that of the S&P 500. What is equally surprising is how the sector weights vary across the three S&P indexes.
The table below provides the weighted-average sector weights of the Model Shadow Stock Portfolio as well as the three S&P indexes. With the switch to S&P Global Market Intelligence supplying the fundamental stock data for AAII’s Stock Investor Pro fundamental stock screening and research database, the sector designations now match those used by S&P Dow Jones Indices.
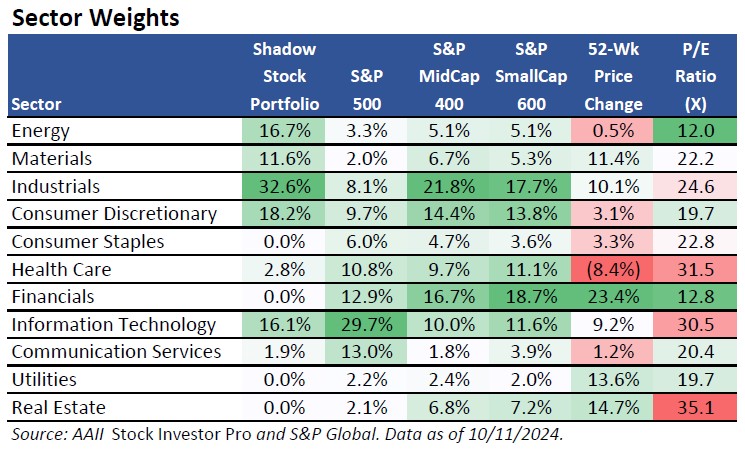
The sector weights have been highlighted to easily show the dominant sectors across the indexes. Higher weights are more darkly shaded. The 52-week price change column is the median value of the constituents of each sector. The last column provides the median price-earnings (P/E) ratio of all the stocks that constitute a given sector. For the price-earnings ratio, darker red shading is related to relatively higher ratios. The price-earnings ratio is more meaningful across sectors than the price-to-book ratio.
The S&P 500 performance is dominated by the information technology sector. Around 14% of the companies in the S&P 500 are in the information technology sector. However, when you consider their market capitalization, they account for 29.7% of the index. The information technology sector accounts for only 10.0% of the S&P MidCap 400 and 11.6% of the S&P SmallCap 600. Information technology accounts for 16.1% of the Model Shadow Stock Portfolio value.
The median price-earnings ratio for the stocks in the information technology sector is 30.5, among the highest of the sectors. Energy stocks have the lowest trailing price-earnings ratio of 12.0.
The table below provides a more detailed view of the summary valuation levels and noteworthy performance ratios of the constituents of the S&P indexes and sectors.
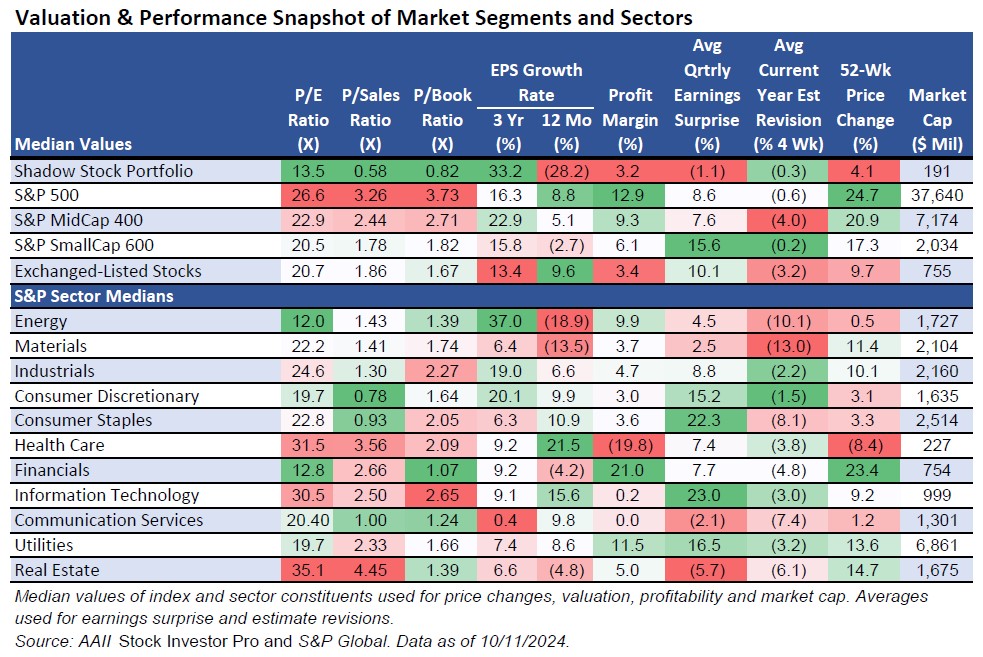
Looking at valuation, larger companies continue to trade with significantly higher multiples of book value, sales or earnings compared to smaller-cap stocks. The median price-earnings ratio is 26.6 for the stocks in the S&P 500 compared to 20.5 for stocks in the S&P SmallCap 600 and 13.5 for stocks in the Model Shadow Stock Portfolio. Stocks normally trade with higher price-earnings ratios if investors anticipate higher future earnings growth as well as greater certainty (lower risk) of achieving growth. Smaller-company stocks normally trade at a discount to larger firms because of their greater risk and lower liquidity, but currently they continue to be more attractively priced.
It is interesting that the historical three-year earnings growth rates are generally greater for the mid-cap firms, but the profitability is higher for the larger firms within the S&P 500. The strongest positive earnings surprises have come within the S&P SmallCap 600, but the greatest downward revisions are found among the mid-cap companies.
One consideration to keep in mind when looking at price-earnings ratios is that cyclical stocks often exhibit low price-earnings ratios near the end of an economic expansion if investors anticipate a slowdown in profits going forward. The trailing price-earnings ratio relates share price to recent historical company performance. It is helpful to use a range of relevant valuation ratios and consider future prospects when making an investment evaluation.
Financials stocks have the strongest 52-week price gains (+23.4%), while health care stocks, as a group, have the weakest one-year price performance (–8.4%). They also continue to be among the most expensive.
The strongest historical earnings growth over the last three years is seen within the energy sector, but its decline over the last 12 months is also the greatest.
Financials stocks have the strongest profit margins (+21.0%), while health care stocks have the weakest (–19.8%).
The strongest positive earnings surprises have come within the information technology sector (+23.0%), followed by consumer staples (+22.3%) and utilities (+16.5%). The biggest negative earnings surprises are found within the real estate (–5.7%) and communication services (–2.1%) sectors.
The materials sector had the largest downward earnings estimate revisions over the last month for the current fiscal year (–13.0%). Notably, all sectors have seen downward revisions in current earnings estimates over the last month.
Nineteen companies passed the initial screen on October 11, down from 22 passing stocks last month. Of the 19, there were four in the energy sector, one in materials, three in industrials, five in consumer discretionary, one in consumer staples, one in health care, one in information technology and three in communication services.
The industrials, consumer discretionary and financials sectors account for the greatest sector concentration of S&P MidCap 400 and the S&P SmallCap 600. Within the Model Shadow Stock Portfolio, industrials make up 32.6% of the portfolio, followed by consumer discretionary (18.2%), energy (16.7%), information technology (16.1%) and materials (11.6%). As it currently stands, the Model Shadow Stock Portfolio is more closely linked to the overall economic cycle based on the sector analysis.
AAII members can see and research which companies are currently passing the initial selection criteria in the Shadow Stock Ideas table on AAII.com. The list of new Shadow Stock Ideas is updated daily—Tuesday through Saturday.
Of the 19 qualifying companies, seven are currently held in the Model Shadow Stock Portfolio: Amplify Energy Corp. (AMPY), Castor Maritime Inc. (CTRM), DMC Global Inc. (BOOM), Fonar Corp. (FONR), Friedman Industries Inc. (FRD), Saga Communications Inc. (SGA) and StealthGas Inc. (GASS).
Qualifying companies are those held in the Model Shadow Stock Portfolio that currently meet the initial addition rules. They are designated as “currently qualifies” in the notes column of the Model Shadow Stock Portfolio table on AAII.com. However, if you go online, the notes may not match the list discussed here since the notes on the website table are dynamically updated daily.
Gilat Satellite Networks Ltd. (GILT), Nortech Systems Inc. (NSYS) and Regis Corp. (RGS) stopped passing the qualifying list when their price-to-book ratios rose above the initial qualifying level of 0.90.
The Model Shadow Stock Portfolio looks for stocks with a price-to book ratio of less than 0.90. However, stocks are not removed from the portfolio until their price-to-book ratio rises to three times the initial maximum value, 2.70 (0.90 × 3). As of October 11, 2024, Mistras Group Inc. (MG) had the highest price-to-book ratio in the Model Shadow Stock Portfolio of 1.87. Covenant Logistics Group Inc. (CVLG) also had an elevated price-to-book ratio of 1.72.
Shadow stocks with a market cap three times the initial market cap maximum—$900 million ($300 million × 3)—at the time of a quarterly review are removed from the model portfolio, assuming there is a suitable replacement. As of October 11, 2024, Covenant Logistics Group had the highest market cap of $697.1 million.
See the current addition and deletion rules for the portfolio.
The next quarterly review of the AAII Model Shadow Stock Portfolio will take place around the beginning of December 2024, after most of the holdings have announced their quarterly earnings.
If there any changes to the model portfolio, they will be announced at the time with a special Model Shadow Stock Portfolio Update email. Sign up for this email so you don’t miss it!
(10/02/2024)
Alpha Pro Tech announced that its board of directors has authorized a $1.0 million expansion of the company’s existing share repurchase program. Alpha Pro Tech now has approximately $1.5 million available to repurchase shares of the company’s common stock, $500,000 of which remains from the previous expansion announced in April 2024.
(09/23/2024)
Ennis reported earnings per diluted share of $0.40 for its fiscal second-quarter 2024 ended August 31, down 4.8% year over year from $0.42. This missed the LSEG I/B/E/S consensus estimate of $0.42 by 4.8%. Revenues decreased 7.3% year over year from $106.8 million to $99.0 million. Gross profits totaled $29.8 million, compared to $33.1 million in the prior-year quarter.
Chairman and CEO Keith Walters commented, “Our results for the quarter met our expectations as larger macroeconomic conditions have softened demand and caused greater competition on price … We carefully monitor and manage our costs in order to maintain our strong profit margins.” Walters stated that though sales decreased from the prior-year quarter, Ennis’ earnings before interest, taxes, depreciation and amortization (EBITDA) margin improved slightly to 18.6% of sales, compared to 18.5% of sales in the prior-year quarter.
(09/27/2024)
Fonar reported diluted earnings of $1.53 per share for fiscal-year 2024 ended in June, up 16% year over year. Fonar does not have coverage by LSEG I/B/E/S analysts. Net total revenues were $102.9 million, up 4% year over year, and income from operations was $16.5 million, up 12% year over year. As of June 30, 2024, the company has repurchased 259,354 shares at a cost of $4.3 million as part of a $9 million stock repurchase plan adopted in September 2022.
Friedman Industries, Incorporated (FRD)
(09/18/2024)
Friedman Industries Inc. (FRD) declared a regular quarterly dividend of $0.04 per share. The dividend is payable on November 15, to shareholders of record as of October 25. The stock will trade ex-dividend on Friday, October 25.
Hooker Furnishings Corporation (HOFT)
(10/07/2024)
Hooker Furnishings entered into a licensing agreement with iconic global lifestyle brand Margaritaville to launch an extensive line of home furnishings that spans various price points and categories. The partnership will include a range of indoor and outdoor furnishings, creating tiered product differentiation that aligns well with Hooker Furnishings’ versatile brand portfolio.
Pangaea Logistics Solutions Ltd. (PANL)
(10/07/2024)
Pangaea Logistics Solutions announced a definitive agreement to purchase the remaining 50% equity ownership of its consolidated subsidiary Nordic Bulk Partners LLC from HS Nordic LLC for $17.2 million in cash. Nordic Bulk Partners was established in 2019 as a joint venture to construct four dry-bulk vessels. The transaction is expected to be completed by November 1, 2024, subject to customary closing terms and conditions.
Upon completion of the transaction, Pangaea Logistics Solutions will own 100% of the equity in Nordic Bulk Partners. As of June 30, 2024, HS Nordic’s 50% equity ownership was recorded on Pangaea Logistics Solutions’ balance sheet as a long-term liability of $16.6 million, which will be extinguished as a result of this purchase.
(09/23/2024)
Pangaea Logistics Solutions and M.T. Maritime Management LLC announced a definitive agreement to merge 15 handysize dry bulk vessels into Pangaea Logistics Solutions’ 26-vessel fleet. The 15 vessels are valued at approximately $295 million, inclusive of vessel-related financing agreements of approximately $102 million, resulting in a total net asset value (NAV) of $193 million. The vessels are owned by Strategic Shipping Inc. and managed by M.T. Maritime.
As consideration, Pangaea Logistics Solutions will issue approximately 19.0 million shares of its common stock to Strategic Shipping, equal to approximately 29% of Pangea Logistics Solutions’ outstanding common stock upon completion of the proposed transaction. This represents the relative NAV of Strategic Shipping’s vessels compared to the estimated NAV of Pangaea Logistics Solutions of approximately $478 million, or about $10.20 per share. The transaction is expected to close in the fourth quarter of 2024, subject to customary closing conditions and shareholder approval.
SigmaTron International, Inc. (SGMA)
(09/19/2024)
SigmaTron International reported a loss of $0.54 per share for its fiscal first-quarter 2025 ended in July, compared to earnings of $0.04 per share in the prior-year quarter. SigmaTron International is not covered by LSEG I/B/E/S. Net sales decreased 14% year over year from $98.1 million to $84.8 million. The company reported a net loss of $3.3 million, compared to net income of $262,000 in the prior-year quarter.
Chairman and CEO Gary Fairhead said, “One area of focus remains the reduction of inventory to reduce working capital requirements, and that has continued during the first quarter as expected. It will remain a focus for the balance of this calendar year. Our relationships with our customers remain excellent. We are working with many of them on new projects and remain optimistic that calendar 2025 will be a much stronger year.”
Vishay Precision Group, Inc. (VPG)
(09/30/2024)
Vishay Precision Group acquired Nokra Optische Prueftechnik and Automation GmbH, a Germany-based, privately held maker of precision measuring and testing equipment for manufacturing. The terms of the transaction were not disclosed. Commenting on the acquisition, board chairman Saul Reibstein said, “Nokra’s technologies fit well with our focus on sensor and precision measurement solutions.”
 Get updates about the portfolio that has outperformed the market by 211.9%
since inception!
Get updates about the portfolio that has outperformed the market by 211.9%
since inception!