

John Bajkowski
is the president of AAII.
 AP
BSET
BZH
CVLG
DFSCX
HOFT
HURC
KTCC
NAESX
PANL
PERI
RCKY
STRT
ULBI
VFINX
VSEC
AP
BSET
BZH
CVLG
DFSCX
HOFT
HURC
KTCC
NAESX
PANL
PERI
RCKY
STRT
ULBI
VFINX
VSEC
The market bounced back strongly during October, with the Model Shadow Stock Portfolio gaining 14.9% for the month. Notably, it was only the second positive monthly return during the current calendar year. Even with the double-digit gain, the Model Shadow Stock Portfolio remains down 19.4% for the year through October. The S&P 500 index was up 8.1% for month, trimming the year-to-date loss to 17.8% for the Vanguard 500 Index fund  (VFINX).
Time will tell if the current strong market move is a bear market rally or the start of a new bull market, but it reminds us that the largest upward market moves are often clustered near the greatest declines, making it difficult to time the market.
Smaller companies led the market during the October rally. The S&P MidCap 400 index was up 10.5% during October and is now down 13.3% for the year, while the Russell 2000 index gained 11.0% during the month and is down 16.9% year to date. The Vanguard Small-Cap Index fund (NAESX) was up 9.9% during the month and has a year-to-date performance of –16.2%, while the DFA U.S. Micro Cap fund (DFSCX) was up 12.6% during October and is down 10.4% for this year through the end of October.
Since its inception in 1993, the AAII Model Shadow Stock Portfolio has a compound annual average return of 13.7%, versus the Vanguard 500 Index fund’s gain of 9.6% per year on average over the same period. Over the same period, the Vanguard Small-Cap Index fund posted an average annual gain of 9.7%.
The performance of growth- versus value-oriented stocks was slanted toward value stocks during the month. In the large-cap segment, value stocks were up 11.5% for the month, trimming their year-to-date loss to 7.0% for 2022. Large-cap growth stocks remain weaker year to date with a 27.3% loss after gaining 4.5% during October.
In the mid-cap segment, value stocks are down 8.0% for the year, after gaining 11.5% during October. Mid-cap growth stocks are down 18.5% for the year, after gaining 9.4% during the month.
Small-cap value stocks are down 11.2% year to date, while small-cap growth stocks are down 22.6%. During October, small-cap value stocks gained 12.6% and small-cap growth stocks gained 9.5%.
All of the sectors posted gains during October, led by energy which was up 25.0% during the month. Energy is the only sector not in the red for 2022, with its 67.4% year-to-date gain. Other sectors up double digits during October include industrials (up 13.9%) and financials (up 12.0%). The weakest sectors during the month were communications services (up 0.6%), consumer discretionary (up 1.1%), real estate (up 2.1%) and utilities (up 2.1%).
Sectors that are lagging this year include communication services (down 37.5%), consumer discretionary (down 29.1%) and real estate (down 27.40%). Beyond energy, the strongest-performing sectors this year include consumer staples (down 3.9%), utilities (down 4.6%) and health care (down 4.6%).
With the sharp market movements and changing economic picture, we thought it might be helpful to present an updated view of the valuations and performance of market segments and sectors. We used AAII’s Stock Investor Pro fundamental stock screening and research database to capture the data and present it with a color gradient to more easily spot trends and patterns across the various segments.
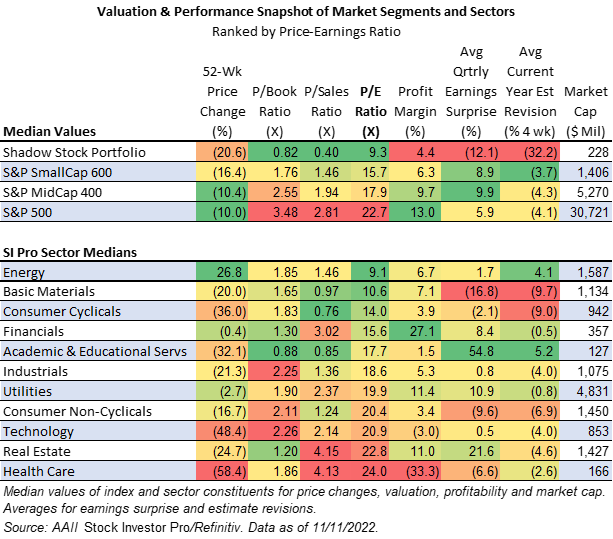
The top portion of the table examines the constituents of the S&P market-capitalization groupings, as well as the current Model Shadow Stock Portfolio. The lower portion of the table examines the exchange-traded constituents of the 11 sectors used by Refinitiv to provide broad industry groupings within Stock Investor Pro. Each section is ranked by the median price-earnings (P/E) ratio of the stocks that make up each index or sector.
Looking at valuation, larger companies continue to trade with significantly higher multiples of book value, sales or earnings compared to smaller-cap stocks. The median price-earnings ratio is 22.7 for the stocks in the S&P 500 compared to 15.7 for stocks in the S&P SmallCap 600 index and 9.3 for stocks in the Model Shadow Stock Portfolio. Stocks normally trade with higher price-earnings ratios if investors anticipate higher future earnings growth as well as lower risk of achieving growth. Smaller-company stocks may normally trade at a discount to larger firms because of their greater risk, but at this time they certainly seem to be more attractively priced.
Even with its strong price performance this year, the stocks in the energy sector continue to display reasonable valuation levels. They are also one of the few sectors in which analysts are increasing their estimates for the current year. On the other end of the spectrum, the health care sector is among the most expensive sectors when examined by price-to-sales or price-earnings ratios, even though it has been the weakest-performing sector over the last year.
One consideration to keep in mind when looking at price-earnings ratios is that cyclical stocks often exhibit low price-earnings ratios near the end of an economic expansion if investors anticipate a slowdown in profits going forward. The trailing price-earnings ratio relates share price to recent historical company performance. It is helpful to use a range of relevant valuation ratios and consider future prospects when making an investment evaluation.
With the market rebounding, 33 stocks met the initial selection criteria for the Model Shadow Stock Portfolio, down from 43 passing stocks last month. AAII members can see and research which companies are currently passing the initial selection criteria in the Shadow Stock Ideas table on AAII.com. The list of new Shadow Stock Ideas is updated daily—Tuesday through Saturday.
Of the 33 qualifying companies as of November 11, 2022, 10 are currently held in the Model Shadow Stock tracking portfolio: Bassett Furniture Industries Inc. (BSET), Container Store Group Inc. (TCS), Delta Apparel Inc. (DLA), Fonar Corp. (FONR), Hooker Furnishings Corp. (HOFT), Hurco Companies Inc. (HURC), Key Tronic Corp. (KTCC), Pangaea Logistics Solutions Ltd. (PANL), SigmaTron International Inc. (SGMA) and Strattec Security Corp. (STRT). Qualifying companies are those held in the Model Shadow Stock Portfolio that currently meet the initial purchase rules. (They are designated as “currently qualifies” in the notes column of the Model Shadow Stock Portfolio table on AAII.com. However, if you go online, the notes may not match the list discussed here since the notes on the website table are dynamically updated daily.)
Last month, 12 stocks in the Model Shadow Stock Portfolio qualified, three stopped meeting the initial rules for qualification, while one started to meet the qualifications rules again.
Beazer Homes USA Inc. (BZH) came off the qualifying list during the last month when its market cap grew above the $350 million maximum initial cutoff as its price increased 17.0% last month.
The stock price of Big 5 Sporting Goods Corp. (BGFV) jumped 20.0% during October, which increased its price-to-book-value (P/B) ratio above the 0.90 maximum initial limit and pushed the company off the qualifying list over the course of the last month.
The price-to-book ratio of Rocky Brands Inc. (RCKY) also moved above the 0.90 initial maximum level over the last month, but its big price gain came largely during November. Rocky Brands was one of three Shadow Stock holdings in the red last month with a 1.9% decline, but the stock price is up 39.3% for the month through November 11, 2022.
SigmaTron International Inc. (SGMA) started to pass the initial list of qualifying companies again. The bear market had pushed SigmaTron’s market cap just below the $30 million initial qualifying minimum. It was down slightly (loss of 0.4%) during October but is up 21.4% this month through November 11, and its market cap of $33.8 million is back above the minimum.
The Model Shadow Stock Portfolio looks for stocks with a market cap (share price times shares outstanding) less than $350 million. Shadow stocks with a market cap three times the initial market cap maximum ($350 million × 3 = $1.05 billion) at the time of a quarterly review are sold from the model portfolio, assuming there is a suitable replacement. Perion Network Ltd. (PERI) has the greatest market cap in the tracking portfolio. Perion Network had a market cap of $1.1 billion as of November 11. Our quarterly review will be performed early next month, potentially making it a candidate for removal if its market cap remains elevated.
As of November 11, 2022, Perion Network also had the highest price-to-book-value ratio in the Model Shadow Stock Portfolio. Its ratio of 2.12 is well above the 0.90 maximum value used for initially qualifying a stock for inclusion to the portfolio. However, stocks are not removed from the portfolio until their price-to-book ratio rises to three times the initial maximum value—2.70 (0.90 × 3 = 2.70). It may help you to think about values below 0.90 as being attractive, while those three times above the initial value are expensive. Allowing the price-to-book ratio to expand for stocks that you own allows your winners to run up a little, since the price-to-book ratio typically gets richer as the stock price goes up. The initial price-to-book level is adjusted over time to reflect the changing market conditions, and we are examining the valuation and size limits for the next quarterly portfolio review.
Click here to see the current purchase and sell rules for the portfolio.
The next quarterly review of the AAII Model Shadow Stock Portfolio will take place around the beginning of December 2022, after most of the holdings have announced their quarterly earnings.
Many of the companies in the Model Shadow Stock Portfolio have already reported quarterly earnings, as noted in the News section below. If a company in the tracking portfolio reports trailing 12-month earnings from continuing operations that are negative, the stock is placed on probation; if a subsequent quarter has negative earnings prior to trailing 12-month earnings becoming positive, the stock is sold. When available, adjusted (non-GAAP) earnings are used to put stocks on probation or sell them. These are earnings that have been adjusted to eliminate the impact of nonrecurring events such as markdown of inventory or goodwill. These are earnings reported in the media and firms reporting consensus estimates. The I/B/E/S adjusted earnings reported in AAII’s Stock Investor Pro are used for Model Shadow Stock Portfolio decisions when they are available.
Early this year, Ampco-Pittsburgh Corp. (AP) went on earnings probation when it reported a loss of $0.65 per share for its 2021 fourth quarter. The company manufactures and sells metal products through its forged and cast engineered products, and air and liquid processing segments. The company has reported positive quarterly earnings for the first three quarters of 2022, but they have not been strong enough to push its trailing 12-month earnings into positive territory.
Dixie Group Inc. (DXYN) reported a loss of $0.29 per share for its 2022 second quarter, compared to a gain of $0.21 per share for the same period one year ago. Dixie Group is a marketer and manufacturer of carpet and rugs to high-end residential customers through the brands Fabrica International, Masland Residential and Dixie Home. The quarterly loss moved its trailing 12-month earnings into the red and placed the firm on earnings probation. On November 3, 2022, Dixie Group reported a quarterly loss of $0.55 per share, making it a candidate for removal during the upcoming quarterly portfolio review.
Ultralife Corp. (ULBI) went on earnings probation after the first quarter of 2022. Ultralife designs and manufactures power and communications systems, including rechargeable and non-rechargeable batteries, charging systems, communications and electronics systems and accessories, as well as custom engineered systems for communications and electronics systems. The company reported positive quarterly earnings for the second quarter but a loss of $0.01 per share during the third quarter, also making it a candidate for removal during the upcoming quarterly portfolio review.
If there any changes to the model portfolio they will be announced at the time with a special Model Shadow Stock Portfolio Update email (sign up at www.aaii.com/email).
Covenant Logistics Group Inc. (CVLG) was the top-performing stock in the portfolio for the month of October, up 31.8%. The company reported its third-quarter 2022 earnings on October 20. Read more about Covenant Logistics in the News section below.
VSE Corp. (VSEC) was the second-best-performing stock in the portfolio for the month of October, up 30.8%. On October 26, the company announced third-quarter 2022 financial results. Read more about VSE Corp. below.
Ampco-Pittsburgh was the worst-performing stock in the portfolio for October, down 17.1%. There was no company-specific news during the month.
Rocky Brands was the second-worst-performing stock in the portfolio for October, down 1.9%. On November 3, the company announced third-quarter 2022 financial results. Read more about Rocky Brands below.
(11/09/2022)
Advanced Emissions Solutions announced third-quarter 2022 financial results. The company reported a diluted loss per share of $0.13. Revenue for the quarter totaled $28.4 million, an 8.1% decline over the comparable quarter of 2021. Income from operations was also down, as the company reported an operating loss of $2.4 million for the third quarter, down from operating profit of $3.2 million a year ago. The net loss for the quarter totaled $2.4 million, down from net income of $24.3 million a year ago. The company states that the decline in earnings is a result of the winding down of Tinuum Group, resulting in a loss of royalty earnings.
(11/10/2022)
Beazer Homes announced fourth-quarter and full-fiscal-year 2022 financial results. Beazer Homes reported quarterly diluted income per share from continuing operations of $2.82, beating the I/B/E/S consensus estimate of $2.06 per share by 36.9%. Net income for the fourth quarter totaled $86.8 million and is $220.7 million for the fiscal year ended September 30, 2022, up 79.5% and 80.9% year over year, respectively. Homebuilding revenue totaled $825.4 million, a 22.0% increase over the comparable quarter of 2021. However, new home orders net of cancellations declined 34.1% from the comparable period of 2021, down to $704 million from $1.07 billion a year ago. Income from continuing operations totaled $110.4 million, a 133.6% increase over the comparable period of 2021.
Big 5 Sporting Goods Corporation (BGFV)
(11/01/2022)
Big 5 Sporting Goods reported third-quarter 2022 diluted earnings per share of $0.29, beating the I/B/E/S consensus estimate of $0.27 per share by $0.02. Net income for the quarter totaled $6.4 million, a 73.6% decline over $24.1 million in the comparable period last year. Net sales also declined, down 9.7% to $261.4 million for the quarter from $289.6 million in the third quarter of 2021. Operating income totaled $8.4 million, a 74.5% decline from $32.8 million a year ago.
Covenant Logistics Group, Inc. (CVLG)
(10/20/2022)
Covenant Logistics Group reported third-quarter 2022 adjusted earnings per diluted share of $1.52, beating the I/B/E/S consensus estimate of $1.37 per share by 11.4%. Net income totaled $50.5 million, a significant increase over $16.4 million in the comparable period a year ago. Total revenue of $311.8 million increased 13.5% over the third quarter of 2021. Operating income of $59 million was also significantly higher than the year-ago quarter’s $20.1 million. Net income in the third quarter was $50.5 million, with non-GAAP adjusted net income of $22.6 million; this compares to net income of $16.4 million and adjusted net income of $17.2 million a year ago.
The main detractor from net income was a $38.5 million gain on the sale of a California operations facility. While adjusted net income is not a GAAP measure, non-GAAP financial measures provide investors with supplemental information that a company may use internally for purposes of assessing profitability.
(11/03/2022)
Dixie Group reported a third-quarter 2022 loss per share of $0.55, which decreased year over year from earnings of $0.35 per share. Net sales of $71.7 million decreased by 19.6% over the same period. For the third quarter, the company’s gross margin was 17.5% and operating margin was –10.0%, compared to a gross margin of 27.9% and operating margin of 7.7% in the same period of fiscal-year 2021.
Chairman and CEO Daniel Frierson commented, “Our third-quarter results were the culmination of the impact of several factors beginning in the fourth quarter of 2021 that have had an unfavorable impact on our company, as well as a general industry downturn that began in mid-second quarter and extended through the third quarter. The lower sales volume in the third quarter was also attributable to a year-over-year loss of approximately $8 million in sales with our largest mass merchant retail customer.”
(11/07/2022)
Ducommun reported third-quarter 2022 earnings per share of $0.96, which decreased year over year from $0.78 per share. Net sales of $186.6 million increased by 14.3% over the same period. For the third quarter, the company’s gross margin was 20.7% and operating margin was 7.1%, compared to a gross margin of 21.6% and operating margin of 8.2% in the same period of fiscal-year 2021.
(11/14/2022)
Fonar reported first-quarter 2023 earnings per share of $0.29, which decreased year over year from $0.55 per share. Net sales of $23.1 million were 2.2% lower than the same period last year. For the first quarter, the company’s income from operations was $3.9 million, a decrease from $5.7 million in the comparable quarter of 2021. Net income totaled $2.7 million, down from $5.2 million in the comparable period of 2021.
(11/09/2022)
Global Ship Lease reported third-quarter 2022 earnings per share of $2.38. This increased from $1.74 per share year over year. Net sales of $172.5 million increased by 24.5% over the same period in 2021. For the third quarter, the company’s operating margin was 58.9%, compared to an operating margin of 57.6% in the same period of fiscal-year 2021.
The company declared a dividend of $0.375 per Class A common share for the third quarter of 2022 to be paid on December 2 to common shareholders of record as of November 22.
(11/01/2022)
Key Tronic reported first-quarter 2023 earnings per share of $0.11, which increased year over year from $0.07 per share. Net sales of $137.3 million were up 3.4% over the same period. For the first quarter, the company’s gross margin was 7.6% and operating margin was 5.1%, compared to a gross margin of 7.6% and operating margin of 6.1% in the same period of fiscal-year 2022.
Kimball Electronics, Inc. (KE)
(11/07/2022)
Kimball Electronics reported first-quarter 2023 earnings per share of $0.38, which increased year over year from $0.10 per share. Net sales of $405.9 million were up 38.7% over the same period. For the first quarter, the company’s gross margin was 7.2% and operating margin was 3.3%, compared to a gross margin of 5.3% and operating margin of 1.6% in the same period of fiscal-year 2022.
(11/08/2022)
NACCO Industries declared a regular cash dividend of $0.2075 per share. The dividend is payable on both the Class A and Class B common stock and will be paid on December 15 to shareholders of record at the close of business on November 30.
(11/02/2022)
NACCO Industries reported third-quarter 2022 earnings per share of $1.45, which decreased year over year from $3.47 per share. Net sales of $61.8 million were up 19.4% over the same period. For the third quarter, the company’s gross margin was 28.9% and operating margin was 15.9%, compared to a gross margin of 27.7% and operating margin of 53.3% in the same period of fiscal-year 2022.
In fourth quarter of 2022, NACCO Industries expects coal deliveries to increase moderately from 2021, while the coal mining segment operating profit is expected to be comparable to the prior year. Lower earnings anticipated at the Falkirk Mine as a result of the reduction in the per-ton management fee through May 2024—to support the transition of the Coal Creek Station Power Plant to Rainbow Energy—are expected to be offset by higher earnings at Coteau Properties Co. due to an increase in tons delivered and contractual price escalation.
Pangaea Logistics Solutions Ltd. (PANL)
(11/09/2022)
Pangaea Logistics Solutions reported third-quarter 2022 earnings per share of $0.42, which decreased year over year from $0.60 per share. Net sales of $184.5 million increased by 13% over the same period. For the third quarter, the company’s operating margin was 17.6%, compared to 13.7% in the same period of fiscal-year 2021.
The company’s board of directors declared a quarterly cash dividend of $0.10 per common share, to be paid on December 15 to all shareholders of record as of December 1.
(10/26/2022)
Perion Network reported third-quarter 2022 earnings per share of $0.53, which increased year over year from $0.28 per share. Net sales of $158.6 million increased by 31.1% over the same period in 2021. For the third quarter, the company’s operating margin was 18.7%, compared to 10.2% in the same period of fiscal-year 2021.
(11/03/2022)
Rocky Brands announced third-quarter 2022 diluted earnings per share of $0.77, beating the I/B/E/S consensus estimate of $0.37 per diluted share by 108.1%. Total revenue of $147.5 million increased 17.5% over the comparable period of 2021. Operating income of $11.3 million increased 73.8% over $6.5 million in the same period of 2021. Net income also increased to $5.7 million, compared to a net loss of $0.38 million a year ago.
Strattec Security Corporation (STRT)
(11/10/2022)
Strattec Security announced third-quarter 2022 earnings per share of $0.03, missing the I/B/E/S consensus estimate of $0.33 per share by 90.9%. Total revenue increased on a year-over-year basis, up 20% from $100.3 million to $120.4 million. The company reported an operating loss of $0.2 million, down from $0.4 million a year ago. Net income attributable to the company was $0.13 million, up from $0.10 million a year ago.
President and CEO Frank Krejci commented, “Current-quarter earnings have been negatively impacted by higher labor costs and escalating price levels of plastic resins, zinc and steel. Given the nature of our long-term customer contracts, implementing price increases to offset these recent changes in costs has been challenging in the short term. Despite these cost pressures and continued constrained volumes by our customers, we achieved profitability for the quarter.”
The Container Store Group, Inc. (TCS)
(11/01/2022)
Container Store announced second-quarter 2022 financial results. The company reported net income per diluted common share of $0.31, beating the I/B/E/S consensus estimate of $0.23 per share by $0.08 or 33.0%. Net sales of $272.7 million declined by 1.2% over $275.9 million in the comparable period of 2021. Income from operations for the quarter was $25 million, down 37.1% from $39.8 million a year ago. Net income for the quarter was $15.7 million, down 42.1% from $27.2 million in the comparable period of 2021.
(10/27/2022)
Ultralife reported a third-quarter 2022 net loss per share of $0.01, missing the I/B/E/S consensus estimate of $0.04 per share by $0.05, or 125%. Total revenue for the quarter was $33.2 million, a 52.3% increase over the comparable period of 2021. The company recorded an operating loss of $0.6 million, a 14.3% increase over the $0.7 million operating loss in the third quarter of 2021. The company recorded a net loss of $0.2 million, up from the $0.6 million net loss in the year-ago quarter. The net loss for the quarter was $0.24 million, up from the net loss of $0.6 million a year ago.
Vishay Precision Group, Inc. (VPG)
(11/07/2022)
Vishay Precision Group announced third-quarter 2022 earnings per share of $0.74, beating the I/B/E/S consensus estimate of $0.59 per share by 25.4%. Gross profit margin, operating profit margin and net profit margin increased across the board. Total revenue for the quarter was $90.1 million, up 9.9% from the comparable period of 2021. Operating income increased 63%, up to $11.9 million from $7.3 million a year ago. Net income of $10.1 million was also up over the third quarter of 2021, increasing 87.0%.
(10/26/2022)
VSE Corp. reported third-quarter 2022 adjusted diluted earnings per share of $0.76, beating the I/B/E/S consensus estimate of $0.70 per share by 9.4%. Total sales of $242.5 million increased 20.9% over the comparable period of 2021, up from $200.6 million. Operating income increased 24.3% to $17.3 million from $13.9 million a year ago. Net income of $9.4 million for the quarter increased 4.4% over the same period of 2021.
 Get updates about the portfolio that has outperformed the market by 211.9%
since inception!
Get updates about the portfolio that has outperformed the market by 211.9%
since inception!