


John Bajkowski
is the president of AAII.
After the quarterly review of the Model Shadow Stock Portfolio, two stocks are being removed and one stock is being added.
The stock market rallied in November, fueled by a clear and uncontested presidential election. The Federal Reserve delivered a 0.25 percentage-point decrease in its benchmark interest rate, signaling that it would continue to lower interest rates but was uncertain of the speed of cuts and would let data drive its decisions. The S&P 500 index gained 5.9%, compared to a 7.4% gain for the Model Shadow Stock Portfolio. The market gain was broad and carried over to smaller companies, with the S&P SmallCap 600 index gaining 10.9%, while the S&P MidCap 400 index yielded 8.8% during November.
Since its inception in 1993, the AAII Model Shadow Stock Portfolio has a compound annual average return of 13.3%, versus the Vanguard 500 Index fund’s  (VFINX) average annual gain of 10.6% over the same period. The Vanguard Small Cap Index fund (NAESX) posted an average annual gain of 10.2% over the same period.
For the year so far, small-cap stocks are still playing catch-up to their larger-cap cousins. The S&P SmallCap 600 is up 18.1% year to date, a solid gain but still lagging the S&P MidCap 400’s 22.7% total return and the S&P 500’s impressive 28.1% return through November 30, 2024. As for the Model Shadow Stock Portfolio—it is down 0.3% year to date.
In November, large-cap growth stocks edged out value stocks with a 5.9% monthly gain versus value’s 5.8%. Year to date, though, it’s a total domination—large-cap growth stocks are up 34.9%, while large-cap value stocks trail at 20.5%. Mid-cap stocks kept the momentum going, with growth stocks gaining 8.8% in November, barely lagging behind the 8.9% gain for value stocks. Year to date, mid-cap growth stocks are up 25.5%, outpacing the 19.7% return for mid-cap value stocks.
Small-cap stocks had a breakout month. Growth stocks surged 11.2% in November, while value stocks weren’t far behind with a 10.7% gain. For the year, though, small-cap growth is ahead with a 20.7% return, compared to the 15.4% gain for small-cap value.
Small-cap stocks remain attractively priced relative to large-cap stocks. The median price-to-book-value (P/B) ratio of the companies in the S&P SmallCap 600 is 1.89, well below the 3.77 median ratio for the companies in the S&P 500. The S&P SmallCap 600 normally trades at a discounted multiple relative to the S&P 500. The discount has averaged 0.66 since 1998 and is currently 0.50.
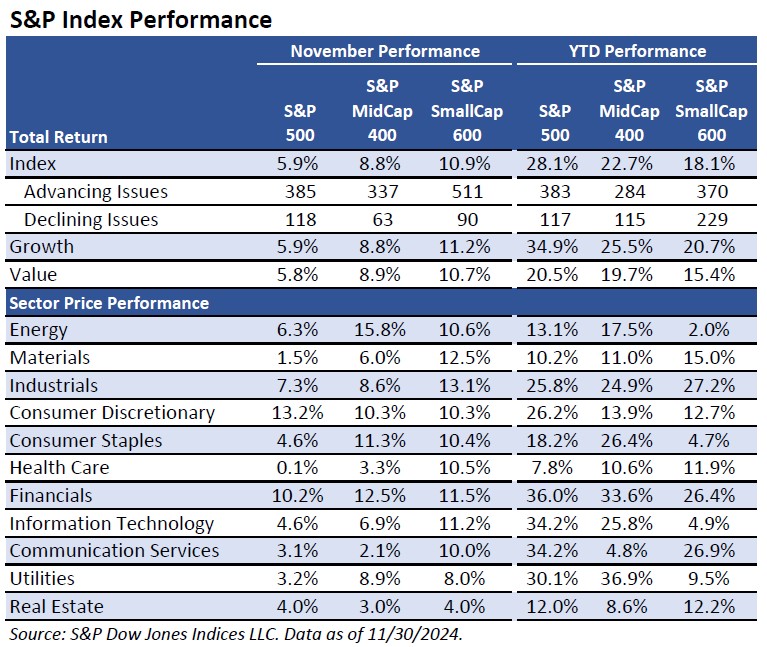
Market breadth turned around in November and was strongly positive across all market segments. Within the S&P 500, there were 385 advancing issues, compared to 118 declining issues—a ratio of 3.26, up from 0.65 during October. The ratio was 5.35 for the S&P MidCap 400, up from 0.76 during October. In the S&P SmallCap 600, the ratio was even stronger at 5.68, an improvement over the October ratio of 0.57. Looking back for the last 11 months, breadth was strongest with larger companies. The ratio of advancing issues to declining issues was 3.27 for S&P 500 constituents, but 1.62 for S&P SmallCap 600 constituents.
All 11 sectors in the S&P 500 were up during November, after only three were up in October. Consumer discretionary did the best, up 13.2% for November and 26.2% year to date, and health care did the worst, up 0.1% for the month and 7.8% year to date. The difference between the best- and worst-performing sector widened during November to 13.1 percentage points, compared to 7.3 percentage points in October.
For November, all 11 sectors within the S&P MidCap 400 gained, compared to six in October. Energy was the strongest sector, up 15.8% during November and 17.5% year to date, while communication services was the weakest, up 2.1% during the month and 4.8% year to date.
The S&P SmallCap 600 also saw increases in all 11 sectors during the month—a strong improvement from October, which had only two gainers. Industrials was the strongest sector, up 13.1% during the month and 27.2% year to date. Real estate was the weakest sector, up 4.0% during November and 12.2% year to date.
Sector performance reflects the impact of potential future government policies, regulations and spending. Lower regulations of banking and financial services are expected along with higher tariffs. Inflationary pressure from proposed higher tariffs and a promised mass deportation of immigrant workers are also weighing on the market.
The Model Shadow Stock Portfolio was designed to test the strategy of investing in the 1% intersection of the smallest and cheapest publicly traded stocks. Research conducted by Eugene Fama and Kenneth French (Journal of Finance, June 1992) showed that the smaller the market capitalization of a company, the higher its stock returns. In addition, the lower the ratio of market price to book value, the higher the returns. The highest returns came from those stocks that were in the lowest market-cap decile and the lowest price-to-book decile.
The primary Model Shadow Stock Portfolio selection criteria target the intersection of the smallest 10% of domestic stocks as measured by market cap, along with the “cheapest” 10% of domestic stocks as measured by the price-to-book ratio. These decile breakpoints are determined by examining domestic companies that are listed on the New York Stock Exchange (NYSE) and then applying the size and value breakpoints for stocks listed on all domestic exchanges. The intersection of 10% constitutes the primary initial selection universe.
The Model Shadow Stock Portfolio is reviewed quarterly to determine portfolio deletions and additions. The quarterly review cycle is tied to the reporting cycle of most firms and limits costly portfolio turnover. AAII’s stock analysis and screening service Stock Investor Pro, with data as of December 13, 2024, was used for the quarterly review.
The price-to-book cutoff has decreased slightly from 0.85 in September to 0.83. The current initial qualifying maximum price-to-book ratio is 0.90 and we left it unchanged. Qualifying stocks must have a price-to-book ratio of 0.90 or lower when added to the model portfolio. There are currently 1,265 exchange-listed securities with a price-to-book ratio less than or equal to 0.90, up from 1,170 in September. Stocks in the model portfolio are removed for valuation if they exceed three times the initial maximum price-to-book ratio at the time of a quarterly portfolio review.
Covenant Logistics Group Inc. (CVLG) has the highest price-to-book ratio in the model portfolio of 1.89. No stocks in the model portfolio exceeded the maximum price-to-book ratio at the time of review.
We examined the market-cap levels of domestic companies listed on the NYSE to determine the size cutoff for the lowest decile when adding stocks to the model portfolio. The lowest decile market-cap level increased from $299 million in September to $380 million using data in Stock Investor Pro as of December 13, 2024. We raised the maximum initial qualifying market-cap value from $300 million to $400 million. There are currently 1,390 exchange-listed securities with a market cap between $30 million and $400 million. Holdings are removed if their market cap goes above three times the initial criterion at the time of the quarterly review.
Covenant Logistics Group also had the highest market cap of $763.1 million, but this did not exceed the $1.2 billion market-cap maximum at the time of review.

If a company has trailing 12-month earnings from continuing operations that are negative, the stock is placed on probation; if a subsequent quarter has negative earnings prior to trailing 12-month earnings becoming positive, the stock is deleted. When available, adjusted (non-GAAP) earnings are used to put stocks on probation or remove them.
Mistras Group Inc. (MG) came into the quarter on earnings probation, while American Vanguard Corp. (AVD) and Hooker Furnishings Corp. (HOFT) went on earnings probation during the third calendar quarter of 2024. Mistras’ trailing 12-month earnings turned positive this past quarter and it came off probation. Clarus Corp. (CLAR) went on earnings probation in the second quarter of 2024 but reported positive earnings per share in the third quarter, as tracked by S&P Global Market Intelligence. Its trailing 12-month earnings are still in the red, and the company remains on earnings probation.
SigmaTron International Inc. (SGMA) has been on earnings probation since the second calendar quarter of 2024, and it reported negative quarterly earnings during the third quarter. It is the policy of the Model Shadow Stock Portfolio to remove a stock once its trailing 12-month adjusted earnings go negative and the company reports a subsequent quarterly loss while trailing earnings are still negative. SigmaTron International is being removed from the portfolio due to negative earnings. SigmaTron International was added to the Model Shadow Stock Portfolio on March 14, 2022, at a price of $8.81 per share. It was deleted on December 16, 2024, at $2.10 per share, for a price loss of 76.2%.
We also examine the portfolio for stocks that no longer meet the initial qualifications, have been held for at least four years and are down from their initial addition price. Key Tronic Corp. (KTCC) has been held for just over four years and is down from its original addition price. It has negative earnings and no longer meets the initial qualifications. Key Tronic is being removed from the portfolio for negative performance since addition. Key Tronic was added to the Model Shadow Stock Portfolio on September 15, 2020, at a price of $7.98 per share. It was deleted on December 16, 2024, at $4.87 per share, for a price loss of 39.0%.
As of December 13, 25 stocks met the initial selection criteria for the Model Shadow Stock Portfolio. AAII members can see and research which companies are currently passing the initial selection criteria in the Shadow Stock Ideas table on AAII.com. The list of new Shadow Stock Ideas is updated daily—Tuesday through Saturday.
Six qualifying stocks were already in the Model Shadow Stock Portfolio at the time of the review. The remaining 19 stocks were examined to ensure adequate liquidity, timely financial filings, and appropriate industry and foreign considerations. The Shadow Stock Portfolio Rules on AAII.com provide guidance on factors to consider when selecting stocks for your portfolio.
With the proceeds from the deletions, as well as the cash held in the portfolio, the Model Shadow Stock Portfolio was able to take a position in one company at just below the average position size for the existing holdings in the tracking portfolio.
Landsea Homes engages in the design, construction, marketing and sale of single-family detached and attached homes in the U.S. The company develops and builds suburban, single-family detached and attached homes; mid- and high-rise properties; and master-planned communities. The company was incorporated in 2013 and is based in Dallas, Texas.
Landsea Homes has a book value per share of $18.27 as of September 30. If you wish to stay within the 0.90 price-to-book maximum, you should pay no more than $16.44 per share ($18.27 × 0.90). However, if the stock price has moved up after being added to the portfolio, you can still purchase the stock unless the price-to-book ratio goes above 1.00, which equates to a price of $18.27 per share. To calculate the maximum purchase price based on the maximum desired price-to-book ratio, multiply the current book value per share ($18.27 for Landsea Homes) by the maximum price-to-book ratio to be considered for the Model Shadow Stock Portfolio (currently 0.90, or 1.00 for loosened consideration).
The next quarterly review of the Model Shadow Stock Portfolio will take place following the beginning of March 2025.
If there are any changes to the model portfolio, they will be announced at the time with a special Model Shadow Stock Portfolio Update email. Sign up for this email so you don’t miss it!
(12/12/2024)
Through a wholly owned subsidiary, Castor Maritime entered into a share purchase agreement with MPC Münchmeyer Petersen & Co. GmbH for the acquisition of 26 million shares representing 74.1% of the shares of the Frankfurt-listed investment and asset manager MPC Münchmeyer Petersen Capital AG. The acquisition price is equal to approximately $192.6 million, payable in cash, excluding any transaction costs. As part of the transaction, Castor Maritime secured a $100 million new senior term loan facility and $50 million in proceeds from the issuance of 50,000 additional Series D cumulative convertible preferred shares, both from Toro Corp. (TORO), a company controlled by Castor Maritime’s chairman Petros Panagiotidis.
Covenant Logistics Group, Inc. (CVLG)
(11/25/2024)
Covenant Logistics Group declared a regular quarterly dividend of $0.11 per share, in line with the prior declaration. The dividend is payable on December 27, to shareholders of record as of December 6. The stock will trade ex-dividend on Friday, December 6.
Hooker Furnishings Corporation (HOFT)
(12/05/2024)
Hooker Furnishings reported fiscal third-quarter 2025 adjusted earnings of $0.03 per share, down from $0.65 per share in the prior-year quarter. Earnings missed the S&P Global consensus estimate of $0.28 per share by 89.3%. Net sales were $104.4 million, down 10.7% year over year from $116.8 million, with operating income of $8.8 million turning into a loss of $7.3 million over the same period.
Lakeland Industries, Inc. (LAKE)
(12/05/2024)
Lakeland Industries reported adjusted earnings of $0.10 per share for its fiscal third-quarter 2025 ended October 31, 2024, down from $0.34 per share in the prior-year quarter. Earnings missed the S&P Global consensus estimate of $0.40 per share by 75%. Net sales were $45.8 million, up 44.5% year over year from $31.7 million, driven mainly by sales of fire service products, which increased 246% over the respective period.
(11/19/2024)
NACCO Industries declared a regular quarterly dividend of $0.2275 per share, in line with the prior declaration. The dividend is payable on December 16, to shareholders of record as of December 2. The stock will trade ex-dividend on Monday, December 2.
(11/18/2024)
Rocky Brands declared a regular quarterly dividend of $0.155 per share, in line with the prior declaration. The dividend is payable on December 17, to shareholders of record as of December 3. The stock will trade ex-dividend on Tuesday, December 3.
(11/25/2024)
Titan Machinery reported diluted earnings of $0.07 per share for its third fiscal quarter of 2024 ended in October, down from $1.32 per share in the prior-year quarter. Earnings beat the S&P Global consensus estimate of $0.05 per share by 40.0%. Total revenue was $679.8 million, down 2.1% year over year from $694.1 million, and gross profit was $110.5 million, down from $138.3 million in the prior-year quarter.
 Get updates about the portfolio that has outperformed the market by 211.9%
since inception!
Get updates about the portfolio that has outperformed the market by 211.9%
since inception!