


John Bajkowski
is the president of AAII.
With a loss of 4.5% during December, the Model Shadow Stock Portfolio ended 2024 in the red, down 4.7%. Market sentiment turned negative due to concerns over persistent inflation, high interest and mortgage rates, and uncertainty regarding the economic impact of changes in tariffs, immigration policy and taxes.
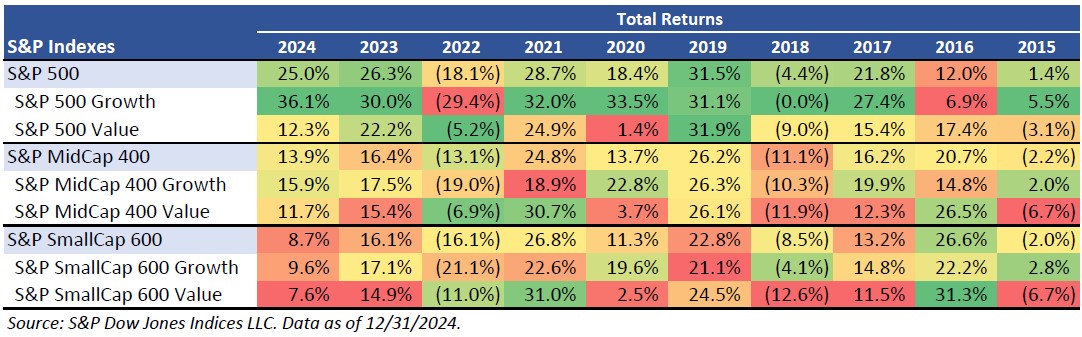
The S&P 500 index lost 2.4% in December. As is often the case with market declines, the losses were more severe with less liquid smaller companies. The S&P SmallCap 600 index lost 8.0% during the month, while the S&P MidCap 400 index gave up 7.1%. The S&P SmallCap 600 was up 8.7% during 2024, compared to a 13.9% gain for the S&P MidCap 400 and a 25.0% gain for the S&P 500.
In the large-cap segment, growth stocks were up 0.9% for the month, while value was down 6.8%. Large-cap growth stocks were up 36.1% for the year, compared to a return of 12.3% for large-cap value stocks.
Mid-cap growth stocks lost 7.6% during December, while mid-cap value stocks lost 6.7%. Mid-cap growth stocks ended the year up 15.9%, compared to an 11.7% gain for mid-cap value stocks.
Small-cap growth stocks lost 9.2% during December, cutting their 2024 gain to 9.6%. Small-cap value stocks lost 6.8% during the month and were up 7.6% for the year.
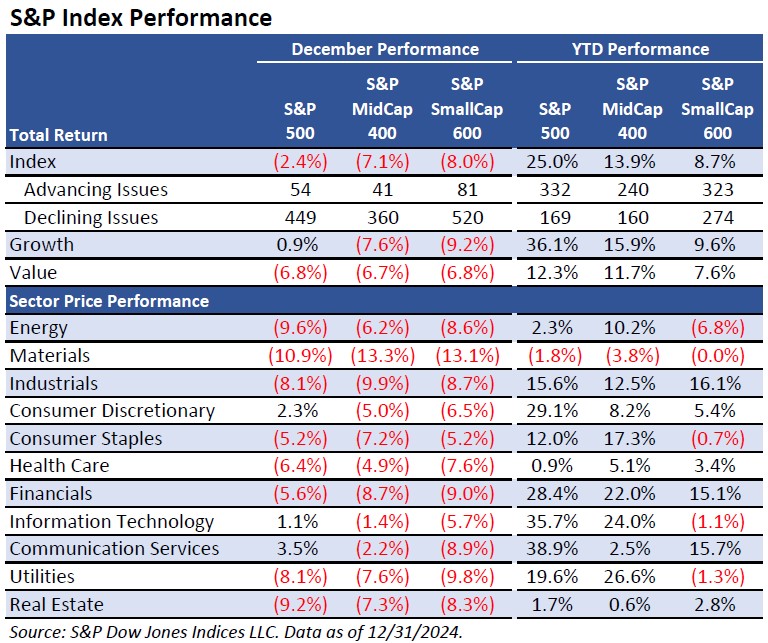
Market breadth was very weak during December. Within the S&P 500, there were 54 advancing issues, compared to 449 declining issues—a ratio of 0.12, down from 3.26 in November. The ratio was 0.11 for the S&P MidCap 400, down from 5.35 during November. In the S&P SmallCap 600, the ratio was 0.16, down from 5.68 during the previous month. Looking back at the last year, breadth was strongest with larger companies. The ratio of advancing issues to declining issues was 1.96 for S&P 500 constituents, but 1.18 for S&P SmallCap 600 constituents.
Only three sectors in the S&P 500 were up during December, after all were up in November. Communication services did best, up 3.5% for the month and 38.9% for the year, and materials did the worst, down 10.9% for the month and down 1.8% for the year.
The relative performance of small-cap stocks to large-cap stocks often runs in streaks. Small-company stocks have outperformed large-company stocks over the long term, but as we have seen, they do not outperform large-cap stocks every year and they tend to exhibit flashes of outperformance followed by periods of underperformance.
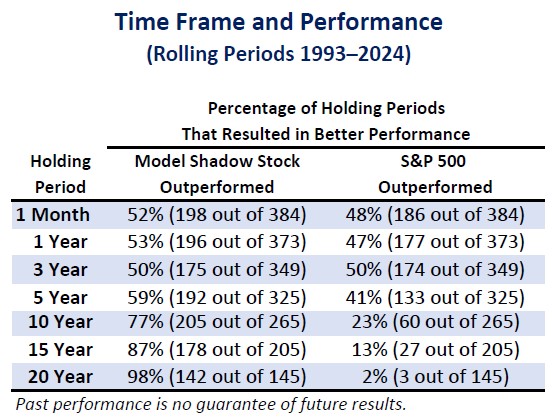
Over its 32-year existence, the Model Shadow Stock Portfolio outperformed the Vanguard 500 Index fund  (VFINX) in 17 of the 32 calendar years, or 53%.
Since calendar years are somewhat arbitrary start and end dates, rolling periods are often used to smooth out seasonality. There have been 373 rolling 12-month time periods over the last 32 years. The Model Shadow Stock Portfolio has outperformed the Vanguard 500 Index fund in 53% of the one-year periods. When it comes to three-year holding periods, the Model Shadow Stock Portfolio has outperformed the Vanguard 500 Index fund in 50% of the periods, while outperforming the index fund in 59% of the five-year rolling periods and 77% of the 10-year rolling periods over last 32 years. The S&P 500 has outperformed the Model Shadow Stock Portfolio in 13% of the 205 15-year holding periods and 2% of the 145 20-year holding periods.
It is important to consider that a historical pattern may not repeat itself in the future, but longer holding periods normally provide a greater likelihood that stocks exhibit their potential for positive returns. A very practical way to view investor risk is to examine the likelihood that your invested money will diminish from the time of the initial investment to the end of the holding period time frame and to keep in mind that the variability of expected annual returns is reduced with longer holding periods.
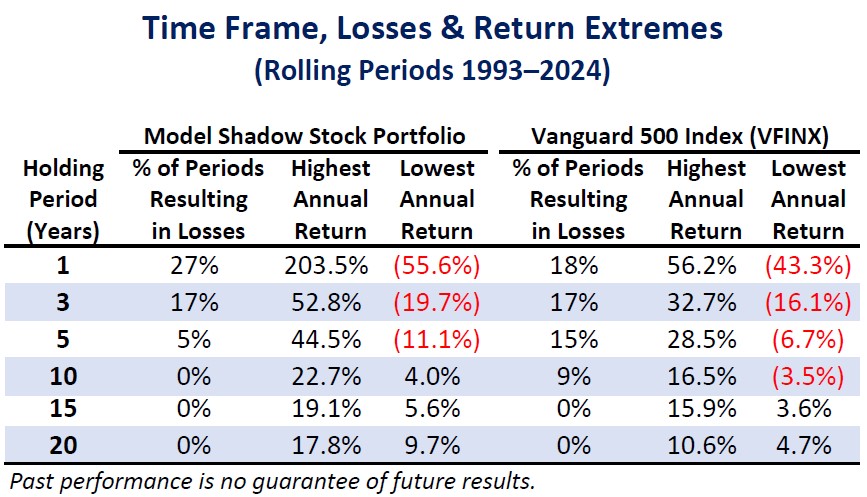
This table assumes an investment in the Model Shadow Stock Portfolio or the Vanguard 500 Index fund that remains invested for the holding period indicated. The table indicates the percentage of times the portfolio would have suffered a loss from 1993 through 2024. It also includes the greatest compound annual gain and loss observed for the various holding periods. For example, using five-year holding periods, the Model Shadow Stock Portfolio experienced a loss in 5% of the 325 holding periods. The greatest compound annual loss was 11.1% for the five-year holding period of April 2015 through March 2020, and the greatest compound annual gain was 44.5% for the five-year holding period of March 2009 through February 2014.
We can expect a large variability in stock market returns over the short term, but that variability starts to get reduced as the holding period increases. The Model Shadow Stock Portfolio gained as much as 203.5% for one 12-month holding period (April 2020 through March 2021), but it has also lost more than half its value during a 12-month holding period (55.6% loss from March 2008 through February 2009). Stocks offer the potential for greater returns over the long term compared to safer holdings such as Treasury bills, but you must have a longer time horizon to help realize the potential. The variability of returns—risk as measured by the chance of loss—goes down as the holding period gets longer.

This table displays the annual returns for the S&P 500 select sectors, ranked by their 2024 performance. We have color coded the returns for each year so that the best-performing groups are bright green while the weakest groups are a vibrant red. The color scaling allows you to more easily see how the sectors’ fortunes have flipped from year to year.
The communications and information technology sectors were once again top-performing groups for the year, fueled by interest in artificial intelligence (AI). Financials benefited from decline in interest rates during the year. The utilities sector swung from a loss of 7.1% in 2023 to a gain of 23.4% in 2024. It also benefited from lower interest rates as well as increasing demand for electricity to fuel the data centers supplying the processing demand in the growth of AI. As we have often observed, dramatic rotation occurs from year to year as leadership shifts along with the economic climate and investor sentiment.
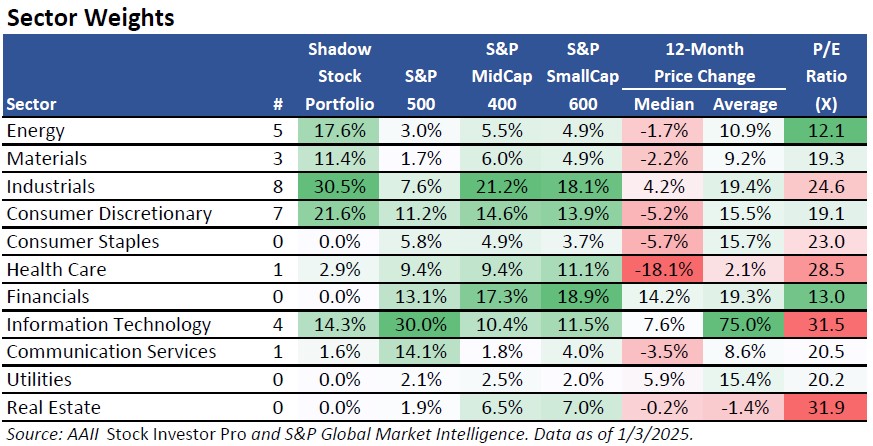
The Model Shadow Stock Portfolio uses a bottom-up quantitative approach to making stock additions and deletions. Financials and utilities stocks are excluded from consideration. Financials stocks are excluded because their balance sheet assets and liabilities are not well suited to analysis using the price-to-book-value (P/B) ratio. The sector makeup of the Model Shadow Stock Portfolio is not actively managed, yet it does impact the portfolio’s performance. The table below indicates the current sector composition of the portfolio. The portfolio is currently very heavily weighted toward the industrials and consumer discretionary sectors.
Large-cap growth stocks maintained their dominance during 2024. There was a brief midyear period during 2024 when investors rotated into small-cap stocks. However, increased stock market volatility in August sparked growing economic concerns and shifted leadership back to large-cap growth companies. Large-company stocks have generally been the dominant segment over the last 10 years. As displayed in the table below, small-cap stocks were only leaders in 2016.
Since its inception in 1993, the AAII Model Shadow Stock Portfolio has a compound annual average return of 13.1%, versus the Vanguard 500 Index fund’s gain of 10.5% per year on average over the same period and the Vanguard Small Cap Index fund’s (NAESX) average annual gain of 9.9%.
Twenty-six stocks met the initial selection criteria for the Model Shadow Stock Portfolio as of January 13, 2025, compared to 26 one month ago. AAII members can see and research which companies are currently passing the initial selection criteria in the Shadow Stock Ideas table on AAII.com. The list of new Shadow Stock Ideas is updated daily—Tuesday through Saturday.
Of the 26 qualifying companies, five are currently held in the Model Shadow Stock Portfolio: Amplify Energy Corp. (AMPY), Landsea Homes Corp. (LSEA), Pangaea Logistics Solutions Ltd. (PANL), Rocky Brands Inc. (RCKY) and StealthGas Inc. (GASS).
Qualifying companies are those held in the Model Shadow Stock Portfolio that currently meet the initial addition rules. (They are designated as “currently qualifies” in the notes column of the Model Shadow Stock Portfolio table on AAII.com. However, if you go online, the notes may not match the list discussed here since the notes on the website table are dynamically updated daily.)
Saga Communications Inc. (SGA) came off the qualifying list because analysts are expecting the company to post a loss for its current quarter.
As of January 13, 2025, Covenant Logistics Group Inc. (CVLG) had the highest price-to-book ratio in the Model Shadow Stock Portfolio. Its ratio of 1.75 is above the 0.90 maximum value used for initially qualifying a stock for inclusion in the portfolio. However, stocks are not removed from the portfolio until their price-to-book ratio rises to three times the initial maximum value (2.70).
Covenant Logistics Group also had the highest market capitalization in the portfolio, with a value of $704.6 million as of January 13, 2025. The Model Shadow Stock Portfolio looks for stocks with a market cap (share price times shares outstanding) greater than $30 million but less than $400 million when adding stocks to the portfolio. Shadow stocks with a market cap three times the initial market-cap maximum ($400 million × 3 = $1.2 billion) at the time of a quarterly review are removed from the portfolio, assuming there is a suitable replacement.
Click here to see the current addition and deletion rules for the portfolio.
The next quarterly review of the AAII Model Shadow Stock Portfolio will take place around the beginning of March 2025, after most of the holdings have announced their quarterly earnings. If there are any changes to the model portfolio, they will be announced in the Model Shadow Stock Portfolio Update email. Sign up for this email so you don’t miss it!
The final table below shows the performance of all the holdings within the Model Shadow Stock Portfolio during 2024. The return on investment (ROI) considers the impact of cash dividend distributions during the year.
The Model Shadow Stock Portfolio ended the year with 29 holdings, but it held 39 stocks over the course of 2024. The portfolio turnover ratio was 32% in 2024, which translates to an average holding period of 3.1 years. The turnover ratio was higher than the long-term average of 25%, which equates to a four-year average holding period. Note that the turnover ratio is calculated by the dollar value of additions and deletions and how they relate to the average portfolio value.

In case you missed it, we held a webinar for members on Monday, January 8, where we delved into the Model Shadow Stock Portfolio’s annual performance, spotlighting key stocks. We also discussed 2024’s small-cap trends and answered member questions. To watch the recording, go to our Webinars page at AAII.com.
Lakeland Industries, Inc. (LAKE)
(12/16/2024)
Lakeland Industries’ Lakeland Fire + Safety completed acquisition of U.S.-based Veridian Fire Protective Gear in an all-cash transaction valued at approximately $25 million, subject to post-closing adjustments and customary holdback provisions. The acquisition was financed under Lakeland Industries’ revolving credit facility with Bank of America. Founded in 1992, Veridian is a leading provider of firefighter protective apparel, including fire and rescue garments, gloves, and boots. The company has an annual revenue of approximately $21 million.
 Get updates about the portfolio that has outperformed the market by 211.9%
since inception!
Get updates about the portfolio that has outperformed the market by 211.9%
since inception!