


John Bajkowski
is the president of AAII.
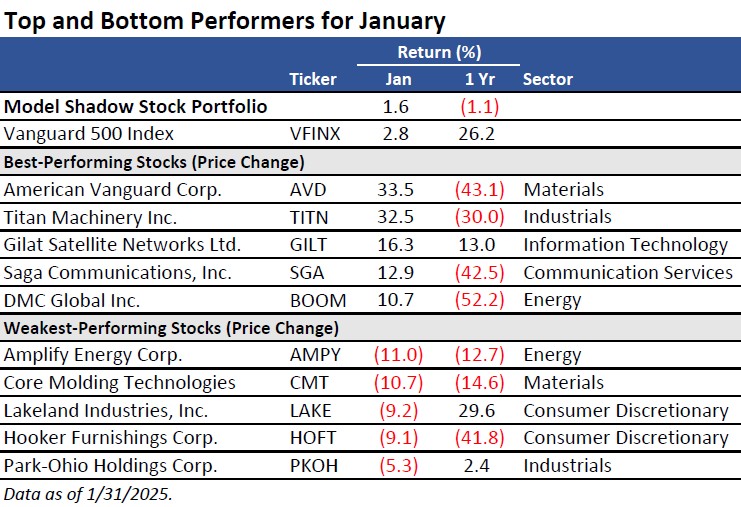
The market ended up posting broad gains during January following December’s extensive declines. The S&P 500 index gained 2.8%, compared to a 1.6% gain for the Model Shadow Stock Portfolio. The S&P MidCap 400 index gained 3.8% during January, while the S&P SmallCap 600 index gained 2.9%. Let’s hope that the January barometer of “as goes January, so goes the year” holds up this year. S&P Dow Jones Indices noted that the January barometer has been correct 70.8% of the time since 1929, and it certainly held true in 2024.
As expected, the Federal Reserve held interest rates steady during January and noted that it was taking a wait-and-see approach for the time being. The yield on the 10-year Treasury bond stood at 4.55% at the end of the month, down slightly from 4.58% at the end of December.
Small-cap stocks continue to lag larger companies for the year. The S&P SmallCap 600 is up 16.5% over the last year, compared to a 20.4% gain for the S&P MidCap 400 and a 26.4% gain for the S&P 500. The Model Shadow Stock Portfolio is down 1.1% over the last year.
In the large-cap segment, growth stocks were up 2.7% for the month, while value was up 2.9%. Large-cap growth stocks are up 35.8% over the last year, compared to a return of 15.2% for large-cap value stocks.
Mid-cap growth stocks gained 3.8% during January, while mid-cap value stocks gained 4.0%. Mid-cap growth stocks are up 20.7% over the last year, compared to a 19.8% gain for mid-cap value stocks.
Small-cap growth stocks gained 4.0% during January and are up 17.0% for the year, while small-cap value stocks gained 1.8% during the month and are up 15.7% over the last year.
Market breadth turned around in January and was strong across all market segments. Within the S&P 500, there were 354 advancing issues, compared to 149 declining issues—a ratio of 2.38, up from 0.12 during December. The ratio was 2.58 for the S&P MidCap 400, up from 0.11 during December. In the S&P SmallCap 600, the ratio was a bit weaker at 1.41, but it was a large improvement over the December ratio of 0.16. Looking back at the last year, breadth was strongest with larger companies. The ratio of advancing issues to declining issues was 2.46 for S&P 500 constituents, but 1.57 for S&P SmallCap 600 constituents.
Ten of the 11 sectors in the S&P 500 were up during January, after only three were up in December. Communication services did best, up 9.0% for January and 44.4% over the last year. Information technology did the worst, down 2.9% for the month, but still up 26.8% over the last year. The difference between the best- and worst-performing sectors narrowed during January to 11.9 percentage points, compared to 14.4 percentage points in December. News that private Chinese artificial intelligence (AI) start-up DeepSeek was able to develop and launch a powerful free open-source large language model (LLM) using both older and fewer Nvidia Corp.  (NVDA) chips hit certain sectors hard at the end of the month.
For January, all 11 sectors within the S&P MidCap 400 gained, a complete reversal from December. Financials was the strongest sector, up 5.8% during the month and 29.0% for the year, while real estate was the weakest, up 0.4% during the month and 7.5% over the last year.
The S&P SmallCap 600 saw increases in seven of the 11 sectors during the month—a strong improvement from December, which had no gainers. Health care was the strongest sector, up 7.6% during the month and 15.8% for the year. Consumer staples was the weakest sector, down 1.5% during January and unchanged over the last year.
Twenty-nine stocks met the initial selection criteria for the Model Shadow Stock Portfolio as of February 12, 2025, compared to 26 one month ago. AAII members can see and research which companies are currently passing the initial selection criteria in the Shadow Stock Ideas table on AAII.com. The list of new Shadow Stock Ideas is updated daily—Tuesday through Saturday.
Of the 29 qualifying companies, eight are currently held in the Model Shadow Stock Portfolio: Amplify Energy Corp. (AMPY), Core Molding Technologies Inc. (CMT), Fonar Corp, (FONR), Landsea Homes Corp. (LSEA), Pangaea Logistics Solutions Ltd. (PANL), Rocky Brands Inc. (RCKY), Regis Corp. (RGS) and StealthGas Inc. (GASS).
Qualifying companies are those held in the Model Shadow Stock Portfolio that currently meet the initial addition rules. (They are designated as “currently qualifies” in the notes column of the Model Shadow Stock Portfolio table on AAII.com. However, if you go online, the notes may not match the list discussed here since the notes on the website table are dynamically updated daily.)
No current holdings came off the qualifying list over the last month.
As of February 12, 2025, Covenant Logistics Group Inc. (CVLG) had the highest price-to-book-value (P/B) ratio in the Model Shadow Stock Portfolio. Its ratio of 1.63 is above the 0.90 maximum value used for initially qualifying a stock for inclusion in the portfolio. However, stocks are not removed from the portfolio until their price-to-book ratio rises to three times the initial maximum value (2.70).
Covenant Logistics Group also had the highest market capitalization in the portfolio, with a value of $701.9 million as of February 12, 2025. The Model Shadow Stock Portfolio looks for stocks with a market cap (share price times shares outstanding) greater than $30 million but less than $400 million when adding stocks to the portfolio. Shadow stocks with a market cap three times the initial market-cap maximum ($400 million × 3 = $1.2 billion) at the time of a quarterly review are removed from the portfolio, assuming there is a suitable replacement.
Click here to see the current addition and deletion rules for the portfolio.

American Vanguard Corp. (AVD), a manufacturer and marketer of solutions for the agriculture industry in the areas of crop protection and nutrition, turf and ornamental management, and commercial pest control, was the best-performing stock during January with a gain of 33.5%.
Titan Machinery Inc. (TITN)—an operator of a network of full-service agricultural and construction equipment stores in the U.S., Europe and Australia—was close behind with a 32.5% gain during the month. Robert W. Baird & Co. upgraded its rating for Titan Machinery to outperform in January and raised its price target from $14 to $25 per share. The stock closed at $18.01 per share on Thursday, February 13, 2025.
Amplify Energy was the weakest holding during January, down 11.0%. The firm is an independent oil and natural gas company engaged in the acquisition, development, exploitation and production of oil and natural gas properties with operations focused in Oklahoma, the Rockies, federal waters offshore Southern California, East Texas/North Louisiana and the Eagle Ford Shale in Texas. Amplify Energy announced that it has entered into a definitive merger agreement with privately held Juniper Capital to combine with certain Juniper Capital portfolio companies that own oil-weighted producing assets and leasehold interests in the Denver-Julesburg Basin and Powder River Basin. Under the terms of agreement, Amplify Energy will issue Juniper Capital approximately 26.7 million shares of Amplify Energy common stock and assume approximately $133 million in net debt. Amplify Energy shareholders will retain approximately 61% of Amplify Energy’s outstanding equity and approximately 39% will be owned by Juniper Capital. The transaction is expected to close in the second quarter of 2025, subject to customary closing conditions, including obtaining the requisite shareholder and regulatory approvals.
Additional news for the model portfolio holdings is presented at the end of the email.
The next quarterly review of the AAII Model Shadow Stock Portfolio will take place around the beginning of March 2025, after most of the holdings have announced their quarterly earnings. If there are any changes to the model portfolio, they will be announced in the Model Shadow Stock Portfolio Update email. Sign up for this email so you don’t miss it!
“The real key to making money in stocks is not to get scared out of them.”
—Peter Lynch
As investors, our convictions are frequently tested. We may intellectually understand that the stock market offers the greatest opportunity to maximize our long-term wealth, but we must also have the emotional strength to live with the short-term volatility that helps to boost long-term stock returns.
It may be tempting to think that you can improve your rate of return by getting out of the market during declines and jumping back in when the market improves. However, it has been shown that the best and worst trading days tend to be clustered together. Missing the worst days typically also means missing the best days. Note that six of the 10 best trading days of the market occurred within two weeks of the 10 worst trading days.
A J.P. Morgan Asset Management study notes that as of year-end 2021, “seven of the best days have occurred within two weeks of their corresponding worst day; often the spread is much closer than that ... Moreover, the worst days overwhelmingly occur before the best days: Over the last 20 years, six of the seven best days occurred after the worst day.”
The table below reveals what impact simply missing the best-performing month of a given year would have on the annual return realized by the Model Shadow Stock Portfolio and how that would impact its long-term rate of return. The table displays the year-by-year returns for the Model Shadow Stock Portfolio and the Vanguard 500 Index fund (VFINX). The first two columns show the returns for the best and worst individual months for each calendar year. The Always Invested column shows the annual return for each year. The remaining three columns then show the annual return if both the worst and best months are ignored each year, the return if the best month of each calendar year is ignored, and the return if the worst month of each calendar year is excluded.

For example, the Model Shadow Stock Portfolio gained 32.3% during 1993. The greatest monthly gain during 1993 came in December, when the portfolio gained 7.3%. Due to the impact of compounding, the annual return for the Model Shadow Portfolio is reduced from 32.3% to 23.3% when the impact of gaining 7.3% during December 1993 is taken out of the equation [(1 + 0.323) ÷ (1 + 0.0732) – 1]. June 1993 saw the weakest performance during the year, but the portfolio only lost 0.04%, so the impact of excluding the loss for the year was minimal, improving the return from 32.3% to 32.4%.
Being out of the market during the best-performing month each year over the history of the Model Shadow Stock Portfolio reduced the compound annual growth rate (CAGR) from 13.1% to 2.3%.
If you were out of the market during the worst month of each year, the compound annual growth rate is increased from 13.1% to 24.5%.
Even more surprising was the impact of being out of the market for both the best and worst month of each year. The 13.1% return of the Model Shadow Stock Portfolio as a result of skipping both the best and worst month goes down to 12.6%. The impact of giving up the best-performing month of each year outweighs the benefit of being out of the market during the weakest month of each year.
The total annual return of the Vanguard 500 Index fund is reduced from 10.5% to 3.5% when out of the market during its best month each year, while jumping to 17.7% if the worst month is ignored each calendar year. Ignoring both the best and worst month results in an annual return of 10.3%, just below the 10.5% compound annual return of being fully invested over the last 32 years.
The allure of market timing is certainly strong. The reality is that it is very difficult to successfully time entry and exit points. Many successful trend-following investors acknowledge that the primary benefit of market timing is reducing extreme volatility, not boosting long-term rates of returns.
(01/16/2025)
Amplify Energy entered into a definitive merger agreement with Juniper Capital Advisors L.P. to combine with certain Juniper Capital portfolio companies that own oil-producing assets and leasehold interests in the Denver-Julesburg Basin and Powder River Basin. Under the terms of the agreement, Amplify Energy will issue Juniper Capital 26.7 million shares of Amplify Energy common stock and assume approximately $133 million in net debt. Amplify Energy shareholders will retain approximately 61% of the company’s outstanding equity and approximately 39% will be owned by Juniper Capital. The transaction is expected to close in the second quarter of 2025, subject to closing conditions.
Covenant Logistics Group, Inc. (CVLG)
(01/23/2025)
Covenant Logistics Group reported fourth-quarter 2024 adjusted diluted earnings of $0.49 per share, down 10.9% from $0.55 per share in the prior-year quarter. Earnings were in line with the S&P Global consensus estimate. Total revenue was $277.3 million, up 1.2% year over year from $273.9 million. Net income was $6.7 million, down 50% year over year from $12.8 million.
(01/27/2025)
DMC Global was issued a public letter by Steel Connect Inc. explaining Steel Connect’s frustration with its attempts to purchase the remaining shares of DMC Global, as Steel Connect owns approximately 9.9% of the outstanding shares. The letter reiterates the previous offers they gave, including: acquiring remaining shares at $16.50 per share in May 2024, acquiring DMC Global’s DynaEnergetics and NobelClad businesses for between $185 million and $200 million in cash and DMC Global stock, and purchasing preferred stock in November 2024. In the letter, Steel Connect states that no progress has been made and shareholders are waiting patiently.
Friedman Industries, Incorporated (FRD)
(02/07/2025)
Friedman Industries reported a loss of $0.17 per share for its fiscal third-quarter 2024 ended December 31, down from earnings of $0.16 per share in the prior-year quarter. Friedman Industries does not have earnings coverage by S&P Global. Net sales were $94.1 million, down 18.9% year over year from $116.0 million. Earnings from operations were $1.2 million, down from $6.2 million in the prior-year quarter.
Gilat Satellite Networks Ltd. (GILT)
(02/12/2025)
Gilat Satellite reported fourth-quarter 2024 diluted earnings of $0.15 per share, down from $0.41 per share in the prior-year quarter. Earnings were 20.0% higher than the S&P Global consensus estimate of $0.125 per share. Revenues were $305.4 million, up 14.8% year over year from $266.1 million. Operating income was $27.7 million, down 1.8% year over year from $28.1 million.
Kimball Electronics, Inc. (KE)
(02/04/2025)
Kimball Electronics reported diluted earnings of $0.29 per share for its fiscal second-quarter 2025 ended December 31, 2024, down from $0.33 per share in the prior-year quarter. Earnings were 28.9% higher than the S&P Global consensus estimate of $0.225 per share. Net sales were $357.4 million, down 15.2% year over year from $421.2 million. Operating income was $8.2 million, down 50.5% year over year from $16.6 million.
During the quarter, Kimball Electronics returned $3.0 million to shareholders through the repurchase of common stock.
Lakeland Industries, Inc. (LAKE)
(02/04/2025)
Lakeland Industries declared a regular quarterly dividend of $0.03 per share, in line with the prior declaration. The dividend is payable on February 24, to shareholders of record as of February 17. The stock will trade ex-dividend on Monday, February 17.
(01/22/2025)
Lakeland Industries announced an underwritten public offering of its common stock, including a 45-day option to purchase up to an additional 15% of the shares under the same terms and conditions. Lakeland Industries will sell all of the common stock shares offered in the sale. The company intends to use the net proceeds from the proposed offering for the repayment of certain indebtedness, as well as for operations and the growth of its business, including working capital and other general corporate purposes.
(02/12/2025)
Regis reported adjusted diluted earnings of $0.61 per share for its fiscal second-quarter 2025 ended December 31, 2024, up from a loss of $0.18 per share in the prior-year quarter. Regis does not have earnings coverage by S&P Global. Total revenue was $46.7 million, down 8.5% year over year from $51.1 million, with the advertising fund contributions segment seeing the largest decrease at 19.4%. Operating income was $5.5 million, up 15.0% year over year from $4.8 million.
Saga Communications, Inc. (SGA)
(02/05/2025)
Saga Communications declared a regular quarterly dividend of $0.25 per share, in line with the prior declaration. The dividend is payable on March 7, to shareholders of record as of February 18. The stock will trade ex-dividend on Tuesday, February 18.
Vishay Precision Group, Inc. (VPG)
(02/12/2025)
Vishay Precision Group reported fourth-quarter 2024 adjusted diluted earnings of $0.03 per share, down from $0.61 per share in the prior-year quarter. Earnings were 77.8% lower than the S&P Global consensus estimate of $0.135 per share. Net revenues were $72.7 million, down 18.8% year over year from $89.5 million, with gross profit margin decreasing from 43.0% to 38.2% over the same period.
 Get updates about the portfolio that has outperformed the market by 211.9%
since inception!
Get updates about the portfolio that has outperformed the market by 211.9%
since inception!