


John Bajkowski
is the president of AAII.
The S&P 500 index reached a new closing high in June, marking a sharp recovery from the correction lows experienced in April at the peak of trade policy uncertainty and tension. The S&P 500 has climbed 25% since its low on April 8, 2025, and continues to reach new record highs. The market has sustained its ascent despite a wall of worry, brushing off concerns about the Israel-Iran war and rising interest rates tied to deficit fears. Stronger-than-expected consumer sentiment and the U.S. Bureau of Labor Statistics’ upbeat June jobs report helped fuel the market’s positive momentum, especially toward the end of the month.
The S&P 500 index gained 5.1% during June, compared to a 4.3% gain for the Model Shadow Stock Portfolio. The S&P MidCap 400 index gained 3.6% during the month, while the S&P SmallCap 600 index returned 4.0%.
Smaller companies continue to lag larger companies. The S&P SmallCap 600 is down 4.5% year to date, compared to a 0.2% gain for the S&P MidCap 400 and a 6.2% gain for the S&P 500 through the end of June. The Model Shadow Stock Portfolio is down 3.3% year to date.
Growth stocks outperformed value stocks within the large-cap segment during the month, but lagged value stocks within the mid- and small-cap groups. In the large-cap segment, growth stocks were up 6.3% during June, while value stocks were up 3.7%. Large-cap growth stocks are up 8.9% year to date, compared to a 3.3% gain for large-cap value stocks. The gap is even larger over the last year, with large-cap growth stocks up 19.9%, while large-cap value stocks are up 9.6%.
Mid-cap growth stocks gained 3.4% during June, while mid-cap value stocks returned 3.8%. Mid-cap growth stocks are up 0.5% year to date, compared to a 0.1% loss for mid-cap value stocks. Mid-cap growth stocks have gained 4.3% over the last year, below the 11.1% gain seen for mid-cap value stocks.
Small-cap growth stocks gained 3.8% during June and are down 1.3% year to date, while small-cap value stocks gained 4.3% during the month and are down 7.6% for the first half of this year. Small-cap growth stocks have returned 4.7% over the last year, compared to a 4.3% gain for small-cap value stocks.

Market breadth remained strong during the month. Within the S&P 500, there were 340 advancing issues, compared to 163 declining issues—a ratio of 2.09, up from a ratio of 1.34 year to date. Ten of the 11 S&P 500 sectors were up during June. Information technology was the strongest sector for the second month in a row, up 9.8% during June and now up 8.1% year to date. Consumer staples was the weakest sector, down 1.9% during the month, lowering its year-to-date performance to 6.4%.
All 11 sectors were up again within the S&P MidCap 400 during June. There were 271 advancing issues, compared to 128 declining issues—a ratio of 2.12, up from a ratio of 0.85 year to date. A ratio below 1.00 indicates that there were more declining issues than advancing issues for the first half of the year. The difference between the best-performing sector (information technology, up 8.0%) and worst-performing sector (utilities, up 0.3%) was 7.7 percentage points. Utilities remains the best-performing S&P MidCap 400 sector over the last year, with a total return of 23.4%, while health care is the weakest, down 7.1%. Utilities is also the best-performing S&P MidCap 400 sector year to date, up 9.4%, while health care is also the weakest, down 8.3%.
The variability of returns was larger among the S&P SmallCap 600 sectors during June. Information technology was up 8.5% during the month, while consumer staples was down 5.5%. Investors rotated out of the defensive consumer staples sector and into risker technology stocks. The financials sector is the strongest S&P SmallCap 600 sector over the last year, up 22.0%. The energy sector is the weakest, down 24.5% over the last year.
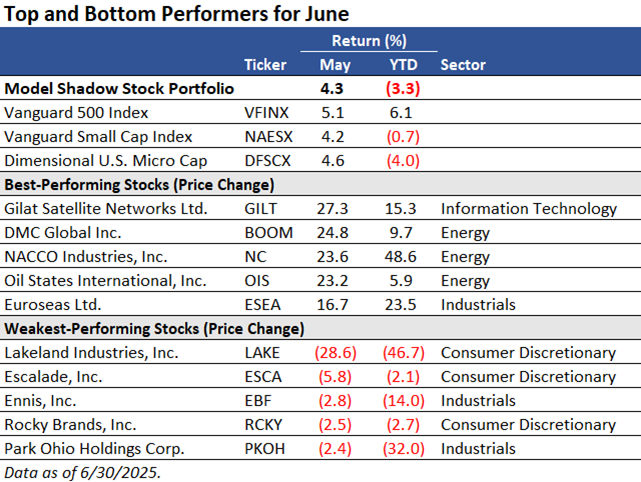
Gilat Satellite Networks Ltd.  (GILT) was the best-performing holding in the Model Shadow Stock Portfolio during June, with its stock price moving up as it secured a number of meaningful contracts during the month. Gilat Satellite provides satellite-based broadband communication solutions in the U.S. and internationally. Gilat Satellite was incorporated in 1987 and is headquartered in Petah Tikva, Israel. The other top-performing stocks have ties to the energy sector, which benefited from a rise in oil prices during the peak of the Israel-Iran war.
The weakest Model Shadow Stock Portfolio holdings are tied to economically sensitive sectors. Lakeland Industries Inc. (LAKE) lost 28.6% during June after it reported a loss of $0.18 per share during its first-quarter 2026 ended April 30, 2025, while analysts were expecting a gain of $0.22 per share. The loss pushed its trailing four-quarter earnings into the red, placing the stock on earnings probation. Lakeland Industries manufactures and sells industrial protective clothing and accessories for the industrial and public protective clothing market worldwide. Management acknowledged the negative impact of tariff-related delays and uncertainties on the company’s results and future outlook. Due to these challenges, Lakeland Industries lowered guidance for its fiscal-year 2026 ending in January to the lower end of its previous range.
Additional news for the model portfolio holdings is presented at the end of the email.
As of July 14, 18 stocks met the initial selection criteria for the Model Shadow Stock Portfolio, compared to 20 stocks one month ago. AAII members can see and research which companies are currently passing the initial selection criteria in the Shadow Stock Ideas table on AAII.com. The list of new Shadow Stock Ideas is updated daily—Tuesday through Saturday.
Of the 18 qualifying companies, 11 are currently held in the Model Shadow Stock Portfolio, unchanged from last month. The 11 companies currently qualifying include: Alpha Pro Tech Ltd. (APT), Fonar Corp. (FONR), Friedman Industries Inc. (FRD), NACCO Industries Inc. (NC), NCS Multistage Holdings Inc. (NCSM), Oil States International Inc. (OIS), Olympic Steel Inc. (ZEUS), Park Ohio Holdings Corp. (PKOH), Regis Corp. (RGS), Rocky Brands Inc. (RCKY) and StealthGas Inc. (GASS).
Qualifying companies are those held in the Model Shadow Stock Portfolio that currently meet the initial portfolio addition rules. (They are designated as “currently qualifies” in the Notes column of the Model Shadow Stock Portfolio table on AAII.com. However, if you go online, the notes may not match the list discussed here since the notes on the website table are dynamically updated daily.)
Euroseas Ltd. (ESEA) and Smith Douglas Homes Corp. (SDHC) had their price-to-book-value (P/B) ratios exceed the maximum initial level to qualify, while the price-to-book ratios declined for Friedman Industries and Regis, allowing them to pass the Shadow Stock screen again.
As of July 14, Smith Douglas Homes had the highest price-to-book ratio in the Model Shadow Stock Portfolio. Its ratio of 2.41 is above the 0.90 maximum value used for initially qualifying a stock for inclusion in the portfolio. However, stocks are not removed from the portfolio until their price-to-book ratio rises to three times the initial maximum value (2.70). The company was added to the portfolio based on a price-to-book calculation that included minority interest of subsidiaries. While minority interest, also known as noncontrolling interest, is presented within the equity portion of a company’s balance sheet, it reflects the portion of a subsidiary’s equity that is not owned by the parent company. The price-to-book ratio has been modified to exclude minority interest, which is reflected in the higher price-to-book calculation for Smith Douglas Homes.
Covenant Logistics Group Inc. (CVLG) continues to have the highest market capitalization in the portfolio, with a value of $663.6 million as of July 14. The Model Shadow Stock Portfolio looks for stocks with a market cap (share price times shares outstanding) greater than $30 million but less than $400 million when adding stocks to the portfolio. Holdings with a market cap three times the initial market-cap maximum ($400 million × 3 = $1.2 billion) at the time of a quarterly review are removed from the portfolio, assuming there is a suitable replacement.
Click here to see the current addition and deletion rules for the portfolio.
The next quarterly review of the AAII Model Shadow Stock Portfolio will take place around the beginning of September 2025, after most of the holdings have announced their quarterly earnings. If there are any changes to the model portfolio, they will be announced in the Model Shadow Stock Portfolio Update email. Sign up for this email so you don’t miss it!
(07/01/2025)
Amplify Energy entered into a definitive agreement to sell all of its nonoperated working interest in its Eagle Ford Group assets to Murphy Oil Corp. (MUR) unit Murphy Exploration & Production Co. for a contract price of $23.0 million, subject to certain post-closing adjustments. The sale closed on July 1, and has an effective date of June 15. Proceeds from the sale are expected to be used to pay down Amplify Energy’s debt and enhance the company’s liquidity.
(06/23/2025)
Ennis reported diluted earnings of $0.38 per share for its fiscal first-quarter 2025 ended May 31, down 7.6% from $0.41 per share in the prior-year quarter. Net sales were $97.2 million, down 5.7% year over year from $103.1 million. Operating income was $13.3 million, down 3.3% year over year from $13.7 million.
 Get updates about the portfolio that has outperformed the market by 211.9%
since inception!
Get updates about the portfolio that has outperformed the market by 211.9%
since inception!