


John Bajkowski
is the president of AAII.
The S&P 500 index continued its upward march during July, with earnings and tariffs dominating financial markets. The S&P 500 gained 2.2% during July, compared to a 1.7% loss for the Model Shadow Stock Portfolio. The S&P MidCap 400 index gained 1.6% during July, while the S&P SmallCap 600 index gained 0.9%.
Smaller companies continue to lag larger companies, and growth stocks outperformed value stocks in the large-cap and mid-cap segments during July. The S&P 500 has a total return of 8.6% year to date and is up 16.3% over the last year. The S&P SmallCap 600 is down 3.6% year to date, and down 4.7% over the last year. Meanwhile, the S&P MidCap 400 is up 1.8% year to date and up 3.3% over the last year.
In the large-cap segment, growth stocks were up 3.4% for the month, while value stocks were up 0.9%. Large-cap growth stocks are now up 12.6% year to date, while large-cap value stocks are up 4.2%. Large-cap growth stocks are up 25.6% over the last year, compared to a return of 5.6% for large-cap value stocks.
Mid-cap growth stocks gained 2.2% during July, while mid-cap value stocks gained 1.0%. Mid-cap growth stocks are up 2.7% year to date, while mid-cap value stocks are now up 0.9%. Looking back one year, mid-cap growth stocks are up 2.2%, compared to a 4.3% gain for mid-cap value stocks.
Small-cap growth stocks gained only 0.6% during July and are still down 0.7% this year. Small-cap value stocks gained 1.3% during the month and are down 6.4% year to date. Small-cap growth stocks are down 4.1% over the last year, while small-cap value stocks are down 5.4% over the same period.

Market breadth weakened during the month but remained positive for large-cap stocks. Within the S&P 500, there were 281 advancing issues, compared to 224 declining issues—a ratio of 1.25, down from 2.09 last month. Six of the 11 S&P 500 sectors were up during July, down from 10 out of 11 in June. Information technology was once again the strongest sector for the second month in a row, up 5.2% during the month and now up 13.7% year to date. Health care was the weakest sector, down 3.3% during the month, lowering its year-to-date performance to negative 4.3%. Health care and consumer discretionary are the only S&P 500 sectors down year to date. The new administration’s policies, particularly those related to drug pricing, tariffs and potential cuts to Medicare and Medicaid funding, created significant uncertainty and negatively impacted the health care sector’s outlook.
Eight of the 11 sectors were up within the S&P MidCap 400 during July. There were 225 advancing issues, compared to 177 declining issues—a ratio of 1.27, down from 2.12 last month. The difference between the best-performing sector (industrials, up 5.0%) and worst-performing sector (materials, down 0.9%) was 5.9 percentage points. Utilities remain the best-performing S&P MidCap 400 sector this year, with a total return of 13.4%, while health care is the weakest, down 9.0% year to date. Utilities is also the best-performing S&P MidCap 400 sector over the 12 months, up 16.2%, while health care is also the weakest, down 12.7%.
The variability of returns was larger among the S&P SmallCap 600 sectors during July. The materials sector was up 5.7% during the month, while health care was down 4.7%. The industrials sector is the strongest S&P SmallCap 600 sector this year, up 5.4%. The energy sector is the weakest year to date, down 17.1%, but it did increase 2.3% during July as crude oil closed up 6.4% for the month. There were 291 advancing issues, compared to 313 declining issues in the S&P SmallCap 600 during July—a ratio of 0.93, down from 2.31 last month. A ratio below 1.00 indicates that there were more declining issues than advancing issues.
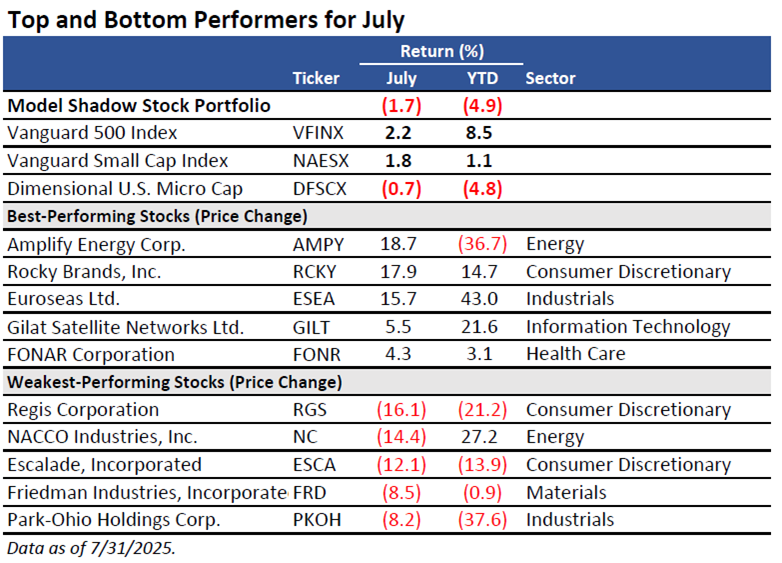
Energy company Amplify Energy Corp.  (AMPY) was the best-performing holding in the Model Shadow Stock Portfolio during July, with its stock price moving up as the company selected a new president and CEO, while also unveiling a series of strategic initiatives aimed at optimizing its portfolio and financial performance. Amplify Energy hired TenOaks Energy Advisors to explore the complete divestiture of its assets in East Texas and Oklahoma. This move aimed to make the company more oil-weighted and reduce its operating footprint.
The weakest Model Shadow Stock Portfolio holding was Regis Corp. (RGS), down 16.1%. Regis owns and franchises hair care salons in North America. The company reported consolidated revenue of $57.0 million for its fiscal third quarter of 2025 ended March 31 versus $49.2 million for the same quarter one year ago. The growth was driven by increased company-owned salon revenue, offset by lower royalties, non-margin franchise rental income and lower advertising fund contributions. Same store sales were up 1.1% year over year for Supercuts, but down across 1.1% across the consolidated group. Soon after the quarterly report, the company announced the resignation of CEO Matthew Doctor, effective June 30, 2025, and the appointment of an interim CEO.
Additional news for the model portfolio holdings is presented at the end of the email.
As of Augst 8, 25 stocks met the initial selection criteria for the Model Shadow Stock Portfolio, compared to 18 stocks one month ago. AAII members can see and research which companies are currently passing the initial selection criteria in the Shadow Stock Ideas table on AAII.com. The list of new Shadow Stock Ideas is updated daily—Tuesday through Saturday.
Of the 25 qualifying companies, 12 are currently held in the Model Shadow Stock Portfolio, up from 11 last month, as Saga Communications Inc.’s (SGA) latest quarterly earnings moved into positive territory. The other companies currently qualifying include: Alpha Pro Tech Ltd. (APT), Fonar Corp. (FONR), Friedman Industries Inc. (FRD), NACCO Industries Inc. (NC), NCS Multistage Holdings Inc. (NCSM), Oil States International Inc. (OIS), Olympic Steel Inc. (ZEUS), Park-Ohio Holdings Corp. (PKOH), Regis, Rocky Brands Inc. (RCKY) and StealthGas Inc. (GASS).
Qualifying companies are those held in the Model Shadow Stock Portfolio that currently meet the initial portfolio addition rules. (They are designated as “currently qualifies” in the Notes column of the Model Shadow Stock Portfolio table on AAII.com. However, if you go online, the notes may not match the list discussed here since the notes on the website table are dynamically updated daily.)
As of August 8, Smith Douglas Homes Corp. (SDHC) had the highest price-to-book ratio in the Model Shadow Stock Portfolio. Its ratio of 2.07 is above the 0.90 maximum value used for initially qualifying a stock for inclusion in the portfolio. However, stocks are not removed from the portfolio until their price-to-book ratio rises to three times the initial maximum value (2.70).
Covenant Logistics Group Inc. (CVLG) continues to have the highest market capitalization in the portfolio, with a value of $613.7 million as of August 8. The Model Shadow Stock Portfolio looks for stocks with a market cap (share price times shares outstanding) greater than $30 million but less than $400 million when adding stocks to the portfolio. Holdings with a market cap three times the initial market-cap maximum ($400 million × 3 = $1.2 billion) at the time of a quarterly review are removed from the portfolio, assuming there is a suitable replacement.
Click here to see the current addition and deletion rules for the portfolio.
The next quarterly review of the AAII Model Shadow Stock Portfolio will take place around the beginning of September 2025, after most of the holdings have announced their quarterly earnings. If there are any changes to the model portfolio, they will be announced in the Model Shadow Stock Portfolio Update email. Sign up for this email so you don’t miss it!
(08/07/2025)
Alpha Pro Tech reported second-quarter 2025 diluted earnings of $0.12 per share down 20% year over year from $0.15 per share. Alpha Pro Tech does not have earnings coverage by S&P Global. Net sales were $16.7 million, up 2.4% from $16.3 million. Operating income was $1.3 million, down from $1.7 million over the same period. In the second quarter the company returned $800,000 to shareholders through the repurchase of common stock.
(08/11/2025)
Castor Maritime reported a first-quarter 2025 diluted earnings loss of $2.18 per share, down from earnings of $2.23 per share in the prior-year quarter. Castor Maritime does not have earnings coverage by S&P Global. Total vessel revenues were $11.3 million, down 44.6% year over year from $20.4 million.
Core Molding Technologies, Inc. (CMT)
(08/05/2025)
Core Molding Technologies reported second-quarter 2025 adjusted diluted earnings of $0.53 per share, down 27.4% from $0.73 per share in the prior-year quarter. Core Molding Technologies does not have earnings coverage by S&P Global. Net sales were $79.2 million, down 10.7% year over year from $88.7 million. Operating income was $5.2 million, down from $7.5 million over the same period. In the second quarter the company returned $1.3 million to shareholders through the repurchase of common stock.
Covenant Logistics Group, Inc. (CVLG)
(07/23/2025)
Covenant Logistics Group reported second-quarter 2025 adjusted diluted earnings of $0.45 per share, down 13.5% from $0.52 per share in the prior-year quarter. Earnings were 8.3% higher than the S&P Global consensus estimate of $0.415 per share. Total revenue was $302.9 million, up 5.3% year over year from $287.5 million. Operating income was $11.6 million, down from $15.6 million in the prior-year quarter.
(08/05/2025)
DMC Global reported second-quarter 2025 adjusted diluted earnings of $0.12 per share of $0.12, up 9.1% from $0.11 in prior-year quarter. Earnings were 118.2% higher than S&P Global consensus estimate of $0.055 per share. Net sales were $155.5 million, down 9.0% year over year. Operating income was $3.9 million, down from $6.5 million over the same period.
(08/01/2025)
Escalade reported second-quarter 2025 adjusted earnings of $0.13 per share, down 35.0% from $0.20 per share in the prior-year quarter. Escalade does not have earnings coverage by S&P Global. Net sales were $54.3 million, down 13.1% year over year from $62.5 million. Operating income was $2.6 million, down 41.2% year over year from $4.5 million.
During the quarter, the company returned $4.1 million to shareholders through dividends and $2.2 million through share repurchases.
(08/13/2025)
Euroseas reported second-quarter 2025 diluted earnings of $4.20 per share, up 11.7% from $3.76 per share in the prior-year quarter. Earnings were 20.9% higher than the S&P Global consensus estimate of $3.473 per share. Net revenue was $58.7 million, up 2.7% year over year from $57.2 million. Operating income was $42.3 million, up from $33.4 million in the prior-year quarter.
During the quarter, the company returned $1.2 million to shareholders through dividends.
Friedman Industries, Incorporated (FRD)
(08/07/2025)
Friedman Industries reported fiscal first-quarter 2026 diluted earnings of $0.71 per share, up 91.9% from $0.37 per share in the prior-year quarter. Friedman Industries does not have earnings coverage by S&P Global. Net sales were $134.8 million, up 17.7% year over year from $114.6 million. Earnings from operations were $7.0 million, up from a loss of $1.4 million over the same period.
Gilat Satellite Networks Ltd. (GILT)
(08/06/2025)
Gilat Satellite Networks reported second-quarter 2025 adjusted diluted earnings of $0.21 per share, up 110% the prior-year quarter and 472.7% higher than the S&P Global consensus estimate of $0.037 per share. Revenues were $105.0 million, up 37% year over year from $76.0 million. Operating income was $5.7 million, up from $2.8 million over the same period.
Kimball Electronics, Inc. (KE)
(08/13/2025)
Kimball Electronics reported adjusted diluted earnings of $0.34 per share for its fiscal fourth-quarter 2025 ended June 30, down 10.5% year over year from $0.38 per share. Earnings were 83.8% higher than the S&P Global consensus estimate of $0.185 per share. Net sales were $380.5 million, down 11.6% year over year from $430.2 million. Operating income was $16.5 million, down from $19.6 million in the prior-year quarter.
(08/06/2025)
Mistras Group reported second-quarter 2025 adjusted diluted earnings of $0.19 per share, down 9.5% from the prior-year quarter and 7.3% lower than S&P Global Market consensus estimate of $0.205 per share. Revenues were $185.4 million, down 2.3% from $189.8 million year over year. Operating income was $8.4 million, down from $12.0 million over the same period.
(08/06/2025)
Nacco Industries reported second-quarter 2025 diluted earnings of $0.44 per share, down 45.7% from $0.81 per share in the prior-year quarter. Nacco Industries does not have earnings coverage by S&P Global. Revenues were $68.2 million, up 30.4% year over year from $52.3 million. The company reported an operating loss of $51,000, down from an operating profit of $7.4 million in the same period last year. In the second quarter, the company paid $1.9 million to shareholders through dividends and returned $12.2 million through the repurchase of common stock.
Natural Gas Services Group, Inc. (NGS)
(08/11/2025)
Natural Gas Services reported second-quarter 2025 adjusted diluted earnings of $0.409 per share, down 4.7% year over year from $0.43 per share. Earnings were 34.0% higher than the S&P Global consensus estimate of $0.305 per share. Total revenue was $41.4 million, up 7.0% year over year from $38.5 million. Operating income was $9.9 million, up from $8.5 million in the prior-year quarter.
(07/30/2025)
Natural Gas Services declared a regular quarterly dividend of $0.10 per share, its first-ever dividend. The dividend is payable on August 22, to shareholders of record as of August 8. The stock will trade ex-dividend on Friday, August 8.
Oil States International, Inc. (OIS)
(07/31/2025)
Oil States International reported second-quarter 2025 adjusted diluted earnings of $0.09 per share, up 22.2% from $0.07 per share in the prior-year quarter. Earnings were 12.5% higher than the S&P Global consensus estimate of $0.08 per share. Net income was $2.8 million, up 116% year over year from $1.3 million. Income from operations was $5.3 million, up 158% year over year from $2.0 million.
Pangaea Logistics Solutions Ltd. (PANL)
(08/07/2025)
Pangea Logistics reported a second-quarter 2025 adjusted diluted loss of $0.02 per share, compared to earnings of $0.10 per share in the prior-year quarter. Earnings were 33.3% higher than the S&P Global consensus estimate for a loss of $0.03 per share. Total revenue was $156.7 million, up 19.2% year over year from $131.5 million. Operating income was $3.7 million, down from $7.6 million over the same period. In the second quarter, the company returned $3.2 million to shareholders through dividends and $1.0 million through the repurchase of common stock.
Park-Ohio Holdings Corp. (PKOH)
(08/06/2025)
Park-Ohio reported second-quarter 2025 adjusted diluted earnings of $0.75 per share, down 26.5% from the prior-year quarter but 4.9% higher than S&P Global consensus estimate of $0.715. Net sales were $400.1 million, down 7.5% year-over-year from $432.6 million. Operating was $20.1 million, down from $24.6 million over the same period. The company forecasts full-year 2025 net sales of $1.62 billion to $1.65 billion and adjusted earnings per share of $2.90 to $3.20.
(07/29/2025)
Rocky Brands reported second-quarter 2025 adjusted diluted earnings of $0.55 per share, up 223.5% from $0.17 per share in the prior-year quarter. Earnings were 124.5% higher than the S&P Global consensus estimate of $0.245 per share. Net sales were $105.6 million, up 6.5% year over year from $98.3 million. Income from operations was $7.2 million, up 58.7% year over year from $4.5 million.
Saga Communications, Inc. (SGA)
(08/07/2025)
Saga Communications reported second-quarter 2025 diluted earnings of $0.18 per share, down 55% year over year. Saga Communications does not have earnings coverage by S&P Global. Net operating revenue was $28.2 million, down 5.0% year over year from $29.7 million. Operating income was $1.4 million, down from $2.1 million over the same period. In the second quarter, the company returned $1.6 million to shareholders through dividends.
Smith Douglas Homes Corp. (SDHC)
(08/06/2025)
Smith Douglas Homes reported second-quarter 2025 diluted earnings of $1.34 per share, up year over year from $0.40 per share. Earnings were 482.8% higher than S&P Global consensus estimate of $0.246 per share. Revenues were $223.9 million, up 1.4% year-over year from $220.9 million. Net income was $16.4 million, down from $24.7 million over the same period.
Vishay Precision Group, Inc. (VPG)
(08/05/2025)
Vishay Precision Group reported second-quarter 2025 adjusted diluted earnings of $0.17 per share, down 45.2% from $0.31 per share in the prior-year quarter. Earnings were 325.0% higher than the S&P Global consensus estimate of $0.04 per share. Net revenues were $75.2 million, down 2.8% year over year from $77.4 million, with operating income decreasing from $5.9 million to $2.7 million over the same period. The company forecasts net revenues in the range of $73.0 million to $81.0 for the third quarter of 2025.
 Get updates about the portfolio that has outperformed the market by 211.9%
since inception!
Get updates about the portfolio that has outperformed the market by 211.9%
since inception!